
资源型地区工矿企业空间集聚与区域转型——以山西省为例
|
秦志琴(1980- ),女,山西长治人,博士,副教授,研究方向为资源型地区城镇化与区域转型。E-mail: qinzhiqin@sxu.edu.cn |
收稿日期: 2019-12-11
要求修回日期: 2020-02-19
网络出版日期: 2021-06-28
基金资助
国家自然科学基金项目(41501143)
国家自然科学基金项目(41671123)
国家自然科学基金项目(41701191)
山西省晋商文化研究课题(JSKTY201811)
版权
Agglomeration and regional transformation of coal mining enterprises: A case study of Shanxi province
Received date: 2019-12-11
Request revised date: 2020-02-19
Online published: 2021-06-28
Copyright
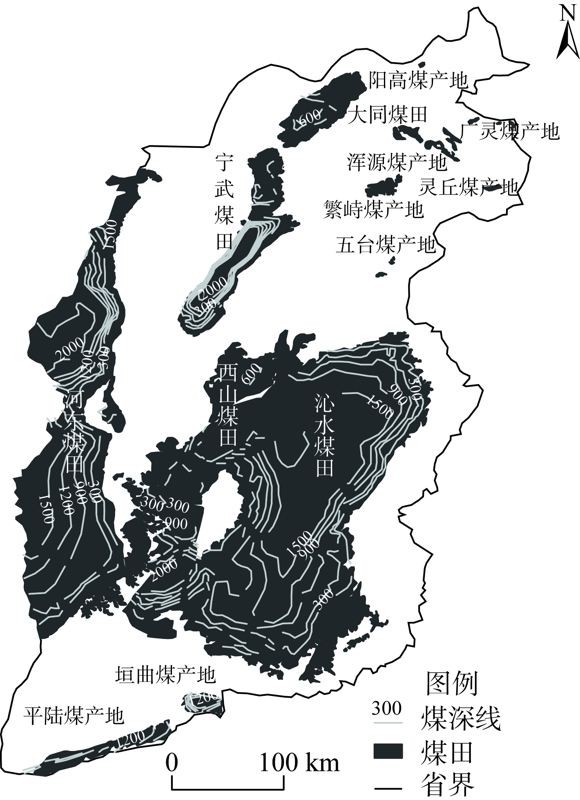
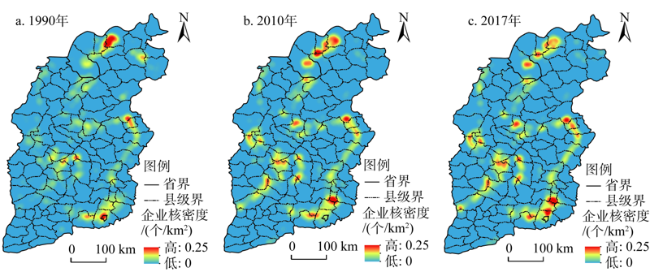
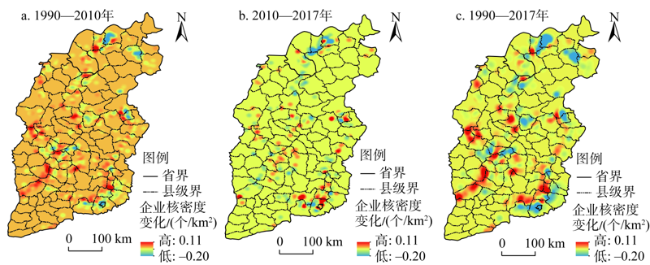
工矿企业是资源型地区实现区域转型的关键要素,研究工矿企业空间集聚的格局特征及驱动机理对于揭示资源型地区转型的空间过程及空间效应具有重要意义。以山西省为例,基于煤矿企业点数据,综合采用多种GIS空间分析方法,分析1990—2017年经济转型阶段,山西省煤矿企业空间集聚的格局演变及区位指向变化。进一步构建负二项回归模型分析山西省煤矿企业空间集聚演变的影响因素,解释资源型地区转型发展的驱动机理。结果表明:(1)煤矿企业整体集聚变化相对稳定,但发展内涵发生显著变化,企业趋向大型化、现代化、可持续化发展。(2)煤矿企业空间集聚逐步与煤层埋深线的岩层走向相吻合,并且表现出低坡度指向性、临交通线指向性特征。(3)宏观尺度上,煤矿企业空间集聚呈现以点状集聚为主到点状集聚与沿煤层线带状扩散并存的演变趋势;微观尺度上,煤矿企业核密度降低区域与核密度增加区域具有地理邻近性特征,空间上表现为煤矿企业的远郊区化过程。(4)资源禀赋对煤矿企业区位选择的影响最显著,地形坡度、路径依赖、省道、企业所有制性质、固定资产投资、区域面积等对煤矿企业的区位选择也具有显著影响,但是作用方向和强度存在差异;城镇化水平、铁路、高速公路等对煤矿企业区位选择的影响不显著。回归结果表明资源型地区的转型发展受自然基底条件、产业发展基础、区域发展阶段等多重因素的影响。
秦志琴 , 倪云松 , 姜晓丽 , 王让虎 . 资源型地区工矿企业空间集聚与区域转型——以山西省为例[J]. 自然资源学报, 2021 , 36(4) : 948 -964 . DOI: 10.31497/zrzyxb.20210411
Mining enterprises are the key elements for achieving regional transformation in resource-based regions. It is of great significance to study the spatial agglomeration characteristics and driving mechanisms of mining enterprises to reveal the spatial process and spatial effects of resource-based regional transformation. The paper takes Shanxi province as an example, and based on the point data of coal mining enterprises, adopts a variety of GIS spatial analysis methods to analyze the evolution of the spatial agglomeration pattern and location change of Shanxi's coal mining enterprises during economic transformation from 1990 to 2017. Furthermore, a negative binomial regression model is constructed to examine the influencing factors of the spatial agglomeration and evolution of coal mining enterprises in the province, and to explain the driving mechanism of the transformation and development of resource-based regions. The results show that: (1) The overall agglomeration changes of coal mining enterprises were relatively stable, but the development connotation has changed significantly, and the enterprises were trending toward large-scale, modern and sustainable development. (2) The spatial agglomeration of coal mining enterprises gradually tended to the direction of coal seam line, and showed the characteristics of low-slope directivity and directivity of adjacent traffic lines. (3) On the macro scale, the spatial concentration of coal mining enterprises presents a trend of dominance of clustering to coexistence of point clustering and band-shaped diffusion along the coal seam line. On the micro scale, the regions with reduced kernel density and regions with increased kernel density had geographical proximity characteristics, which spatially represented the suburbanization process of coal mining enterprises. (4) Resource endowment had the most significant impact on the location selection of coal mining enterprises. Terrain slope, path dependence, provincial roads, corporate ownership, fixed asset investment, and the area of region also had significant effects on location selection of coal mining enterprises. But there are differences in the direction and intensity; the level of urbanization, railways, highways and other elements have no significant impact on the location selection of coal mining enterprises, indicating that the quality of transformation in resource-based regions is constrained by factors such as natural base conditions, industrial development foundations, and regional development stages.
表1 矿井设计生产能力划分Table 1 Division of coal mine production capacity (104 t/a) |
| 矿井等级 | 特大型 | 大型 | 中型 | 小型 | ||
|---|---|---|---|---|---|---|
| 大型Ⅰ | 大型Ⅱ | 小型Ⅰ | 小型Ⅱ | |||
| 设计生产能力 | ≥1000 | 500、600、700、 800、900 | 120、150、180、240、 300、400 | 45、60、90 | 15、21、30 | ≤ 9 |
表2 山西省煤矿企业数量与规模的统计Table 2 Statistics on the number and scale of coal mining enterprises in Shanxi province |
| 年份 | 样本数/个 | 特大型 | 大型 | 中型 | 小型 | ||||||||
|---|---|---|---|---|---|---|---|---|---|---|---|---|---|
| 大型Ⅰ | 大型Ⅱ | 小型Ⅰ | 小型Ⅱ | ||||||||||
| 数量/个 | 占比/% | 数量/个 | 占比/% | 数量/个 | 占比/% | 数量/个 | 占比/% | 数量/个 | 占比/% | 数量/个 | 占比/% | ||
| 1990 | 1220 | 0 | 0 | 0 | 0 | 39 | 3.20 | 52 | 4.26 | 202 | 16.56 | 927 | 75.98 |
| 2010 | 1029 | 18 | 1.75 | 49 | 4.76 | 296 | 28.77 | 629 | 61.13 | 37 | 3.60 | 0 | 0 |
| 2017 | 1011 | 9 | 0.89 | 28 | 2.77 | 360 | 35.61 | 591 | 58.46 | 23 | 2.27 | 0 | 0 |
表3 山西省煤矿企业最邻近距离分析Table 3 NNI of large-scale coal mining enterprises in Shanxi province |
| 年份 | 样本数/个 | 平均最邻近距离/m | 期望平均最邻近距离/m | 最邻近指数(NNI) | Z检验值 | 显著性水平/% |
|---|---|---|---|---|---|---|
| 1990 | 1221 | 3118.54 | 5977.93 | 0.52 | -31.96 | 1 |
| 2010 | 1036 | 3415.19 | 6205.66 | 0.55 | -27.66 | 1 |
| 2017 | 1011 | 3205.24 | 6207.78 | 0.51 | -29.42 | 1 |
表4 1990—2017年山西省不同坡度范围内煤矿企业分布Table 4 The coal mining enterprises in different ranges of the slope in Shanxi province from 1990 to 2017 |
| 坡度 /(°) | 样本数 | 特大型 | 大型 | 中型 | 小型 | ||||||||||||
|---|---|---|---|---|---|---|---|---|---|---|---|---|---|---|---|---|---|
| 大型Ⅰ | 大型Ⅱ | 小型Ⅰ | 小型Ⅱ | ||||||||||||||
| 数量/个 | 占比/ % | 数量/个 | 占比/ % | 数量/个 | 占比/ % | 数量/个 | 占比/ % | 数量/ 个 | 占比/ % | 数量/个 | 占比/ % | 数量/个 | 占比/ % | ||||
| <5 | 1437 | 43.51 | 17 | 62.96 | 53 | 68.83 | 304 | 43.74 | 531 | 41.59 | 141 | 53.82 | 393 | 42.39 | |||
| 5~10 | 1028 | 31.86 | 5 | 18.52 | 18 | 23.38 | 227 | 32.66 | 413 | 32.47 | 79 | 30.15 | 286 | 30.85 | |||
| 10~15 | 462 | 14.32 | 3 | 11.11 | 5 | 6.49 | 94 | 13.53 | 217 | 17.06 | 22 | 8.40 | 121 | 13.05 | |||
| 15~25 | 333 | 10.32 | 2 | 7.41 | 1 | 1.30 | 70 | 10.07 | 113 | 8.88 | 20 | 7.63 | 127 | 13.70 | |||
| 总量 | 3260 | 100 | 27 | 100 | 77 | 100 | 695 | 100 | 1272 | 100 | 262 | 100 | 927 | 100 | |||
表5 1990—2017年山西省煤矿企业10 km缓冲区内分布Table 5 The coal mining enterprises in the 10 km buffer in Shanxi province from 1990 to 2017 |
| 年份 | 样本数 /个 | 铁路 | 高速公路 | 国道 | 省道 | |||||||
|---|---|---|---|---|---|---|---|---|---|---|---|---|
| 数量/个 | 占比/% | 数量/个 | 占比/% | 数量/个 | 占比/% | 数量/个 | 占比/% | |||||
| 1990 | 1220 | 425 | 34.83 | 3 | 0.25 | 586 | 48.03 | 952 | 78.03 | |||
| 2010 | 1034 | 548 | 53.00 | 477 | 46.13 | 433 | 41.88 | 839 | 81.14 | |||
| 2017 | 1011 | 545 | 53.91 | 493 | 48.76 | 451 | 44.61 | 811 | 80.21 | |||
表6 变量定义及其预期影响Table 6 Definition of independent variable and its expected impact |
| 变量 | 变量含义 | 预期影响 | |
|---|---|---|---|
| 被解释变量 | |||
| 煤矿数量 | 煤矿数量number | 各研究单元的煤矿数量/个(取对数) | |
| 解释变量 | |||
| 资源禀赋 | 煤层深度depth | 1=埋深小于1200 m,2=埋深为1200~1500 m | + |
| 地形条件 | 地表坡度slope | 各研究单元的平均坡度/(°)(取对数) | 不确定 |
| 路径依赖 | 煤炭产业从业数workers | 各研究单元滞后一期的煤炭产业从业人数/人(取对数) | + |
| 区域发展阶段 | 城镇化水平urbanization | 各研究单元的城镇化率/%(取对数) | - |
| 交通条件 | 铁路railway | 1=有,0=没有 | + |
| 高速公路highway | 1=有,0=没有 | + | |
| 国道stateroad | 1=有,0=没有 | + | |
| 省道provincialroad | 1=有,0=没有 | + | |
| 企业性质 | 国有企业(SOE) state-owned enterprise | 各研究单元的国有煤矿数量/个(取对数) | 不确定 |
| 地方企业local enterprise | 各研究单元的地方煤矿数量/个(取对数) | 不确定 | |
| 乡镇企业town enterprise | 各研究单元的乡镇煤矿数量/个(取对数) | 不确定 | |
| 政府调控 | 固定资产投资(FAI) fixed asset investment | 各研究单元的固定资产投资额(取对数) | + |
| 控制变量 | |||
| 区域面积 | 行政区域面积(area) | 各研究单元行政区域土地面积/104 km2(取对数) | + |
表7 煤炭企业数量负二项回归模型估计结果Table 7 Regression results of negative binomial model on the number of coal mining enterprises |
| 变量 | 模型1:全部年份 | 模型2:1990年 | 模型3:2010年 | 模型4:2017年 |
|---|---|---|---|---|
| depth1 | 1.408*** | 1.234*** | 2.046*** | 1.314*** |
| depth2 | 0.288*** | 0.105 | 0.164* | 0.445*** |
| slope | 0.037*** | 0.034* | 0.031** | 0.048** |
| path | 0.010* | 0.049** | 0.007** | 0.033** |
| urbanization | -0.001 | 0.000 | -0.000 | -0.001 |
| railway | -0.001 | 0.182 | 0.040 | -0.098 |
| high road | -0.010 | 0.345 | 0.055 | 0.186 |
| state road | 0.051 | 0.010 | 0.015 | 0.028 |
| provincial road | 0.422** | 0.098 | 0.351* | 0.921*** |
| SOE | 0.058*** | -0.093** | 0.064*** | 0.044** |
| local enterprise | 0.065*** | 0.016 | 0.065*** | 0.042*** |
| town enterprises | 0.068*** | 0.080*** | __ | __ |
| FAI | 0.125*** | 0.064 | 0.183*** | 0.252*** |
| area | -0.166** | -0.054 | -0.115 | -0.3456*** |
| 样本数/个 | 3260 | 1220 | 1029 | 1011 |
| Pseudo R2 | 0.2556 | 0.2520 | 0.3417 | 0.2813 |
注:***、**、*分别表示在1%、5%、10%水平上显著,2010年、2017年,小型企业已全部取缔,因此不做分析。 |
| [1] |
郭文炯. “资源诅咒”的空间结构解析: 核心边缘理论视角. 经济地理, 2014,34(3):17-23.
[
|
| [2] |
张复明, 景普秋. 资源型经济的形成: 自强机制与个案研究. 中国社会科学, 2008, (5):117-130.
[
|
| [3] |
景普秋, 王清宪. 煤炭资源开发与区域经济发展中的“福”与“祸”. 中国工业经济, 2008, (7):80-90.
[
|
| [4] |
安树伟, 常瑞祥, 等. 山西省资源型经济转型. 北京: 经济科学出版社, 2018: 25-37.
[
|
| [5] |
斯日吉模楞, 毛培. 资源型地区自然资源对经济增长影响的实证分析. 自然资源学报, 2019,34(12):2491-2503.
[
|
| [6] |
陈建军, 崔春梅, 陈菁菁. 经济、空间连续性与企业区位选择. 管理世界, 2011, (6):63-75.
[
|
| [7] |
赵浚竹, 孙铁山, 李国平. 中国汽车制造业集聚与企业区位选择. 地理学报, 2014,69(6):850-862.
[
|
| [8] |
ANDERSON W P著, 安虎森,等译. 经济地理学. 北京: 中国人民大学出版社, 2017: 141-154.
[
|
| [9] |
陈建军, 陈国亮, 黄洁. 经济地理学视角下的生产性服务业集聚及其影响因素研究. 管理世界, 2009, (4):3-95.
[
|
| [10] |
|
| [11] |
贺灿飞. 演化经济地理研究. 北京: 经济科学出版社, 2018: 48-54.
[
|
| [12] |
贺灿飞. 区域产业发展演化: 路径依赖还是路径创造. 地理研究, 2018,37(7):1253-1267.
[
|
| [13] |
陈建军, 黄洁. 集聚视角下中国的产业、城市和区域. 浙江大学学报: 人文社会科学版, 2008,38(4):12-21.
[
|
| [14] |
徐康宁, 韩剑. 中国钢铁产业的集中度、布局与结构优化研究. 中国工业经济, 2006, (2):37-44.
[
|
| [15] |
贺灿飞, 朱彦刚, 朱晟君. 产业特性、区域特征与中国制造业省区集聚. 地理学报, 2010,65(10):1218-1228.
[
|
| [16] |
张晓平, 孙磊. 北京市制造业空间格局演化及影响因子分析. 地理学报, 2012,67(10):1308-1316.
[
|
| [17] |
吕卫国, 陈雯. 制造业企业区位选择与南京城市空间重构. 地理学报, 2009,64(2):142-152.
[
|
| [18] |
吴爱芝, 孙铁山, 李国平. 中国纺织服装产业的空间集聚与区域转移. 地理学报, 2013,68(6):775-790.
[
|
| [19] |
刘颖, 郭琪, 贺灿飞. 城市区位条件与企业区位动态研究. 地理研究, 2016,35(7):1301-1313.
[
|
| [20] |
李佳洺, 张文忠, 李业锦, 等. 基于微观企业数据的产业空间集聚特征分析. 地理研究, 2016,35(1):95-107.
[
|
| [21] |
薛东前, 黄晶, 马蓓蓓, 等. 西安市文化娱乐业的空间格局及热点区模式研究. 地理学报, 2014,69(4):541-552.
[
|
| [22] |
方忠权. 广州会展企业空间集聚特征与影响因素. 地理学报, 2013,68(4):464-476.
[
|
| [23] |
赵新正, 宁越敏, 魏也华. 上海外资生产空间演变与影响因素. 地理学报, 2011,66(10):1390-1402.
[
|
| [24] |
韩会然, 杨成凤, 宋金平. 北京批发企业空间格局演化与区位选择因素. 地理学报, 2018,73(2):219-231.
[
|
| [25] |
毕秀晶, 汪明峰, 李健, 等. 上海大都市区软件产业空间集聚与郊区化. 地理学报, 2011,66(12):1682-1694.
[
|
| [26] |
毛熙彦, 刘颖, 贺灿飞. 中国资源性产业空间演变特征. 自然资源学报, 2015,30(8):1332-1342.
[
|
| [27] |
杨显明, 焦华富, 许吉黎. 煤炭资源型城市空间结构演化过程、模式及影响因素. 地理研究, 2015,34(3):513-523.
[
|
| [28] |
王劲峰, 廖一兰, 刘鑫. 空间数据分析教程. 北京: 科学出版社, 2014: 76-79.
[
|
| [29] |
汤国安, 杨昕. 地理信息系统空间分析实验教程. 北京: 科学出版社, 2007: 258-259.
[
|
| [30] |
山西煤炭工业志. 北京: 煤炭工业出版社, 2015: 69.
[
|
| [31] |
高天明, 沈镭, 刘立涛, 等. 中国煤炭资源不均衡性及流动轨迹. 自然资源学报, 2013,28(1):92-103.
[
|
/
| 〈 |
|
〉 |