
巴黎协定下中国碳排放权省域分配及减排潜力评估研究
|
田云(1986- ),男,湖北长阳人,博士,副教授,研究方向为资源与环境经济,低碳经济与低碳农业。E-mail: tianyun1986@163.com |
收稿日期: 2019-12-04
要求修回日期: 2020-03-17
网络出版日期: 2021-06-28
基金资助
国家自然科学基金项目(71903197)
湖北省社会科学基金项目(2019052)
中南财经政法大学中央高校基本科研业务费专项资金资助项目(2722020JCT020)
版权
Provincial distribution of China's carbon emission rights and assessment of its emission reduction potential under the Paris Agreement
Received date: 2019-12-04
Request revised date: 2020-03-17
Online published: 2021-06-28
Copyright
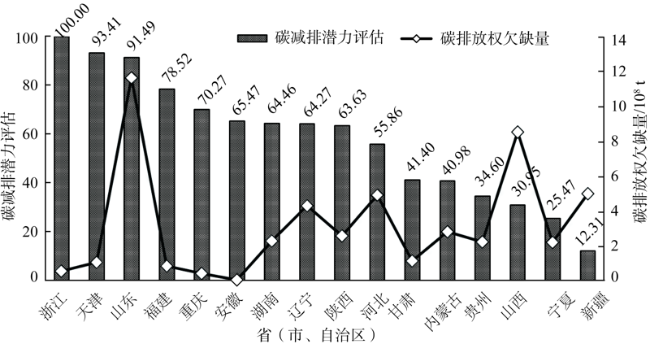
通过构建碳排放权区域分配模型完成了省域分配,在此基础上与当前各地实际碳排放量进行比对,明晰了各自初始空间余额;而后对碳排放权欠缺地区的碳减排潜力进行了综合评估。研究结果表明:(1)我国30个省区碳排放权分配存在较大差异,其中云南配额最高,占比高达10.53%;宁夏配额最少,占比仅为0.28%。(2)全国有14个省区碳排放权初始空间余额表现出盈余状态,根据成因差异可大致分为“低排放、高配额”“低排放、低配额”以及“高排放、高配额”等三种类型;其他16个地区均表现出一定程度的欠缺,结合数值差异可划分为以江苏等4地为代表的轻度欠缺地区,以天津等7地为代表的中度欠缺地区,以及以辽宁等5地为代表的重度欠缺地区。(3)浙江、天津、山东等3地目前所具备的碳减排潜力要明显高于其他地区,而各地区的碳减排潜力水平虽与其碳排放权欠缺量表现出了一定趋同性但并非完全一致。
田云 , 林子娟 . 巴黎协定下中国碳排放权省域分配及减排潜力评估研究[J]. 自然资源学报, 2021 , 36(4) : 921 -933 . DOI: 10.31497/zrzyxb.20210409
In this paper, the provincial distribution is completed by constructing a regional distribution model of carbon emission rights. On this basis, the initial space balance is clarified by comparing with the actual carbon emissions in various places. Then, the potential of carbon emission reduction in regions lacking carbon emission rights is comprehensively evaluated. The results show that: (1) The distribution of carbon emission rights in 30 provinces of China is quite different, among which Yunnan has the highest quota, accounting for 10.53%, while Ningxia has the least quota, accounting for only 0.28%. (2) The initial space balance of carbon emission rights in 14 provinces of China shows a surplus state, which can be divided into three types according to the difference of causes, namely "low emission, high quota", "low emission, low quota" and "high emission, high quota". All the other 16 provinces show some degree of deficiency. Combined with the numerical differences, they can be identified into three types: 4 provinces with slight deficiency represented by Jiangsu, 7 with moderate deficiency represented by Tianjin, and 5 with severe deficiency represented by Liaoning. (3) Currently, Zhejiang, Tianjin and Shandong have significantly higher carbon emission reduction potential than other regions, while the carbon emission reduction potential level of each region shows certain convergence but is not completely consistent with a lack of carbon emission rights.
表1 碳排放权分配的指标体系Table 1 Indicator system for distribution of carbon emission rights |
| 指标 | 指标度量 | 作用方向 | |
|---|---|---|---|
| 公平性 | 人口数量 | 从业劳动力数量/104人 | + |
| 国内生产总值 | GDP实际数值/108元 | + | |
| 效率性 | 碳生产力 | GDP/碳排放量/(元/t) | + |
| 保障性 | 林木蓄积量 | 林木资源蓄积数量/m3 | + |
| 农作物播种面积 | 农作物实际播种面积/103 hm2 | + | |
表2 碳排放权欠缺地区碳减排潜力评价指标体系Table 2 Evaluation index system of carbon emission reduction potential in areas with a lack of carbon emission rights |
| 指标 | 指标度量 | 指标方向 | |
|---|---|---|---|
| 欠缺现状 | 欠缺数量 | 碳排放权实际欠缺量/108 t | 负向 |
| 欠缺程度 | 碳排放权/碳排放量/% | 正向 | |
| 减排现状 | 减排难度 | 碳的影子价格/(元/t) | 负向 |
| 减排效率 | 近5年年均减排速率/% | 正向 | |
| 经济发展 | 总体水平 | GDP总量/108元 | 正向 |
| 发展程度 | GDP/总人口/(元/人) | 正向 | |
| 政策支持 | R&D投入 | R&D投入金额/GDP/% | 正向 |
| 环境污染防治投入 | 环境污染防治投入额/GDP/% | 正向 | |
表3 2017年我国30个省级行政区碳排放量、碳排放权分配额及其初始余额Table 3 Carbon emissions, allocation of carbon emission rights and their initial balances in 30 provinces of China |
| 地区 | 碳排放权分配额 | 碳排放量 | 碳排放权初始空间余额 | ||||||||||
|---|---|---|---|---|---|---|---|---|---|---|---|---|---|
| 组别 | 地区 | 数量/108 t | 占比/% | 排名 | 数量/108 t | 占比/% | 排名 | 数量/108 t | 排名 | 类型 | |||
| I区组8.92% | 北京 | 7.885 | 5.85 | 6 | 0.805 | 0.60 | 28 | 7.080 | 4 | 充分盈余 | |||
| 上海 | 4.143 | 3.07 | 13 | 2.612 | 1.94 | 22 | 1.531 | 9 | 中度盈余 | ||||
| Ⅱ区组 15.00% | 河北 | 3.835 | 2.84 | 16 | 8.747 | 6.48 | 3 | -4.912 | 27 | 重度欠缺 | |||
| 浙江 | 4.050 | 3.00 | 14 | 4.586 | 3.40 | 11 | -0.535 | 17 | 轻度欠缺 | ||||
| 安徽 | 4.514 | 3.35 | 12 | 4.544 | 3.37 | 12 | -0.030 | 15 | 轻度欠缺 | ||||
| 湖北 | 6.098 | 4.52 | 8 | 4.163 | 3.09 | 13 | 1.935 | 7 | 中度盈余 | ||||
| 湖南 | 1.738 | 1.29 | 21 | 3.995 | 2.96 | 15 | -2.258 | 23 | 中度欠缺 | ||||
| Ⅲ区组 20.63% | 江苏 | 8.765 | 6.50 | 5 | 8.667 | 6.42 | 4 | 0.098 | 14 | 略微盈余 | |||
| 山东 | 2.819 | 2.09 | 18 | 14.465 | 10.72 | 1 | -11.646 | 30 | 重度欠缺 | ||||
| 河南 | 9.139 | 6.77 | 4 | 6.302 | 4.67 | 8 | 2.837 | 5 | 中度盈余 | ||||
| 广东 | 7.109 | 5.27 | 7 | 6.698 | 4.97 | 7 | 0.410 | 13 | 略微盈余 | ||||
| Ⅳ区组 6.37% | 天津 | 0.693 | 0.51 | 27 | 1.733 | 1.28 | 26 | -1.040 | 19 | 中度欠缺 | |||
| 山西 | 0.591 | 0.44 | 29 | 9.118 | 6.76 | 2 | -8.528 | 29 | 重度欠缺 | ||||
| 海南 | 1.619 | 1.20 | 22 | 0.695 | 0.52 | 29 | 0.924 | 11 | 略微盈余 | ||||
| 重庆 | 1.210 | 0.90 | 24 | 1.614 | 1.20 | 27 | -0.404 | 16 | 轻度欠缺 | ||||
| 贵州 | 0.900 | 0.67 | 26 | 3.106 | 2.30 | 17 | -2.206 | 22 | 中度欠缺 | ||||
| 甘肃 | 1.058 | 0.78 | 25 | 2.172 | 1.61 | 25 | -1.114 | 20 | 中度欠缺 | ||||
| 青海 | 1.476 | 1.09 | 23 | 0.642 | 0.48 | 30 | 0.834 | 12 | 略微盈余 | ||||
| 宁夏 | 0.382 | 0.28 | 30 | 2.570 | 1.90 | 23 | -2.187 | 21 | 中度欠缺 | ||||
| 新疆 | 0.669 | 0.50 | 28 | 5.641 | 4.18 | 9 | -4.972 | 28 | 重度欠缺 | ||||
| Ⅴ区组 33.69% | 内蒙古 | 5.838 | 4.33 | 9 | 8.636 | 6.40 | 5 | -2.798 | 25 | 中度欠缺 | |||
| 黑龙江 | 11.704 | 8.68 | 3 | 4.058 | 3.01 | 14 | 7.646 | 3 | 充分盈余 | ||||
| 四川 | 13.694 | 10.15 | 2 | 3.551 | 2.63 | 16 | 10.143 | 2 | 充分盈余 | ||||
| 云南 | 14.209 | 10.53 | 1 | 2.458 | 1.82 | 24 | 11.751 | 1 | 充分盈余 | ||||
| Ⅵ区组 15.39% | 辽宁 | 3.008 | 2.23 | 17 | 7.289 | 5.40 | 6 | -4.280 | 26 | 重度欠缺 | |||
| 吉林 | 3.921 | 2.91 | 15 | 2.650 | 1.96 | 21 | 1.271 | 10 | 中度盈余 | ||||
| 福建 | 1.994 | 1.48 | 20 | 2.821 | 2.09 | 18 | -0.827 | 18 | 轻度欠缺 | ||||
| 江西 | 4.855 | 3.60 | 10 | 2.752 | 2.04 | 20 | 2.103 | 6 | 中度盈余 | ||||
| 广西 | 4.515 | 3.35 | 11 | 2.790 | 2.07 | 19 | 1.725 | 8 | 中度盈余 | ||||
| 陕西 | 2.470 | 1.83 | 19 | 5.020 | 3.72 | 10 | -2.550 | 24 | 中度欠缺 | ||||
| [1] |
|
| [2] |
陈文颖, 吴宗鑫. 气候变化的历史责任与碳排放限额分配. 中国环境科学, 1998, (6):2-6.
[
|
| [3] |
|
| [4] |
潘家华. 发展分析的概念构架与经验数据: 以对碳排放空间的需求为例. 中国社会科学, 2002, (6):15-25, 204.
[
|
| [5] |
胡振, 王玥, 何晶晶, 等. 西部城镇家庭能源消费及其碳排放的区域特征研究: 基于中国家庭追踪调查的调研数据. 干旱区资源与环境, 2019,33(4):1-8.
[
|
| [6] |
彭水军, 张文城, 孙传旺. 中国生产侧和消费侧碳排放量测算及影响因素研究. 经济研究, 2015,50(1):168-182.
[
|
| [7] |
王锋, 吴丽华, 杨超. 中国经济发展中碳排放增长的驱动因素研究. 经济研究, 2010,45(2):123-136.
[
|
| [8] |
许广月, 宋德勇. 中国碳排放环境库兹涅茨曲线的实证研究: 基于省域面板数据. 中国工业经济, 2010, (5):37-47.
[
|
| [9] |
|
| [10] |
黄蕊, 王铮, 钟章奇, 等. 区域贸易隐含碳排放和SO2排放的投入产出分析: 以江苏为例. 自然资源学报, 2017,32(5):854-863.
[
|
| [11] |
|
| [12] |
|
| [13] |
|
| [14] |
|
| [15] |
李锴, 齐绍洲. 贸易开放、经济增长与中国二氧化碳排放. 经济研究, 2011,46(11):60-72, 102.
[
|
| [16] |
|
| [17] |
|
| [18] |
周迪, 王雪芹. 中国碳排放效率与产业结构升级的耦合度及耦合路径. 自然资源学报, 2019,34(11):2305-2316.
[
|
| [19] |
林伯强, 孙传旺. 如何在保障中国经济增长前提下完成碳减排目标. 中国社会科学, 2011, (1):64-76, 221.
[
|
| [20] |
涂正革 中国的碳减排路径与战略选择: 基于八大行业部门碳排放量的指数分解分析. 中国社会科学, 2012, (3):7-94, 206-207.
[
|
| [21] |
|
| [22] |
黄志平. 碳排放权交易有利于碳减排吗? 基于双重差分法的研究. 干旱区资源与环境, 2018,32(9):36-40.
[
|
| [23] |
王勇, 程瑜, 杨光春, 等. 2020和2030年碳强度目标约束下中国碳排放权的省区分解. 中国环境科学, 2018,38(8):3180-3188.
[
|
| [24] |
周迪, 郑楚鹏, 华诗润, 等. 公平与效率协调视角下的中国碳减排潜力与路径. 自然资源学报, 2019,34(1):80-91.
[
|
| [25] |
田云, 陈池波. 中国碳减排成效评估、后进地区识别与路径优化. 经济管理, 2019, (6):23-37.
[
|
| [26] |
单豪杰. 中国资本存量K的在估算: 1952—2006年. 数量经济与技术经济研究, 2008,25(10):17-31.
[
|
| [27] |
王慧慧, 刘恒辰, 何霄嘉, 等. 基于代际公平的碳排放权分配研究. 中国环境科学, 2016,36(6):1895-1904.
[
|
/
| 〈 |
|
〉 |