
食物转化视角下我国家庭食物浪费程度与影响因素——基于CHNS数据的实证分析
|
李丰(1974- ),男,河北邯郸,博士,教授,研究方向为农业经济、粮食经济、粮食安全。E-mail: leefeng_gifu@163.com |
收稿日期: 2019-12-06
要求修回日期: 2020-03-02
网络出版日期: 2021-06-28
基金资助
2015粮食公益性行业科研专项(201513004-7)
国家自然科学基金项目(71773044)
2018年江苏省研究生科研创新计划项目(KYCX18_1284)
版权
The degree and influencing factors of household food waste in China from the perspective of food conversion: An empirical analysis based on CHNS database
Received date: 2019-12-06
Request revised date: 2020-03-02
Online published: 2021-06-28
Copyright
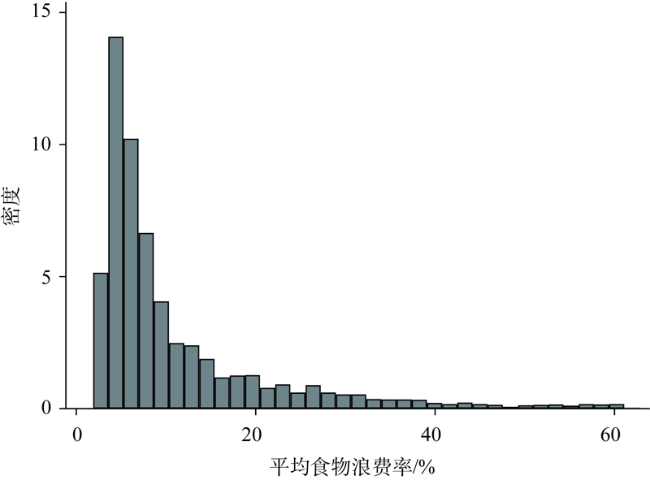
长期以来,我国食物供应充足稳定,但是人口、环境等因素不断对此提出挑战,并且我国每年的食物损失和浪费数量十分惊人。从食物转化视角将食物浪费率定义为家庭食物消费中未能正常转化为家庭成员身体质量指数的比例,采用随机前沿模型并基于CHNS数据估算我国家庭食物浪费率,并探讨家庭异质性特征的影响。结果显示:家庭平均浪费率为11.28%;家庭规模越小、孩子或老年人的数量越多、收入水平越高、南方地区、户主的受教育程度越低、主要女性成员的受教育程度越高或者有工作、对膳食知识掌握程度越低的家庭浪费率越高。因此,要鼓励生产小包装食物和小型厨具,指导家庭根据实际需求购买食物,加强推广食育运动,开展节粮活动并教授减损措施。
李丰 , 丁圆元 , 蔡荣 . 食物转化视角下我国家庭食物浪费程度与影响因素——基于CHNS数据的实证分析[J]. 自然资源学报, 2021 , 36(4) : 811 -826 . DOI: 10.31497/zrzyxb.20210401
The food supply in China has been adequate and stable for a long time and China has made remarkable achievements in food security which is proved to be true. However, this situation has been challenged by population growth and environmental degradation in recent years. On the one hand, the large population in China is still growing, which makes enormous demands on food supplies. On the other hand, grain production is constrained by resources and the environment, and importing foreign food excessively will squeeze domestic agricultural production. Therefore, the best way to ensure food security in China is to reduce food waste. As an important part of the consumption, households account for a large proportion of food waste production sector, which deserves our attention. What is the current situation of household food waste in China and what factors will affect household food waste in China are worth considering. From the perspective of food conversion, the food waste rate in this paper is defined as the proportion of family food consumption that is not normally converted to body mass index of family members. This paper uses data from China nutrition and health survey (CHNS) and applies stochastic frontier model to estimate household food waste rate from the perspective of food conversion and discusses the impact of heterogeneous family characteristics (such as household size, household structure, household income, storage condition, regional factors, the characteristics of the head of the household and the characteristics of the main female member) on food waste. The result shows that: the average household food waste rate is about 11.28%; such a family is likely to waste more, which has a small size, more children or the elderly, a higher per capita annual income, less-educated head of household, female with higher-education or have jobs, a bad grasp of dietary knowledge, and the family lives in Southern China. Therefore, it is of great importance to encourage the production of small packaging food and small cooking utensils, instruct household members to purchase food according to the actual needs, strengthen the efforts of the government, and raise the awareness of school children and their parents about food security so as to reduce food waste.
Key words: food waste; stochastic frontier analysis; CHNS
表1 解释的总方差Table 1 The total variance of the interpretation |
| 成分 | 初始特征值 | 提取平方和载入 | |||||
|---|---|---|---|---|---|---|---|
| 总计 | 方差/% | 累积/% | 总计 | 方差/% | 累积/% | ||
| 1 | 10.417 | 86.810 | 86.810 | 10.417 | 86.810 | 86.810 | |
表2 KMO和巴特利特检验Table 2 KMO and Bartlett's test |
| 取样足够度的 Kaiser - Meyer - OLkin度量 | 0.977 | |
|---|---|---|
| Bartlett球形度检验 | 近似卡方 | 94931.606 |
| df | 66 | |
| sig | 0 | |
表3 变量的定义及描述性统计Table 3 The definition and descriptive statistics of variables |
| 指标名称 | 变量名称 | 均值 | 标准差 | 最小值 | 最大值 |
|---|---|---|---|---|---|
| 产出项 | 家庭人均年龄加权BMI | 22.1707 | 3.4445 | 13.0658 | 30.2653 |
| 投入项 | 谷物人均消费量 | 386.5371 | 178.3492 | 0 | 1775 |
| 干豆类人均消费量 | 53.4177 | 70.7094 | 0 | 783.33 | |
| 蔬菜水果人均消费量 | 383.6159 | 212.6137 | 0 | 1766.67 | |
| 肉类人均消费量 | 78.2979 | 75.7717 | 0 | 633.33 | |
| 蛋奶类人均消费量 | 46.5518 | 66.5216 | 0 | 878.33 | |
| 水产品人均消费量 | 30.4181 | 55.2475 | 0 | 583.33 | |
| 零食饮料人均消费量 | 38.3886 | 84.7315 | 0 | 854.83 | |
| 油脂类人均消费量 | 40.1909 | 35.6147 | 0 | 772.67 | |
| 其他类人均消费量 | 28.9068 | 34.9802 | 0 | 790.83 | |
| 家庭人均身体活动强度 | 3.5151 | 1.0829 | 2 | 5 | |
| 家庭规模 | 家庭规模 | 2.6084 | 1.1295 | 1 | 10 |
| 家庭结构 | 孩子的数量 | 0.3392 | 0.6072 | 0 | 5 |
| 老年人的数量 | 0.6007 | 0.8103 | 0 | 3 | |
| 家庭收入 | 家庭人均年收入 | 14071.0900 | 13970.1800 | 0 | 87882.84 |
| 储存条件 | 冰箱拥有情况 | 0.5774 | 0.4940 | 0 | 1 |
| 地区因素 | 南北地区 | 0.5235 | 0.4995 | 0 | 1 |
| 城乡类型 | 0.3088 | 0.4620 | 0 | 1 | |
| 户主信息 | 户主的年龄 | 54.9834 | 12.0400 | 24 | 94 |
| 户主的受教育年限 | 19.3558 | 8.6318 | 0 | 36 | |
| 户主的就业情况 | 0.6294 | 0.4830 | 0 | 1 | |
| 主要女性成员 | 主要女性成员的年龄 | 53.3800 | 11.9678 | 22 | 94 |
| 主要女性成员的受教育年限 | 16.3288 | 9.7062 | 0 | 35 | |
| 主要女性成员的就业情况 | 0.5012 | 0.5001 | 0 | 1 | |
| 膳食营养知识 | 膳食知识得分因子 | -0.0027 | 0.5179 | -1.7788 | 5.0009 |
表4 平均弹性结果Table 4 Average elasticity |
| 类别 | 平均弹性 |
|---|---|
| 谷物 | 0.0170 |
| 干豆类 | 0.0022 |
| 蔬菜水果 | 0.0086 |
| 肉类 | 0.0017 |
| 蛋奶类 | 0.0023 |
| 水产品 | -0.0029 |
| 零食饮料 | -0.0013 |
| 油脂类 | 0.0104 |
| 其他类 | 0.0049 |
| 身体活动强度 | -0.0511 |
表5 平均食物浪费率Table 5 Average food waste rate (%) |
| 平均浪费率和标准差 | 结果 |
|---|---|
| 平均浪费率 | 11.28 |
| 标准差 | 10.75 |
表6 不同家庭平均浪费率水平对比Table 6 The average food waste rate of different households (%) |
| 变量名称 | 2006年 | 2009年 | ||||||||||||||||
|---|---|---|---|---|---|---|---|---|---|---|---|---|---|---|---|---|---|---|
| 平均浪 费率 | 标准差 | 最小值 | 最大值 | 平均浪 费率 | 标准差 | 最小值 | 最大值 | |||||||||||
| 家庭规模/人 | ||||||||||||||||||
| 1 | 7.90 | 4.61 | 2.28 | 32.10 | 8.34 | 5.36 | 2.27 | 37.04 | ||||||||||
| 2 | 7.46 | 6.91 | 2.03 | 57.05 | 6.95 | 4.97 | 1.87 | 52.87 | ||||||||||
| 3 | 15.35 | 12.00 | 2.37 | 60.62 | 13.72 | 11.26 | 2.11 | 60.35 | ||||||||||
| 4 | 19.45 | 15.56 | 2.11 | 61.44 | 18.14 | 14.31 | 3.09 | 58.73 | ||||||||||
| ≥5 | 22.68 | 14.67 | 2.54 | 60.80 | 19.91 | 13.36 | 2.93 | 62.78 | ||||||||||
| 孩子的数量/个 | ||||||||||||||||||
| 0 | 6.39 | 3.40 | 2.03 | 33.20 | 6.65 | 3.45 | 1.87 | 37.04 | ||||||||||
| 1 | 20.74 | 10.58 | 4.50 | 57.09 | 19.83 | 9.64 | 4.51 | 54.67 | ||||||||||
| 2 | 36.54 | 13.97 | 6.37 | 61.44 | 34.48 | 14.71 | 8.74 | 60.35 | ||||||||||
| ≥3 | 51.35 | 12.36 | 14.13 | 60.36 | 46.06 | 12.16 | 19.00 | 62.78 | ||||||||||
| 老年人的数量/个 | ||||||||||||||||||
| 0 | 12.01 | 11.97 | 2.03 | 61.44 | 10.52 | 10.12 | 1.87 | 62.78 | ||||||||||
| 1 | 11.99 | 11.00 | 2.37 | 60.62 | 12.51 | 11.51 | 2.50 | 60.35 | ||||||||||
| 2 | 10.75 | 9.62 | 2.66 | 60.80 | 9.88 | 7.99 | 2.54 | 58.09 | ||||||||||
| 3 | 8.02 | 3.89 | 3.91 | 14.96 | 7.64 | 3.58 | 5.33 | 14.80 | ||||||||||
| 家庭人均年收入/元 | ||||||||||||||||||
| ≤5000 | 14.40 | 13.98 | 2.23 | 61.44 | 13.31 | 12.94 | 2.11 | 62.78 | ||||||||||
| 5000~10000 | 12.31 | 11.16 | 2.03 | 61.09 | 12.77 | 11.73 | 1.87 | 59.23 | ||||||||||
| 10000~15000 | 10.26 | 9.35 | 2.52 | 60.47 | 10.37 | 9.19 | 2.49 | 55.96 | ||||||||||
| 15000~20000 | 9.41 | 9.11 | 2.57 | 58.42 | 8.97 | 7.96 | 2.40 | 58.73 | ||||||||||
| ≥20000 | 8.69 | 7.64 | 2.37 | 50.65 | 8.72 | 6.71 | 2.43 | 53.02 | ||||||||||
| 冰箱拥有情况 | ||||||||||||||||||
| 无 | 12.56 | 12.28% | 2.11 | 61.44 | 12.14 | 11.56 | 2.40 | 62.78 | ||||||||||
| 有 | 11.01 | 10.45% | 2.03 | 60.93 | 10.03 | 8.99 | 1.87 | 59.23 | ||||||||||
| 南北地区 | ||||||||||||||||||
| 北方 | 8.46 | 8.14 | 2.03 | 56.64 | 7.79 | 6.69 | 1.87 | 52.87 | ||||||||||
| 南方 | 14.79 | 13.01 | 2.52 | 61.44 | 13.51 | 11.65 | 2.89 | 62.78 | ||||||||||
| 城乡类型 | ||||||||||||||||||
| 农村 | 12.23 | 12.10 | 2.03 | 61.09 | 11.25 | 10.84 | 2.15 | 62.78 | ||||||||||
| 城镇 | 10.73 | 9.60 | 2.37 | 61.44 | 9.73 | 7.81 | 1.87 | 54.30 | ||||||||||
| 户主的年龄/岁 | ||||||||||||||||||
| ≤30 | 23.01 | 17.93 | 3.22 | 60.46 | 24.41 | 10.80 | 4.50 | 37.65 | ||||||||||
| 31~40 | 21.80 | 14.86 | 2.67 | 61.09 | 20.97 | 14.78 | 2.11 | 62.78 | ||||||||||
| 41~50 | 9.24 | 8.46 | 2.23 | 52.21 | 8.59 | 6.57 | 2.27 | 56.59 | ||||||||||
| 51~60 | 9.80 | 9.86 | 2.03 | 60.36 | 8.90 | 8.55 | 1.87 | 59.57 | ||||||||||
| 61~70 | 11.55 | 10.94 | 2.70 | 60.62 | 11.54 | 10.26 | 2.70 | 60.35 | ||||||||||
| ≥71 | 11.26 | 10.39 | 2.37 | 61.44 | 10.88 | 9.79 | 2.54 | 59.23 | ||||||||||
| 变量名称 | 2006年 | 2009年 | ||||||||||||||||
| 平均浪 费率 | 标准差 | 最小值 | 最大值 | 平均浪 费率 | 标准差 | 最小值 | 最大值 | |||||||||||
| 户主的受教育年限/年 | ||||||||||||||||||
| 0 | 12.73 | 11.75 | 2.28 | 59.85 | 13.16 | 12.25 | 2.69 | 60.35 | ||||||||||
| 11~16 | 11.82 | 11.47 | 2.11 | 61.44 | 11.43 | 10.85 | 2.11 | 62.78 | ||||||||||
| 21~26 | 12.03 | 11.97 | 2.03 | 61.09 | 10.27 | 9.40 | 1.87 | 58.73 | ||||||||||
| 27~29 | 9.76 | 8.20 | 2.34 | 42.48 | 8.84 | 6.43 | 2.22 | 32.16 | ||||||||||
| 31~36 | 10.50 | 9.24 | 2.53 | 53.84 | 9.30 | 8.14 | 2.89 | 52.87 | ||||||||||
| 户主的就业情况 | ||||||||||||||||||
| 无业 | 10.04 | 9.34 | 2.23 | 61.44 | 10.11 | 8.78 | 2.22 | 59.23 | ||||||||||
| 就业 | 12.75 | 12.32 | 2.03 | 61.09 | 11.19 | 10.70 | 1.87 | 62.78 | ||||||||||
| 主要女性成员的年龄/岁 | ||||||||||||||||||
| ≤30 | 25.46 | 18.43 | 3.22 | 61.44 | 25.04 | 15.63 | 4.36 | 56.57 | ||||||||||
| 31~40 | 20.33 | 14.63 | 2.36 | 61.09 | 19.82 | 14.00 | 2.11 | 62.78 | ||||||||||
| 41~50 | 8.57 | 7.96 | 2.23 | 60.80 | 8.39 | 6.73 | 2.27 | 56.90 | ||||||||||
| 51~60 | 10.00 | 10.17 | 2.03 | 60.36 | 9.28 | 8.72 | 1.87 | 59.57 | ||||||||||
| 61~70 | 10.93 | 9.48 | 2.66 | 60.62 | 10.78 | 9.76 | 2.54 | 60.35 | ||||||||||
| ≥71 | 10.81 | 9.29 | 2.37 | 59.85 | 10.91 | 9.69 | 2.50 | 59.23 | ||||||||||
| 主要女性成员受教育年限/年 | ||||||||||||||||||
| 0 | 11.97 | 11.60 | 2.03 | 60.36 | 10.81 | 9.82 | 1.87 | 60.35 | ||||||||||
| 11~16 | 11.35 | 11.51 | 2.23 | 61.09 | 10.91 | 10.57 | 2.11 | 62.78 | ||||||||||
| 21~26 | 11.99 | 11.55 | 2.36 | 61.44 | 10.73 | 10.06 | 2.27 | 58.39 | ||||||||||
| 27~29 | 10.77 | 7.66 | 3.10 | 36.98 | 9.45 | 6.48 | 3.00 | 32.16 | ||||||||||
| 31~36 | 14.13 | 12.85 | 3.20 | 53.84 | 12.25 | 10.21 | 3.26 | 52.87 | ||||||||||
| 主要女性成员的就业情况 | ||||||||||||||||||
| 无业 | 9.65 | 9.06 | 2.03 | 61.44 | 9.58 | 8.49 | 1.87 | 59.23 | ||||||||||
| 就业 | 13.84 | 12.98 | 2.37 | 61.09 | 12.00 | 11.25 | 2.49 | 62.78 | ||||||||||
| 膳食知识得分 | ||||||||||||||||||
| ≤-1 | 13.10 | 13.79 | 3.09 | 58.69 | 14.10 | 16.13 | 3.48 | 59.57 | ||||||||||
| (-1, -0.5] | 13.22 | 13.79 | 2.57 | 60.80 | 11.83 | 11.13 | 2.51 | 55.50 | ||||||||||
| (-0.5, 0] | 12.19 | 11.95 | 2.23 | 61.44 | 10.74 | 9.81 | 2.15 | 62.78 | ||||||||||
| (0, 0.5] | 11.34 | 10.80 | 2.30 | 60.47 | 10.41 | 9.44 | 2.22 | 60.35 | ||||||||||
| (0.5, 1] | 11.73 | 9.71 | 2.03 | 44.65 | 9.94 | 10.03 | 3.17 | 57.86 | ||||||||||
| >1 | 9.15 | 7.76 | 2.11 | 35.87 | 11.59 | 11.49 | 1.87 | 58.09 | ||||||||||
表7 食物浪费率影响因素Table 7 Factors that influence the rate of food waste |
| 指标名称 | 变量名称 | 影响因素 |
|---|---|---|
| 家庭规模 | 家庭规模 | -0.1364***(-2.86) |
| 家庭结构 | 孩子的数量 | 1.9420***(19.32) |
| 老年人的数量 | 0.2035***(2.96) | |
| 家庭收入 | 家庭人均年收入 | 0.0000***(4.03) |
| 储存条件 | 冰箱拥有情况 | 0.0424(0.53) |
| 地区因素 | 南北地区 | 0.7003***(8.51) |
| 城乡类型 | 0.0067(0.08) | |
| 户主信息 | 户主的年龄 | 0.0070(1.21) |
| 户主的受教育年限 | -0.0133**(-2.31) | |
| 户主的就业情况 | 0.0447(0.42) | |
| 主要女性成员 | 主要女性成员的年龄 | 0.0043(0.75) |
| 主要女性成员的受教育年限 | 0.0145***(2.65) | |
| 主要女性成员的就业情况 | 0.2610***(2.82) | |
| 膳食营养知识 | 膳食知识得分因子 | -0.3058***(-4.14) |
| 常数项 | 常数项 | -5.9028***(-16.65) |
| E() | 0.1604 | |
| 0.0971*** | ||
| 对数似然函数值 | 2695.0584 | |
| P值 | 0.0000 |
注:*、**和***分别表示在10%、5%和1%的显著性水平下显著,括号内为t值。 |
| [1] |
刘立涛, 刘晓洁, 伦飞, 等. 全球气候变化下的中国粮食安全问题研究. 自然资源学报, 2018,33(6):927-939.
[
|
| [2] |
王灵恩, 成升魁, 刘刚, 等. 中国食物浪费研究的理论与方法探析. 自然资源学报, 2015,30(5):715-724.
[
|
| [3] |
江金启, YU T E, 黄琬真, 等. 中国家庭食物浪费的规模估算及决定因素分析. 农业技术经济, 2018, (9):88-99.
[
|
| [4] |
张盼盼, 白军飞, 刘晓洁, 等. 消费端食物浪费: 影响与行动. 自然资源学报, 2019,34(2):437-450.
[
|
| [5] |
|
| [6] |
|
| [7] |
曹芳芳, 黄东, 朱俊峰, 等. 小麦收获损失及其主要影响因素: 基于1135户小麦种植户的实证分析. 中国农村观察, 2018, (2):75-87.
[
|
| [8] |
朱晶, 李天祥, 林大燕. 开放进程中的中国农产品贸易: 发展历程、问题挑战与政策选择. 农业经济问题, 2018, (12):19-32.
[
|
| [9] |
|
| [10] |
|
| [11] |
|
| [12] |
|
| [13] |
|
| [14] |
|
| [15] |
|
| [16] |
|
| [17] |
丁珊. 家庭食物浪费及其生态足迹、碳足迹、水足迹和甲烷释放的研究. 大连: 大连理工大学, 2015.
[
|
| [18] |
李明净. 中国家庭食物消费的碳—水—生态足迹及气候变化减缓策略优化研究. 大连: 大连理工大学, 2016.
[
|
| [19] |
李丰, 蒋文斌, 朱瑶瑶, 等. 中国农村食物浪费与成因分析: 基于全国25个省(市)的记账式调查. 粮食科技与经济, 2017,42(4):24-28.
[
|
| [20] |
|
| [21] |
高利伟, 成升魁, 曹晓昌, 等. 食物损失和浪费研究综述及展望. 自然资源学报, 2015,30(3):523-536.
[
|
| [22] |
张丹, 伦飞, 成升魁, 等. 城市餐饮食物浪费的磷足迹及其环境排放: 以北京市为例. 自然资源学报, 2016,31(5):812-821.
[
|
| [23] |
|
| [24] |
|
| [25] |
|
| [26] |
|
| [27] |
侯鹏, 王灵恩, 刘晓洁, 等. 国内外食育研究的理论与实践. 资源科学, 2018,40(12):2369-2381.
[
|
| [28] |
|
| [29] |
|
| [30] |
|
| [31] |
倪国华, 郑风田, 喻志军, 等. 生活方式变化对我国成人肥胖的影响研究: 基于CHNS数据的实证分析. 中国食物与营养, 2014,20(3):77-81.
[
|
| [32] |
|
| [33] |
邓婷鹤. 人口老龄化进程中的食物消费变化研究. 北京: 中国农业大学, 2017.
[
|
| [34] |
贺谦. 中国城乡居民膳食营养状况和健康不平等性分析. 武汉: 华中科技大学, 2016.
[
|
| [35] |
任娟. 多指标面板数据融合聚类分析. 数理统计与管理, 2013,32(1):57-67.
[
|
| [36] |
张海英. 浅谈肥胖的研究进展. 中国伤残医学, 2010,18(1):156-158.
[
|
| [37] |
|
/
| 〈 |
|
〉 |