
基于土地利用的中国城镇化SD模型与模拟
|
曹祺文(1992- ),男,河南洛阳人,博士,工程师,研究方向为国土空间规划、景观生态与土地科学。E-mail: cqw17@mails.tsinghua.edu.cn |
收稿日期: 2020-02-25
要求修回日期: 2020-07-01
网络出版日期: 2021-06-28
基金资助
国家自然科学基金重大项目(41590844)
版权
China's urbanization SD modelling and simulation based on land use
Received date: 2020-02-25
Request revised date: 2020-07-01
Online published: 2021-06-28
Copyright
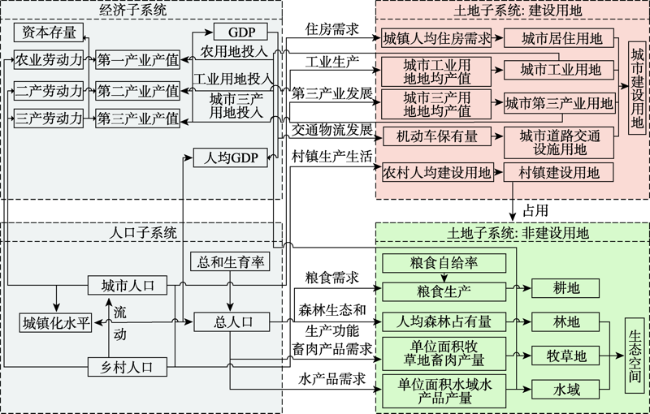
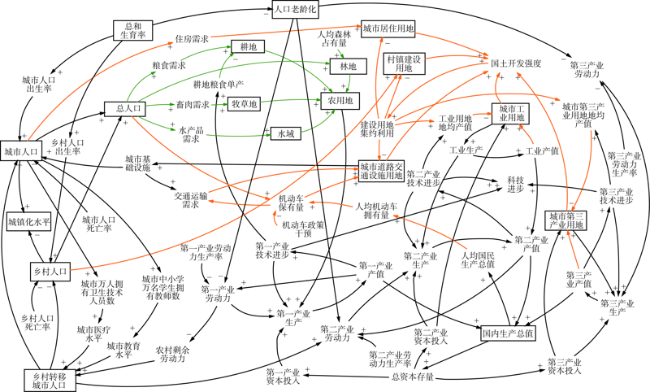
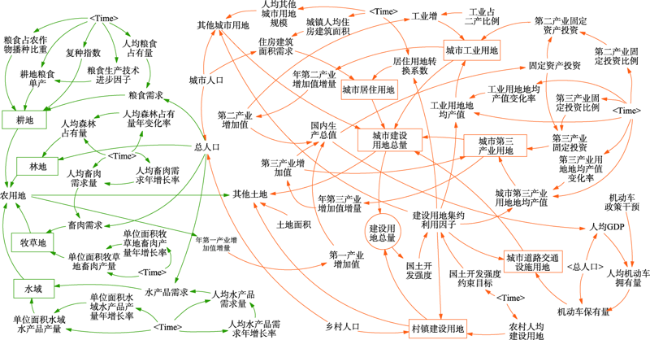
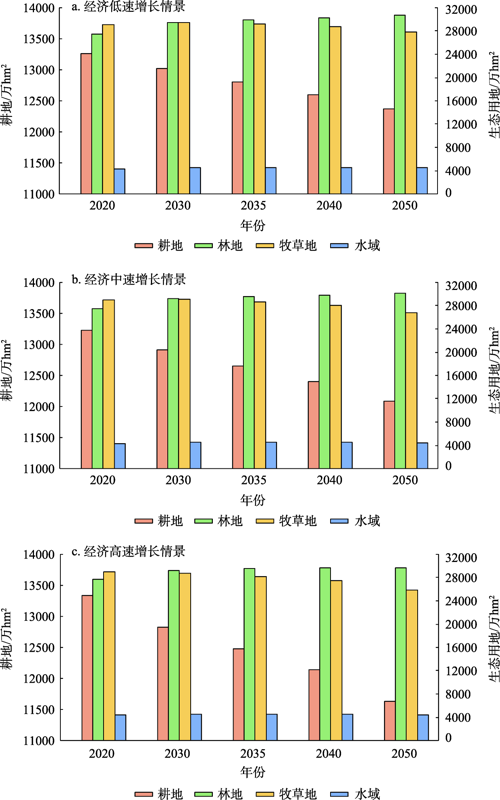
中国正处在快速推进的城镇化进程中,耕地与林地、牧草地和水域等生态用地将如何变化,以及建设用地是否仍将快速增长?这不仅是国家宏观政策制定者关心的问题,也是广大学者和普通民众面临的具体问题。通过构建基于土地利用的中国城镇化系统动力学(System dynamics,SD)模型,尝试对上述问题作出分析。研究结果表明:(1)本文构建的模型是有效的,具备可靠性和稳定性。(2)若要保持国家耕地保有量不少于18.25亿亩,到2050年需补充83.17万~412.67万hm2耕地资源。(3)到2050年,如果中国城镇化水平达到78%左右,建设用地总量将达到4007.29万~4214.25万hm2,较2020年净增加了155.87万~342.88万hm2。(4)2020—2050年生态用地数量表现为先增加后减少,其中,林地显著增加,牧草地减少,水域略有增加。研究成果可为全国国土空间规划多方案模拟、评估和决策提供科学服务。
曹祺文 , 顾朝林 , 管卫华 . 基于土地利用的中国城镇化SD模型与模拟[J]. 自然资源学报, 2021 , 36(4) : 1062 -1084 . DOI: 10.31497/zrzyxb.20210419
China is still experiencing the process of rapid urbanization. How will cultivated land and ecological land, such as woodland, grassland, and water body change? Will construction land continue to grow rapidly? These are not only the concerns of national macro-policy makers, but also the specific problems faced by scholars and ordinary people. This paper attempts to make a multi-scenario analysis of the above issues by constructing a system dynamics (SD) model of China's urbanization based on land use. This SD model integrates the relationship between land use and multi-factors in the urbanization process, including economy and population, and highlights the dominant role of land resources in the urbanization process. The conclusions can be drawn as follows: First, according to the results of stock-flow validation and sensitivity analysis, the China's urbanization SD model based on land use is effective with great reliability and stability. Therefore, the model can be used to predict and simulate the future trend of urbanization process and land resource use in China. Second, in order to meet the requirement of the "National Land Planning Outline (2016-2030)" that the amount of cultivated land should be maintained at 12166.67×104 hm2, there will be a need to supplement 83.17×10⁴-412.67×10⁴ hm2 of cultivated land from other types of land by 2050. This is because the cultivated land will show a decreasing trend in the China's urbanization in the future. In the low scenario, medium and high-speed economic growth, the amount of cultivated land by 2050 will be reduced to 12366.60×104, 12083.50×104, and 11754.00×104 hm2, respectively. Third, with the improvement of urbanization levels, the total amount of construction land will increase accordingly. Specifically, if China's urbanization level reaches 78% by 2050, the total construction land will increase to 4283.89×104-4464.90×104 hm2, with a net increase of 155.87×10⁴-342.88×10⁴ hm2 compared with 2020. Fourth, the overall trend of ecological land in 2020-2050 is to increase first and then decrease. By 2050, the woodland will significantly increase to 29406.60×104-30733.80×104 hm2, the grassland will decrease to 25784.50×104-27809.90×104 hm2, and the water body will not decrease and even increase slightly, the area of which would be 4283.89×104-4464.90×104 hm2. The research results can provide scientific supports for the multi-scenario simulation, evaluation, and decision-making of territorial spatial planning.
表1 主要方程Table 1 Main equations |
| 子系统 | 方程 | 说明 | ||
|---|---|---|---|---|
| 土地 | (1) | RLCC为城市居住用地转换系数,相当于综合容积率;αi,βi(i=0, 1, 2, 3)为待估参数;CTTDI为国土开发强度约束目标 | ||
| (2) | ||||
| (3) | ||||
| (4) | ||||
| (5) | ||||
| (6) | ||||
| (7) | ||||
| (8) | ||||
| (9) | ||||
| (10) | ||||
| (11) | ||||
| 经济 | (12) | AGPI、AGSI、AGTI为年第一、二、三产业增长值(亿元);GRPIO、GRSIO、GRTIO为第一、二、三产业产值增长率;PIO、SIO、TIO为第一、二、三产业产值(亿元);MVPIO、MVSIO、MVTIO为第一、二、三产业产值最大值(亿元);Ti(i=1, 2, 3)表征综合技术水平;PICS、SICS、TICS为第一、二、三产业资本存量(亿元);PLF、SLF、TLF为第一、二、三产业劳动力(万人);Ki、Ni、Li(i=1, 2, 3)是弹性系数 | ||
| (13) | ||||
| (14) | ||||
| 人口 | (15) | UP0~14/RP0~14、UP15~64/RP15~64、UP≥65/RP≥65分别为城市/乡村0~14岁、15~64岁和65岁及以上人口 | ||
| (16) | ||||
表2 土地利用数据分类及来源Table 2 Classification and source of land use data |
| 大类 | 小类 | 来源与说明 |
|---|---|---|
| 建设用地 | 城市居住用地 | 《中国城市建设统计年鉴》(1998—2017年) |
| 城市工业用地 | 《中国城市建设统计年鉴》(1998—2017年) | |
| 城市第三产业用地 | 《中国城市建设统计年鉴》(1998—2017年),包括商业服务业设施用地和物流仓储用地 | |
| 城市道路交通设施用地 | 《中国城市建设统计年鉴》(1998—2017年) | |
| 其他城市用地 | 《中国城市建设统计年鉴》(1998—2017年),城市建设用地中除上述类型以外的用地 | |
| 村镇建设用地 | 全国土地变更调查(1998—2017年),包括村庄、建制镇、采矿用地和农村道路 | |
| 非建设用地 | 耕地 | 全国土地变更调查(1998—2017年) |
| 林地 | 全国土地变更调查(1998—2017年),包括林地和园地 | |
| 牧草地 | 全国土地变更调查(1998—2017年) | |
| 水域 | 全国土地变更调查(1998—2017年) | |
| 其他土地 | 全国土地变更调查(1998—2017年) |
表3 1998—2017年模型历史数据模拟误差Table 3 Error rate of the simulation value and historical data in 1998-2017 (%) |
| 主要变量 | 模拟值与实际值平均误差率 |
|---|---|
| 城市工业用地 | -0.68 |
| 耕地 | -0.39 |
| 城市居住用地 | -0.32 |
| 国内生产总值 | -0.27 |
| 城镇化水平 | -0.25 |
| 牧草地 | -0.06 |
| 林地 | 0.06 |
| 水域 | 0.13 |
| 总人口 | 0.25 |
| 城市道路交通设施用地 | 0.37 |
| 村镇建设用地 | 0.81 |
| 城市第三产业用地 | 0.98 |
表4 模型对参数变化的灵敏度分析Table 4 Sensitivity analysis of the model to parameter changes (%) |
| 参数 | 增10%灵敏度 | 减10%灵敏度 |
|---|---|---|
| 人均森林占有量年变化率 | 0.40 | 0.41 |
| 第三产业劳动生产率增长率 | 0.89 | 0.81 |
| 人均畜肉需求年增长率 | 1.08 | 1.05 |
| 工业用地地均产值变化率 | 1.45 | 1.45 |
| 第二产业劳动生产率增长率 | 2.11 | 2.11 |
| 医疗因子 | 2.29 | 2.43 |
| 机动车政策干预 | 2.35 | 2.54 |
| 人均水产品需求年增长率 | 2.60 | 2.41 |
| 第一产业产值增长率 | 4.22 | 4.24 |
| 总和生育率 | 5.66 | 5.75 |
| 人均住房建筑面积 | 5.82 | 5.81 |
| 粮食自给率 | 5.88 | 5.88 |
| 第一产业劳动生产率增长率 | 6.25 | 6.21 |
| 农村人均建设用地 | 7.17 | 5.56 |
| 第三产业用地地均产值变化率 | 7.17 | 7.15 |
| 资本积累率 | 9.51 | 9.64 |
| 教育因子 | 12.50 | 15.80 |
| 第三产业产值增长率 | 18.47 | 17.90 |
| 第二产业产值增长率 | 18.90 | 19.18 |
表5 情景设定Table 5 Settings of scenarios |
| 调控变量 | 经济低速增长 | 经济中速增长 | 经济高速增长 |
|---|---|---|---|
| GDP年增长率/% | 由6.8降至3 | 由6.8降至4.5 | 由6.8降至6 |
| 总和生育率 | 1.4 | 1.6 | 1.8 |
| 城镇化水平/% | 2050年达77.5左右 | 2050年达78左右 | 2050年达78.5左右 |
| 耕地保有量目标/104 hm2 | ≥ 12166.67 | ≥ 12166.67 | ≥ 12166.67 |
| 粮食自给率/% | 100 | 95 | 90 |
| 人均森林占有量年变化率/% | 0.45 | 0.30 | 0.15 |
| 单位面积水域水产品产量年增长率/% | 3.00 | 3.20 | 3.40 |
| 单位面积牧草地畜肉产量年增长率/% | 1.20 | 1.40 | 1.60 |
| 城镇人均住房建筑面积/m2 | 2050年增长至50 | 2050年增长至60 | 2050年增长至67 |
| 城市工业用地地均产值年变化率/% | 1.00 | 1.10 | 1.20 |
| 城市第三产业用地地均产值年变化率/% | 3.10 | 3.30 | 3.50 |
表6 城镇化社会经济要素模拟结果Table 6 Simulation results of socio-economic factors of urbanization |
| 年份 | 国内生产总值/亿元(1990年价格) | 总人口/万人 | 城镇化水平/% | |||||||||
|---|---|---|---|---|---|---|---|---|---|---|---|---|
| 经济低 速增长 | 经济中 速增长 | 经济高 速增长 | 经济低 速增长 | 经济中 速增长 | 经济高 速增长 | 经济低 速增长 | 经济中 速增长 | 经济高 速增长 | ||||
| 2017 | 实际值 | 226782 | 226782 | 226782 | 139008 | 139008 | 139008 | 58.52 | 58.52 | 58.52 | ||
| 2020 | 预测量 | 270974 | 271141 | 271309 | 141298 | 141701 | 142102 | 61.51 | 61.56 | 61.61 | ||
| 净增量 | 44192 | 44359 | 44527 | 2290 | 2693 | 3094 | 2.99 | 3.04 | 3.09 | |||
| 净增率/% | 19.49 | 19.56 | 19.63 | 1.65 | 1.94 | 2.23 | 5.11 | 5.19 | 5.28 | |||
| 2030 | 预测量 | 430889 | 440301 | 449678 | 144359 | 146040 | 147702 | 69.45 | 69.63 | 69.81 | ||
| 净增量 | 159915 | 169160 | 178369 | 3061 | 4339 | 5600 | 7.9381 | 8.0714 | 8.2005 | |||
| 净增率/% | 59.01 | 62.39 | 65.74 | 2.17 | 3.06 | 3.94 | 12.91 | 13.11 | 13.31 | |||
| 2035 | 预测量 | 510459 | 530916 | 551341 | 143525 | 145805 | 148048 | 72.20 | 72.43 | 72.66 | ||
| 净增量 | 79570 | 90615 | 101663 | -834 | -235 | 346 | 2.7501 | 2.8043 | 2.8547 | |||
| 净增率/% | 18.47 | 20.58 | 22.61 | -0.58 | -0.16 | 0.23 | 3.96 | 4.03 | 4.09 | |||
| 2040 | 预测量 | 584458 | 620770 | 657103 | 141929 | 144785 | 147576 | 74.36 | 74.65 | 74.92 | ||
| 净增量 | 73999 | 89854 | 105762 | -1596 | -1020 | -472 | 2.1609 | 2.2138 | 2.2617 | |||
| 净增率/% | 14.50 | 16.92 | 19.18 | -1.11 | -0.70 | -0.32 | 2.99 | 3.06 | 3.11 | |||
| 2050 | 预测量 | 705693 | 787816 | 870148 | 137965 | 141902 | 145702 | 77.53 | 77.93 | 78.31 | ||
| 净增量 | 121235 | 167046 | 213045 | -3964 | -2883 | -1874 | 3.1675 | 3.2827 | 3.3848 | |||
| 净增率/% | 20.74 | 26.91 | 32.42 | -2.79 | -1.99 | -1.27 | 4.26 | 4.40 | 4.52 | |||
表7 非建设用地模拟结果Table 7 Simulation results of non-construction land |
| 年份 | 耕地/万hm2 | 林地/万hm2 | ||||||
|---|---|---|---|---|---|---|---|---|
| 经济低速增长 | 经济中速增长 | 经济高速增长 | 经济低速增长 | 经济中速增长 | 经济高速增长 | |||
| 2017 | 实际值 | 13488.22 | 13488.22 | 13488.22 | 26701.66 | 26701.66 | 26701.66 | |
| 2020 | 预测量 | 13254.20 | 13231.60 | 13208.50 | 27509.60 | 27464.60 | 27419.00 | |
| 净增量 | -234.02 | -256.62 | -279.72 | 807.94 | 762.94 | 717.34 | ||
| 净增率/% | -1.73 | -1.90 | -2.07 | 3.03 | 2.86 | 2.69 | ||
| 2030 | 预测量 | 13017.90 | 12910.10 | 12794.70 | 29396.20 | 29166.30 | 28929.90 | |
| 净增量 | -236.30 | -321.50 | -413.80 | 1886.60 | 1701.70 | 1510.90 | ||
| 净增率/% | -1.78 | -2.43 | -3.13 | 6.86 | 6.20 | 5.51 | ||
| 2035 | 预测量 | 12800.50 | 12649.20 | 12483.70 | 29889.90 | 29558.90 | 29215.90 | |
| 净增量 | -217.40 | -260.90 | -311.00 | 493.70 | 392.60 | 286.00 | ||
| 净增率/% | -1.67 | -2.02 | -2.43 | 1.68 | 1.35 | 0.99 | ||
| 2040 | 预测量 | 12596.80 | 12402.50 | 12185.10 | 30228.70 | 29795.00 | 29341.80 | |
| 净增量 | -203.70 | -246.70 | -298.60 | 338.80 | 236.10 | 125.90 | ||
| 净增率/% | -1.59 | -1.95 | -2.39 | 1.13 | 0.80 | 0.43 | ||
| 2050 | 预测量 | 12366.60 | 12083.50 | 11754.00 | 30733.80 | 30089.70 | 29406.60 | |
| 净增量 | -230.20 | -319.00 | -431.10 | 505.10 | 294.70 | 64.80 | ||
| 净增率/% | -1.83 | -2.57 | -3.54 | 1.67 | 0.99 | 0.22 | ||
| 年份 | 牧草地/万hm2 | 水域/万hm2 | ||||||
| 经济低速增长 | 经济中速增长 | 经济高速增长 | 经济低速增长 | 经济中速增长 | 经济高速增长 | |||
| 2017 | 实际值 | 28614.66 | 28614.66 | 28614.66 | 4219.72 | 4219.72 | 4219.72 | |
| 2020 | 预测量 | 29030.10 | 28940.80 | 28851.80 | 4314.25 | 4313.95 | 4301.12 | |
| 净增量 | 415.44 | 326.14 | 237.14 | 94.53 | 94.23 | 81.40 | ||
| 净增率/% | 1.45 | 1.14 | 0.83 | 2.24 | 2.23 | 1.93 | ||
| 2030 | 预测量 | 29471.50 | 29059.10 | 28646.60 | 4494.04 | 4489.31 | 4427.56 | |
| 净增量 | 441.40 | 118.30 | -205.20 | 179.79 | 175.36 | 126.44 | ||
| 净增率/% | 1.52 | 0.41 | -0.71 | 4.17 | 4.06 | 2.94 | ||
| 2035 | 预测量 | 29208.30 | 28636.40 | 28063.70 | 4511.62 | 4503.88 | 4416.52 | |
| 净增量 | -263.20 | -422.70 | -582.90 | 17.58 | 14.57 | -11.04 | ||
| 净增率/% | -0.89 | -1.45 | -2.03 | 0.39 | 0.32 | -0.25 | ||
| 2040 | 预测量 | 28791.90 | 28067.20 | 27340.80 | 4504.95 | 4494.07 | 4381.19 | |
| 净增量 | -416.40 | -569.20 | -722.90 | -6.67 | -9.81 | -35.33 | ||
| 净增率/% | -1.43 | -1.99 | -2.58 | -0.15 | -0.22 | -0.80 | ||
| 2050 | 预测量 | 27809.90 | 26799.20 | 25784.50 | 4464.90 | 4447.44 | 4283.89 | |
| 净增量 | -982.00 | -1268.00 | -1556.30 | -40.05 | -46.63 | -7.30 | ||
| 净增率/% | -3.41 | -4.52 | -5.69 | -0.89 | -1.04 | -2.22 | ||
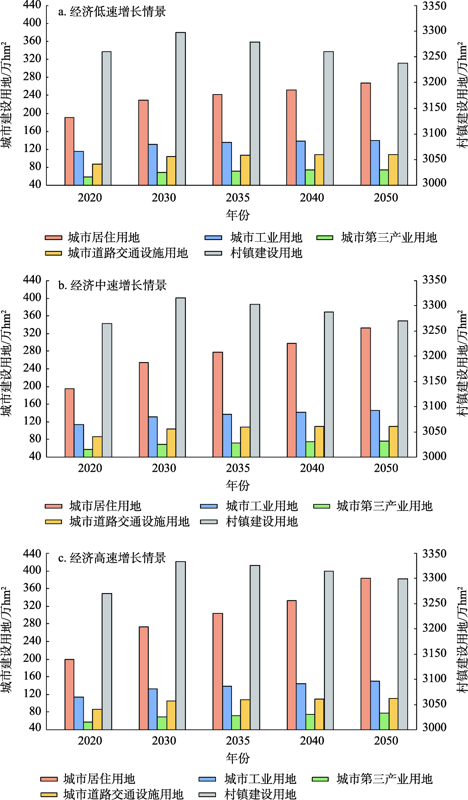
表8 建设用地模拟结果Table 8 Simulation results of construction land |
| 年份 | 城市居住用地/万hm2 | 城市工业用地/万hm2 | ||||||
|---|---|---|---|---|---|---|---|---|
| 经济低速增长 | 经济中速增长 | 经济高速增长 | 经济低速增长 | 经济中速增长 | 经济高速增长 | |||
| 2017 | 实际值 | 169.79 | 169.79 | 169.79 | 110.84 | 110.84 | 110.84 | |
| 2020 | 预测量 | 190.34 | 195.59 | 199.51 | 114.66 | 114.59 | 114.53 | |
| 净增量 | 20.54 | 25.80 | 29.71 | 3.82 | 3.75 | 3.69 | ||
| 净增率/% | 12.10 | 15.19 | 17.50 | 3.45 | 3.39 | 3.33 | ||
| 2030 | 预测量 | 228.89 | 253.91 | 272.89 | 131.12 | 131.97 | 132.79 | |
| 净增量 | 38.55 | 58.32 | 73.38 | 16.46 | 17.38 | 18.26 | ||
| 净增率/% | 20.25 | 29.82 | 36.78 | 14.36 | 15.16 | 15.94 | ||
| 2035 | 预测量 | 242.01 | 277.21 | 304.14 | 135.69 | 137.46 | 139.14 | |
| 净增量 | 13.12 | 23.30 | 31.25 | 4.57 | 5.49 | 6.35 | ||
| 净增率/% | 5.73 | 9.18 | 11.45 | 3.48 | 4.16 | 4.78 | ||
| 2040 | 预测量 | 252.25 | 297.44 | 332.31 | 138.36 | 141.29 | 144.01 | |
| 净增量 | 10.24 | 20.23 | 28.17 | 2.68 | 3.83 | 4.88 | ||
| 净增率/% | 4.23 | 7.30 | 9.26 | 1.97 | 2.79 | 3.51 | ||
| 2050 | 预测量 | 267.74 | 332.18 | 382.72 | 139.20 | 145.08 | 150.29 | |
| 净增量 | 15.49 | 34.74 | 50.41 | 0.84 | 3.79 | 6.28 | ||
| 净增率/% | 6.14 | 11.68 | 15.17 | 0.61 | 2.68 | 4.36 | ||
| 年份 | 城市第三产业用地/万hm2 | 城市道路交通设施用地/万hm2 | ||||||
| 经济低速增长 | 经济中速增长 | 经济高速增长 | 经济低速增长 | 经济中速增长 | 经济高速增长 | |||
| 2017 | 实际值 | 55.08 | 55.08 | 55.08 | 83.65 | 83.65 | 83.65 | |
| 2020 | 预测量 | 57.64 | 57.51 | 57.38 | 86.76 | 86.76 | 86.75 | |
| 净增量 | 2.56 | 2.43 | 2.30 | 3.12 | 3.11 | 3.11 | ||
| 净增率/% | 4.64 | 4.41 | 4.18 | 3.72 | 3.72 | 3.71 | ||
| 2030 | 预测量 | 68.31 | 68.42 | 68.50 | 103.19 | 103.86 | 104.51 | |
| 净增量 | 10.67 | 10.91 | 11.12 | 16.43 | 17.10 | 17.76 | ||
| 净增率/% | 18.52 | 18.97 | 19.39 | 18.93 | 19.71 | 20.47 | ||
| 2035 | 预测量 | 71.36 | 71.83 | 72.25 | 106.47 | 107.43 | 108.33 | |
| 净增量 | 3.05 | 3.42 | 3.75 | 3.28 | 3.57 | 3.82 | ||
| 净增率/% | 4.47 | 5.00 | 5.47 | 3.18 | 3.44 | 3.65 | ||
| 2040 | 预测量 | 73.16 | 74.11 | 74.94 | 107.93 | 109.07 | 110.10 | |
| 净增量 | 1.80 | 2.27 | 2.69 | 1.46 | 1.64 | 1.78 | ||
| 净增率/% | 2.52 | 3.16 | 3.72 | 1.37 | 1.53 | 1.64 | ||
| 2050 | 预测量 | 73.73 | 75.88 | 77.67 | 108.35 | 109.71 | 110.90 | |
| 净增量 | 0.56 | 1.77 | 2.74 | 0.42 | 0.64 | 0.79 | ||
| 净增率/% | 0.77 | 2.39 | 3.65 | 0.39 | 0.59 | 0.72 | ||
| 年份 | 村镇建设用地/万hm2 | 建设用地总量/万hm2 | ||||||
| 经济低速增长 | 经济中速增长 | 经济高速增长 | 经济低速增长 | 经济中速增长 | 经济高速增长 | |||
| 2017 | 实际值 | 3205.77 | 3205.77 | 3205.77 | 3757.33 | 3757.33 | 3757.33 | |
| 2020 | 预测量 | 3260.24 | 3265.32 | 3270.38 | 3851.42 | 3862.07 | 3871.37 | |
| 净增量 | 54.47 | 59.55 | 64.61 | 94.09 | 104.74 | 114.04 | ||
| 净增率/% | 1.70 | 1.86 | 2.02 | 2.50 | 2.79 | 3.04 | ||
| 2030 | 预测量 | 3297.48 | 3315.91 | 3333.97 | 3994.63 | 4042.08 | 4083.02 | |
| 净增量 | 37.24 | 50.59 | 63.59 | 143.21 | 180.01 | 211.65 | ||
| 净增率/% | 1.14 | 1.55 | 1.94 | 3.72 | 4.66 | 5.47 | ||
| 2035 | 预测量 | 3278.98 | 3302.69 | 3325.67 | 4006.80 | 4072.22 | 4128.40 | |
| 净增量 | -18.50 | -13.22 | -8.30 | 12.17 | 30.14 | 45.38 | ||
| 净增率/% | -0.56 | -0.40 | -0.25 | 0.30 | 0.75 | 1.11 | ||
| 2040 | 预测量 | 3260.14 | 3288.15 | 3314.96 | 4008.43 | 4090.88 | 4161.33 | |
| 净增量 | -18.84 | -14.54 | -10.71 | 1.63 | 18.66 | 32.93 | ||
| 净增率/% | -0.57 | -0.44 | -0.32 | 0.04 | 0.46 | 0.80 | ||
| 2050 | 预测量 | 3237.08 | 3269.43 | 3299.37 | 4007.29 | 4119.62 | 4214.25 | |
| 净增量 | -23.06 | -18.72 | -15.59 | -1.14 | 28.74 | 52.92 | ||
| 净增率/% | -0.71 | -0.57 | -0.47 | -0.03 | 0.70 | 1.27 | ||
| [1] |
唐华俊, 吴文斌, 杨鹏, 等. 土地利用/土地覆被变化(LUCC)模型研究进展. 地理学报, 2009,64(4):456-468.
[
|
| [2] |
|
| [3] |
王其藩. 系统动力学. 上海: 上海财经大学出版社, 2009.
[ WANG Q F. System Dynamic. Shanghai: Shanghai University of Finance and Economics Press, 2009.]
|
| [4] |
刘耀彬, 陈斐, 李仁东. 区域城市化与生态环境耦合发展模拟及调控策略: 以江苏省为例. 地理研究, 2007,26(1):187-196.
[
|
| [5] |
|
| [6] |
|
| [7] |
|
| [8] |
许月卿, 李艳华, 赵菲菲. 水资源约束下土地利用变化情景模拟研究: 以河北省张北县为例. 中国农业大学学报, 2015,20(4):214-223.
[
|
| [9] |
胡宗楠, 李鑫, 楼淑瑜, 等. 基于系统动力学模型的扬州市土地利用结构多情景模拟与实现. 水土保持通报, 2017,37(4):211-218.
[
|
| [10] |
李月臣, 何春阳. 中国北方土地利用/覆盖变化的情景模拟与预测. 科学通报, 2008,53(6):713-723.
[
|
| [11] |
祝秀芝, 李宪文, 贾克敬, 等. 上海市土地综合承载力的系统动力学研究. 中国土地科学, 2014,28(2):90-96.
[
|
| [12] |
|
| [13] |
|
| [14] |
王双, 何春阳, 潘耀忠, 等. 水资源约束下北京地区2004—2020年土地利用变化情景模拟研究. 自然资源学报, 2006,21(4):535-544.
[
|
| [15] |
|
| [16] |
魏后凯. 现代区域经济学. 北京: 经济管理出版社, 2006.
[ WEI H K. Modern Regional Economics. Modern Regional Economics, Beijing: Economy & Management Publishing House, 2006.]
|
| [17] |
|
| [18] |
苏伟忠, 杨桂山, 陈爽, 等. 城市增长边界分析方法研究: 以长江三角洲常州市为例. 自然资源学报, 2012,27(2):322-331.
[
|
| [19] |
田贺, 梁迅, 黎夏, 等. 基于SD模型的中国2010—2050年土地利用变化情景模拟. 热带地理, 2017,37(4):547-561.
[
|
| [20] |
熊鹰, 陈云, 李静芝, 等. 基于土地集约利用的长株潭城市群建设用地供需仿真模拟. 地理学报, 2018,73(3):1-16.
[
|
| [21] |
|
| [22] |
|
| [23] |
许联芳, 张建新, 陈坤, 等. 基于SD模型的湖南省土地利用变化情景模拟. 热带地理, 2014,34(6):859-867.
[
|
| [24] |
|
| [25] |
黄庆旭, 史培军, 何春阳, 等. 中国北方未来干旱化情景下的土地利用变化模拟. 地理学报, 2006,61(12):1299-1310.
[
|
| [26] |
|
| [27] |
梁友嘉, 徐中民, 钟方雷. 基于SD和CLUE-S模型的张掖市甘州区土地利用情景分析. 地理研究, 2011,30(3):564-576.
[
|
| [28] |
顾朝林, 管卫华, 刘合林. 中国城镇化2050: SD模型与过程模拟. 中国科学: 地球科学, 2017,47(7):818-832.
[
|
| [29] |
|
| [30] |
|
| [31] |
|
| [32] |
邓郁松, 邵挺. 2020—2050: 中国城镇住房市场发展趋势与目标. 重庆理工大学学报: 社会科学, 2018,32(8):1-6.
[
|
| [33] |
|
| [34] |
李稻葵, 袁钢明, 厉克奥博, 等. 十九大后的中国经济2018、2035、2050. 北京: 清华大学中国与世界经济研究中心, 2017.
[
|
| [35] |
李瑞敏, 何群, 李帅. 中国机动车保有量发展趋势分析. 城市交通, 2013,11(5):69-75.
[
|
| [36] |
孔祥斌. 粮食安全: 不能忽视耕地的作用: 对茅于轼先生的“18亿亩红线与粮食安全无关”的回应. 中国土地, 2011, (6):57-60.
[
|
| [37] |
|
| [38] |
燕守广, 李辉, 李海东, 等. 基于土地利用与景观格局的生态保护红线生态系统健康评价方法: 以南京市为例. 自然资源学报, 2020,35(5):1109-1118.
[
|
| [39] |
周琳, 程广燕. 中国粮食总量需求2030年将达峰值: 以南京市为例. 中国经济时报, 2016-12-01(005).
[
|
| [40] |
|
| [41] |
曹祺文, 鲍超, 顾朝林, 等. 基于水资源约束的中国城镇化SD模型与模拟. 地理研究, 2019,38(1):167-180.
[
|
| [42] |
|
| [43] |
|
| [44] |
陆旸, 蔡昉. 从人口红利到改革红利: 基于中国潜在增长率的模拟. 世界经济, 2016,39(1):3-23.
[
|
| [45] |
|
| [46] |
盛来运, 郑鑫. 实现第二个“一百年”目标需要多高增速?. 管理世界, 2017, (10):1-7.
[
|
| [47] |
|
| [48] |
翟振武. 科学研判人口形势积极应对人口挑战. 人口与社会, 2019,35(1):13-17.
[
|
| [49] |
|
| [50] |
World Bank. Population estimates and projections. https://databank.worldbank.org/source/population-estimates-and-projections, 2019-01-05.
|
| [51] |
辛翔飞, 王济民. 我国粮食自给水平目标设定: 研究综述与政策启示. 自然资源学报, 2019,34(11):2257-2269.
[
|
| [52] |
唐华俊. 新形势下中国粮食自给战略. 农业经济问题, 2014,35(2):4-10.
[
|
| [53] |
陈百明, 周小萍. 中国粮食自给率与耕地资源安全底线的探讨. 经济地理, 2005,25(2):145-148.
[
|
| [54] |
唐华俊, 李哲敏. 基于中国居民平衡膳食模式的人均粮食需求量研究. 中国农业科学, 2012,45(11):2315-2327.
[
|
| [55] |
黄季焜. 四十年中国农业发展改革和未来政策选择. 农业技术经济, 2018, (3):4-15.
[
|
| [56] |
国家统计局 建筑业持续快速发展城乡面貌显著改善: 新中国成立70周年经济社会发展成就系列报告之十, http://www.gov.cn/xinwen/2019-07/31/content_5417485.htm, 2019-07-31.
[ National bureau of statistics. The construction industry continues to develop rapidly and the appearance of urban and rural areas has improved significantly: The tenth report on the achievements of economic and social development of the 70th anniversary of the founding of new China. http://www.gov.cn/xinwen/2019-07/31/content_5417485.htm, 2019-07-31.]
|
| [57] |
任泽平, 熊柴, 白学松. 中国住房存量报告: 2019, https://mp.weixin.qq.com/s/8eF_ysYdiqXpMAIuC2rIqw 2019-08-16.
[
|
| [58] |
|
| [59] |
|
| [60] |
张克锋, 彭晋福, 张定祥, 等. 基于城镇化水平和GDP情景下中国未来30年土地利用变化模拟. 中国土地科学, 2007,21(2):58-64.
[
|
/
| 〈 |
|
〉 |
