
基于FY3C地表温度重建的多云地区旱情监测评估
|
张德军(1995- ),男,四川广元人,硕士,主要从事卫星遥感应用研究。E-mail: 18328424805@163.com |
收稿日期: 2019-09-12
要求修回日期: 2020-01-07
网络出版日期: 2021-06-28
基金资助
国家自然科学基金项目(41631180)
重庆市气象部门业务技术攻关项目(YWJSGG-202001)
重庆市科技厅项目(cstc2019jcyj-msxmX0649)
四川省科技计划项目(19ZDYF0158)
版权
Assessing drought conditions over cloudy regions based on reconstructed FY3C/VIRR LST
Received date: 2019-09-12
Request revised date: 2020-01-07
Online published: 2021-06-28
Copyright
受热红外传感器无法探测云下地表信息的影响,热红外遥感数据失去了对多云地区旱情监测的能力。采用RSDAST(Remotely Sensed Daily Land Surface Temperature Reconstruction)模型实现了FY3C/VIRR(Visible and Infrared Radiometer)云像元LST值的重建,结合重建后LST和NDVI数据采用TVDI指数对2018年重庆市干旱进行监测分析,并通过对比土壤墒情数据与OTVDI(Original TVDI)和RTVDI(Reconstructed TVDI)间的相关性来评估RTVDI在多云条件下旱情监测的能力。评估结果表明:基于RSDAST模型扩大了多云地区遥感干旱监测的空间范围和时间连续性,提升了区域旱情监测的精度(长时间序列和空间分布上RTVDI与土壤墒情数据间的R值均高于OTVDI),极大地提高热红外遥感数据在多云条件下的可用性和可靠性。
张德军 , 杨世琦 , 王永前 , 孙亮 , 高阳华 , 祝好 , 叶勤玉 . 基于FY3C地表温度重建的多云地区旱情监测评估[J]. 自然资源学报, 2021 , 36(4) : 1047 -1061 . DOI: 10.31497/zrzyxb.20210418
The surface information in cloud-covered regions cannot be captured by thermal infrared sensors. Therefore, thermal infrared remote sensing product data have lost their ability to monitor drought in cloudy regions. In this paper, remotely sensed daily land surface temperature reconstruction (RSDAST) model is used to reconstruct LST value of cloud pixels in FY3C/VIRR LST product data, and the reconstructed LST and NDVI data are used to monitor drought in Chongqing in 2018 by TVDI index. And the correlation between soil moisture and OTVDI (original TVDI) and RTVDI (reconstructed TVDI) was examined in this study so that we can evaluate the ability of RTVDI to monitor drought under cloudy conditions. The evaluation results show that the RSDAST model not only expands the spatial scope and temporal continuity of drought monitoring in cloudy regions, but also raises the accuracy of regional drought monitoring (the R value between RTVDI and soil moisture in long time series and spatial distribution is higher than that of OTVDI), which greatly improves the availability and reliability of thermal infrared remote sensing data in cloudy conditions.
表1 重庆市土壤墒情站点信息Table 1 Soil moisture site information in Chongqing |
| 站点号 | 经度/E | 纬度/N | 高程/m | 土壤类型 | 地表类型 |
|---|---|---|---|---|---|
| 57333 | 108°39'47" | 31°56'40" | 798.2 | 砂壤土 | 农田 |
| 57338 | 108°15'09" | 31°05'36" | 208.0 | 粘壤土 | 草地 |
| 57339 | 108°47'38" | 30°52'32" | 855.0 | 壤土 | 茶树 |
| 57409 | 105°46'18" | 30°04'42" | 200.0 | 砂壤土 | 草地 |
| 57425 | 107°18'40" | 30°17'36" | 412.0 | 壤土 | 蔬菜地 |
| 57426 | 107°46'46" | 30°41'04" | 454.5 | 砂壤土 | 草地 |
| 57509 | 106°57'35" | 28°55'11" | 336.5 | 砂壤土 | 花木基地 |
| 57511 | 106°26'36" | 29°50'31" | 240.8 | 砂壤土 | 玉米 |
| A6000 | 106°19'49" | 30°08'38" | 289.0 | 粘壤土 | 玉米 |
| A6002 | 106°02'32" | 30°04'29" | 264.0 | 粘壤土 | 玉米 |
| A6005 | 108°25'00" | 31°11'00" | 216.5 | 砂壤土 | 草地 |
| A6009 | 108°20'19" | 31°00'04" | 199.0 | 砂壤土 | 草地 |
| A6010 | 106°09'16" | 29°08'44" | 262.0 | 粘壤土 | 玉米 |
| A6016 | 108°10'36" | 30°26'50" | 184.0 | 粘壤土 | 蔬菜 |
| A6017 | 107°56'39" | 30°25'13" | 608.0 | 粘壤土 | 油菜 |
| A6019 | 106°12'16" | 29°39'11" | 390.0 | 粘壤土 | 蔬菜 |
| A6025 | 108°49'36" | 29°34'27" | 716.0 | 壤土 | 猕猴桃 |
| A6027 | 107°22'39" | 30°23'45" | 441.2 | 砂壤土 | 油菜 |
| A6040 | 108°41'06" | 30°57'12" | 310.0 | 壤土 | 柑橘 |
| A6045 | 108°09'34" | 30°46'03" | 492.0 | 粘土 | 柑橘 |
| A6049 | 105°36'09" | 30°09'48" | 251.0 | 粘壤土 | 蔬菜 |
| 46056 | 107°49'39" | 30°43'01" | 472.0 | 粘壤土 | 草地 |
| A6057 | 107°37'51" | 30°30'22" | 478.0 | 粘壤土 | 草地 |
| A6066 | 107°13'53" | 29°57'38" | 418.0 | 粘土 | 柑橘 |
| A6077 | 106°38'45" | 29°48'05" | 368.0 | 粘壤土 | 蓝莓 |
| A6078 | 106°55'50" | 29°43'39" | 232.0 | 粘壤土 | 蔬菜 |
| A6081 | 106°01'43" | 29°54'18" | 312.0 | 粘壤土 | 蔬菜 |
| A6085 | 107°06'38" | 29°09'38" | 650.0 | 壤土 | 蔬菜 |
| A6093 | 106°44'30" | 29°28'20" | 279.0 | 粘壤土 | 茶树 |
| A6095 | 107°06'45" | 29°27'01" | 777.0 | 粘壤土 | 玉米 |
| A8802 | 106°31'47" | 29°22'47" | 506.1 | 砂壤土 | 蔬菜 |
| A8813 | 108°48'59" | 29°35'35" | 799.0 | 壤土 | 烟叶 |
| A8815 | 108°45'36" | 29°18'36" | 381.0 | 壤土 | 土豆 |
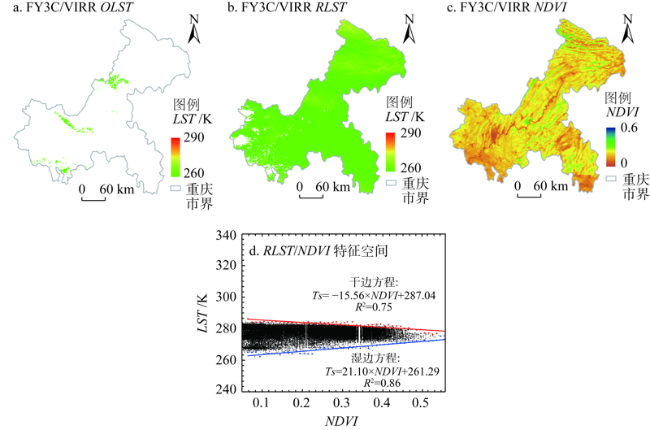
图7 2018年1月15日FY/VIRR OLST、RLST、NDVI以及OLST/NDVI特征空间和RLST/NDVI特征空间分布Fig. 7 FY/VIRR OLST, RLST, NDVI, scatter plots between OLST and NDVI, and scatter plots between RLST and NDVI on January 15, 2018 |
图10 2018年OTVDI、RTVDI与土壤墒情间的相关性系数随时间的变化Fig. 10 Time series of correlation coefficients (R) between TVDI (OTVDI and RTVDI) and soil moisture in 2018 |
| [1] |
易佳. 基于EOS-MODIS的重庆市干旱遥感监测技术研究. 重庆: 西南大学, 2010.
[
|
| [2] |
贺敏, 宋立生, 王展鹏, 等. 基于多源数据的干旱监测指数对比研究: 以西南地区为例. 自然资源学报, 2018,33(7):1257-1269.
[
|
| [3] |
|
| [4] |
|
| [5] |
|
| [6] |
|
| [7] |
|
| [8] |
|
| [9] |
|
| [10] |
卢晓宁, 张静怡, 王玲玲, 等. 综合考虑植被、温度和降水的四川省月尺度伏旱遥感监测. 自然资源学报, 2017,32(7):1145-1157.
[
|
| [11] |
|
| [12] |
|
| [13] |
|
| [14] |
|
| [15] |
|
| [16] |
|
| [17] |
田国良. 热红外遥感, 北京: 电子工业出版社, 2006: 282-283.
[
|
| [18] |
|
| [19] |
|
| [20] |
|
| [21] |
|
| [22] |
|
| [23] |
王凤杰, 冯文兰, 扎西央宗, 等. 基于FY3A/VIRR和TERRA/MODIS数据藏北干旱监测对比. 自然资源学报, 2017,32(7):1229-1239.
[
|
| [24] |
|
| [25] |
|
| [26] |
|
| [27] |
杜灵通, 候静, 胡悦, 等. 基于遥感温度植被干旱指数的宁夏2000—2010年旱情变化特征. 农业工程学报, 2015,31(14):209-216.
[
|
| [28] |
|
| [29] |
|
| [30] |
|
| [31] |
|
| [32] |
|
| [33] |
|
| [34] |
|
| [35] |
|
| [36] |
|
| [37] |
陈少丹, 张利平, 汤柔馨, 等. 基于SPEI和TVDI的河南省干旱时空变化分析. 农业工程学报, 2017,33(24):126-132.
[
|
| [38] |
|
| [39] |
李小文, 曹春香, 常超一. 地理学第一定律与时空邻近度的提出. 自然杂志, 2007,29(2):69-71.
[
|
| [40] |
李跃清. 青藏高原地面加热及上空环流场与东侧旱涝预测的关系. 大气科学, 2003,27(1):107-113.
[
|
| [41] |
彭京备, 张庆云, 布和朝鲁. 2006年川渝地区高温干旱特征及其成因分析. 气候与环境研究, 2007,12(3):454-474.
[
|
| [42] |
邹旭恺, 高辉. 2006年夏季川渝高温干旱分析. 气候变化研究进展, 2007,3(3):149-153.
[
|
| [43] |
鮑媛媛, 康志明, 金荣花, 等. 川渝地区夏季旱涝与海温异常浅析. 气象, 2007,33(5):89-93.
[
|
| [44] |
|
| [45] |
张德军, 杨世琦, 王永前, 等. 基于风云3卫星数据的温度植被干旱指数在重庆地区的应用. 高原山地气象研究, 2017,37(4):40-47.
[
|
/
| 〈 |
|
〉 |


