
青藏高原东北部土族家庭能源消费特征
|
李宏庆(1995- ),女,山东枣庄人,硕士,研究方向为能源环境地理与可持续发展。E-mail: lihongq@163.com |
收稿日期: 2020-03-13
要求修回日期: 2020-07-15
网络出版日期: 2021-01-28
基金资助
国家自然科学基金项目(41971166)
中国科学院青年创新促进会(2016181)
版权
Household energy consumption characteristics of the Tus ethnic group in the northeast of the Tibetan Plateau
Received date: 2020-03-13
Request revised date: 2020-07-15
Online published: 2021-01-28
Copyright
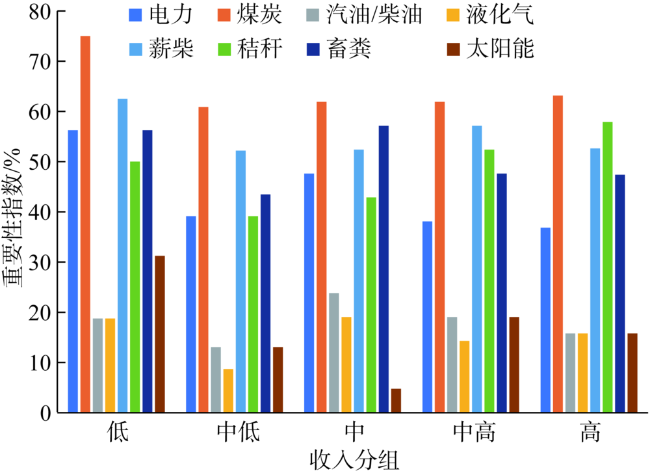
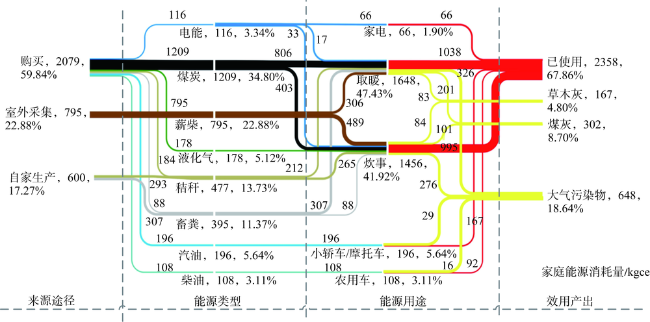
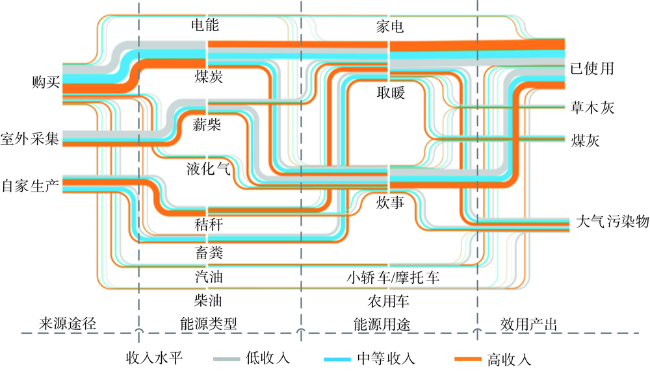
家庭能源消费特征因受地理环境及文化等影响而存在显著的人文空间差异,尤其是对于特色或边远少数民族地区,迫切需要加强相关调查实证研究。基于青海省100户土族家庭的实地调研,从收入水平分组视角考察其能源消费特征,分析家庭能源消费活动的环境效应,并构建物质流模型予以可视化分析。结果表明:土族家庭年人均能源消费量为3473 kgce,以煤炭、薪柴和秸秆等为主;随着收入水平提升,能源消费结构逐渐向多元化转变且对能源重要性的认知逐渐从生物质能源转向商品能源。家庭能源消费导致的年人均CO2、N2O、NOX、SO2和TSP的产生量分别为1856.87 kg、117.10 g、254.46 g、451.87 g和520.74 g。未来应增强清洁能源利用水平,统筹推进青藏高原地区生活能源消费的可持续转型。
李宏庆 , 邢冉 , 姜璐 , 陈兴鹏 , 薛冰 . 青藏高原东北部土族家庭能源消费特征[J]. 自然资源学报, 2020 , 35(11) : 2793 -2802 . DOI: 10.31497/zrzyxb.20201118
Energy plays an important role in social and economic development. Household energy consumption behavior has a wide range of connections with regional or global social ecosystems, and has significant spatial and social differences under the influence of culture and geography. China is a country with multi-ethnic groups. The ethnic areas in China have different characteristics in terms of production and lifestyle, climate conditions, cultural traditions, and other aspects and also show certain characteristics in the consumption of living energy. However, the research on the energy geography of ethnic minority groups' households is still on the initial stage and lacks a first-hand data survey. Based on the special geographical characteristics of the Tibetan Plateau, this study focused on the 100 Tu's households in Qinghai province and carried out field investigations. From the perspective of overall investigation and income-based groups, we compared the characteristics of their household energy consumption, calculated the environmental effects, constructed an energy flow model, and visualized the household energy consumption input-out flow. The survey results show that the per capita energy consumption of Tu households is 3473 kgce, and the energy resources are mainly coal, firewood, straw, and cow-dung. By comparison, we found that the energy consumption of low-income households is 3485 kgce, while that of high-income households is 3974 kgce. As income levels rise, the energy consumption structure gradually changes to diversification, and the importance of energy gradually turns from biomass energy to commodity energy. The survey shows that the convenience of household energy access is listed in a discending order of electricity, straw, animal dung, fuelwood, solar energy, coal, gasoline/diesel, and liquefied gas. The per capita greenhouse gas and pollutant emissions of households are 1872.21 kg, of which CO2, N2O, CH4, NOX, SO2 and TSP are 1856.87 kg, 117.10 g, 295.14 g, 254.46 g, 451.87 g and 520.74 g, respectively. In the future, the Tibetan Plateau region should enhance the use of clean energy, and promote the sustainable transformation of regional household energy consumption. The research results are expected to provide scientific support for the clean energy transformation and sustainable development on the Tibetan Plateau.
表1 不同收入水平家庭的基本信息Table 1 The basic information for households with different incomes |
| 收入分组/元 | 低收入 3000~6550 | 中低收入 6551~10000 | 中等收入 10001~16000 | 中高收入 16001~23000 | 高收入 23001~50000 |
|---|---|---|---|---|---|
| 问卷数量/份 | 16 | 23 | 21 | 21 | 19 |
| 家庭收入/元 | 12250 | 18609 | 21571 | 35333 | 57526 |
| 家庭规模/人 | 4.5 | 4.3 | 4.6 | 4.8 | 4.7 |
| 非劳动力人口/人 | 2.1 | 2.3 | 2.2 | 2.2 | 2.3 |
| 户主受教育年限/年 | 9.7 | 9.0 | 8.9 | 8.6 | 9.0 |
| 高于初中学历人数/人 | 2.6 | 2.0 | 2.5 | 2.3 | 2.1 |
| 户主年龄/岁 | 52 | 49 | 53 | 50 | 49 |
表2 家庭能源消费数量和结构Table 2 Quantity and structure of household energy consumption |
| 类型 | 低收入 | 中低收入 | 中收入 | 中高收入 | 高收入 | |||||||||
|---|---|---|---|---|---|---|---|---|---|---|---|---|---|---|
| kgce | % | kgce | % | kgce | % | kgce | % | kgce | % | |||||
| 煤炭 | 1200 | 34.43 | 1021 | 30.10 | 1307 | 41.14 | 1150 | 34.46 | 1364 | 34.32 | ||||
| 汽油 | 200 | 5.73 | 191 | 5.62 | 153 | 4.81 | 241 | 7.22 | 195 | 4.91 | ||||
| 柴油 | 67 | 1.94 | 220 | 6.50 | 50 | 1.56 | 49 | 1.47 | 152 | 3.83 | ||||
| 液化气 | 103 | 2.95 | 134 | 3.94 | 182 | 5.72 | 214 | 6.42 | 257 | 6.47 | ||||
| 电力 | 96 | 2.75 | 109 | 3.22 | 124 | 3.91 | 120 | 3.61 | 132 | 3.32 | ||||
| 薪柴 | 1100 | 31.56 | 998 | 29.41 | 486 | 15.31 | 726 | 21.77 | 664 | 16.70 | ||||
| 秸秆 | 314 | 9.01 | 290 | 8.56 | 277 | 8.73 | 647 | 19.39 | 857 | 21.55 | ||||
| 畜粪 | 406 | 11.64 | 429 | 12.65 | 598 | 18.81 | 189 | 5.66 | 354 | 8.90 | ||||
表3 家庭能源获取困难程度Table 3 Difficulty in obtaining energy for households (%) |
| 类型 | 非常困难 | 比较困难 | 一般 | 比较容易 | 非常容易 | 平均分值 |
|---|---|---|---|---|---|---|
| 电力 | 0.95 | 43.82 | 38.54 | 14.83 | 1.86 | 3.28 |
| 煤炭 | 16.75 | 54.48 | 20.67 | 4.52 | 3.49 | 3.78 |
| 汽油/柴油 | 23.34 | 29.96 | 11.24 | 0.51 | 34.96 | 3.10 |
| 液化气 | 31.20 | 13.95 | 3.33 | 0.81 | 50.70 | 2.67 |
| 薪柴 | 5.97 | 41.61 | 24.25 | 23.92 | 4.26 | 3.22 |
| 秸秆 | 4.72 | 33.21 | 28.38 | 30.95 | 2.73 | 2.95 |
| 畜粪 | 8.12 | 25.46 | 30.96 | 13.32 | 22.15 | 2.97 |
| 太阳能 | 20.04 | 24.93 | 15.34 | 9.30 | 30.39 | 2.80 |
表4 能源用途及比例分析Table 4 Analysis of energy use and proportion (%) |
| 类型 | 获取途径 | 主要用途 | 使用率 | ||||
|---|---|---|---|---|---|---|---|
| 低收入 | 中低收入 | 中等收入 | 中高收入 | 高收入 | |||
| 电力 | 购买 | 炊事、照明等家用 | 87.50 | 100.00 | 100.00 | 95.24 | 100.00 |
| 煤炭 | 购买 | 炊事、取暖 | 81.25 | 100.00 | 85.71 | 100.00 | 94.74 |
| 汽油/柴油 | 购买 | 交通出行 | 93.75 | 82.61 | 95.24 | 95.24 | 84.21 |
| 液化气 | 购买 | 炊事 | 12.50 | 47.83 | 47.62 | 38.10 | 42.11 |
| 薪柴 | 室外采集 | 炊事、取暖 | 87.50 | 91.30 | 71.43 | 85.71 | 78.95 |
| 秸秆 | 自家生产、室外采集 | 炊事、取暖 | 81.25 | 60.00 | 76.19 | 60.48 | 73.68 |
| 畜粪 | 自家生产、室外采集 | 炊事、取暖 | 37.50 | 65.22 | 52.38 | 71.43 | 63.16 |
| 太阳能 | 室外采集 | 照明等家用 | 12.50 | 39.13 | 52.38 | 47.62 | 52.63 |
表5 温室气体和污染物排放因子Table 5 Greenhouse gas and air pollutant emission coefficients |
| 类型 | CO2 | N2O | CH4 | NOX | SO2 | TSP |
|---|---|---|---|---|---|---|
| 煤炭/(g/kg) | 1963.35 | 0.04 | 1.47 | 1.83 | 9.59 | 1.82 |
| 汽油/(g/kg) | 3448.94 | 0.06 | 1.12 | 7.94 | 0.20 | 0.12 |
| 柴油/(g/kg) | 3515.04 | 0.06 | 1.11 | 12.60 | 0.12 | 0.12 |
| 液化气/(g/kg) | 3127.81 | 0.02 | 0.05 | 2.20 | 0.18 | 0.00 |
| 电力/[g/(kW·h)] | 147.61 | 0.06 | 0.36 | 0.89 | 1.37 | 2.55 |
| 薪柴/(g/kg) | 1522.99 | 0.14 | 2.36 | 1.44 | 0.46 | 5.34 |
| 秸秆/(g/kg) | 1318.45 | 0.14 | 4.78 | 1.75 | 0.45 | 18.77 |
| 畜粪/(g/kg) | 903.59 | 0.10 | 3.76 | 2.45 | 2.64 | 20.40 |
表6 家庭人均温室气体和污染物排放情况Table 6 Per capita emissions of greenhouse gases and pollutants in households (kg) |
| CO2 | N2O | CH4 | NOx | SO2 | TSP | |
|---|---|---|---|---|---|---|
| 低收入 | 1924.91 | 0.12 | 2.96 | 2.52 | 4.56 | 5.02 |
| 中低收入 | 1930.58 | 0.12 | 2.94 | 2.81 | 4.25 | 5.07 |
| 中收入 | 1652.67 | 0.10 | 2.64 | 2.34 | 4.95 | 4.95 |
| 中高收入 | 1714.07 | 0.11 | 2.72 | 2.22 | 3.95 | 4.66 |
| 高收入 | 2062.13 | 0.13 | 3.49 | 2.83 | 4.89 | 6.33 |
| 平均值 | 1856.87 | 0.12 | 2.95 | 2.54 | 4.52 | 5.21 |
| [1] |
United Nations (UN). Transforming our world: The 2030 agenda for sustainable development. https: //www.unescw a.org/ar/node/266888, 2019-10-28.
|
| [2] |
UNFCCC (United Nations Framework Convention on Climate Change). The Paris Agreement. https: //unfccc.int/process-and-meetings/the-paris-agreement/the-paris-agreement, 2019-12-15.
|
| [3] |
陈兴鹏, 姜璐, 邢冉, 等. 基于文献计量的中国家庭能源消费的地理格局及影响因素分析. 贵州师范大学学报: 自然科学版, 2019,37(6):1-7.
[
|
| [4] |
|
| [5] |
|
| [6] |
|
| [7] |
|
| [8] |
|
| [9] |
|
| [10] |
|
| [11] |
吴燕红, 曹斌, 高芳, 等. 滇西北农村生活能源使用现状及生物质能源开发利用研究: 以兰坪县和香格里拉县为例. 自然资源学报, 2008,23(5):781-789.
[
|
| [12] |
刘刚. 西藏能源消费格局及其环境效应. 北京: 中国科学院研究生院, 2007.
[
|
| [13] |
蔡国田, 张雷. 西藏农村能源消费及环境影响研究. 资源开发与市场, 2006,22(3):238-244.
[
|
| [14] |
吴彦潮, 赵翠薇. 贵州省低碳经济发展动态评价研究. 贵州师范大学学报: 自然科学版, 2016,2(34):19-26.
[
|
| [15] |
聂泓玮, 张晓妮, 勾思曼. 西南少数民族地区农户生活能源消费结构影响因素分析: 以云南省德宏、怒江自治州为例. 中国农学通报, 2019,35(23):159-164.
[
|
| [16] |
|
| [17] |
|
| [18] |
杨小军, 王轶博, 徐晋涛. 少数民族地区农村家庭生活能源消费需求研究: 以甘肃省、云南省为例. 林业经济, 2016,38(6):14-21, 54.
[
|
| [19] |
胡芳. 土族人口的数量与性别年龄结构变动分析. 青海社会科学, 2016,7(6):119-125.
[
|
| [20] |
李林, 李晓东, 校瑞香, 等. 青藏高原东北部气候变化的异质性及其成因. 自然资源学报, 2019,34(7):1496-1505.
[
|
| [21] |
王天穷, 顾海英. 我国农村能源政策以及收入水平对农户生活能源需求的影响研究. 自然资源学报, 2017,32(8):1286-1297.
[
|
| [22] |
IEA (International Energy Agency). Real-world policy packages for sustainable energy transitions. https: //www.iea.org/events/ real-world-policy-packages-for-sustainable-energy-transitions, 2018-11-18.
|
| [23] |
IPCC. 2006 IPCC guidelines for national greenhouse gas inventories: Volume II. Japan: The Institute for Global Environmental Strategies, 2008.
|
| [24] |
陈菡, 於世为. 中国生活能源消费的典型污染物排放及驱动因素研究. 中国人口·资源与环境, 2017,27(12):40-51.
[
|
| [25] |
孙永龙, 牛叔文, 兰忠成, 等. 牧民家庭能源消费模式的演变及环境效应. 农业工程学报, 2014,30(16):256-262.
[
|
| [26] |
生态环境部. 大气细颗粒物一次源排放清单编制技术指南, 2014.
[ Ministry of Ecology and Environment. Technical guidelines for the compilation of primary source emission inventory of atmospheric fine particles, 2014.]
|
| [27] |
李静, 刘丽雯. 中国家庭消费的能源环境代价. 中国人口·资源与环境, 2017,27(12):31-39.
[
|
| [28] |
|
| [29] |
闫珍奇, 叶维超, 陈剑, 等. 浙江省农村能源结构及主要污染物排放量估算. 农业工程, 2017,7(4):60-64.
[
|
| [30] |
|
| [31] |
|
| [32] |
王天天, 卢笛音, 曹雅. 物质流分析方法及应用研究综述. 再生资源与循环经济, 2017,10(8):9-12, 16.
[
|
| [33] |
董梅, 徐璋勇. 农村家庭能源消费结构及影响因素分析: 以陕西省1303户农村家庭调查为例. 农林经济管理学报, 2018,17(1):45-53.
[
|
| [34] |
|
| [35] |
|
| [36] |
曹建军, 许雪赟, 杨书荣, 等. 青藏高原不同草地利用方式产生的原因及其对社会—生态系统的影响研究进展. 自然资源学报, 2017,32(12):2149-2159.
[
|
| [37] |
吴玲, 肖盼. 江苏省家庭能源消费及影响因素调查. 南京工程学院学报: 社会科学版, 2018,18(3):51-54.
[
|
| [38] |
|
| [39] |
|
/
| 〈 |
|
〉 |