
基于供需视角的中国煤炭消费演变特征及其驱动机制
|
王长建(1986- ),男,河南南阳人,博士,副研究员,硕士生导师,主要从事经济地理、能源地理与可持续发展研究。E-mail: wwwangcj@126.com |
收稿日期: 2020-02-10
要求修回日期: 2020-06-30
网络出版日期: 2021-01-28
基金资助
南方海洋科学与工程广东省实验室(广州)专项(GML2019ZD0301)
广东省科技计划项目(2018B030324002)
广东省科学院实施创新驱动发展能力建设专项(2016GDASRC-0101)
广东省科学院实施创新驱动发展能力建设专项(2019GDASYL-0302001)
版权
Evolving characteristics and driving mechanism of coal consumption in ChinaBased on the perspective of supply and demand
Received date: 2020-02-10
Request revised date: 2020-06-30
Online published: 2021-01-28
Copyright
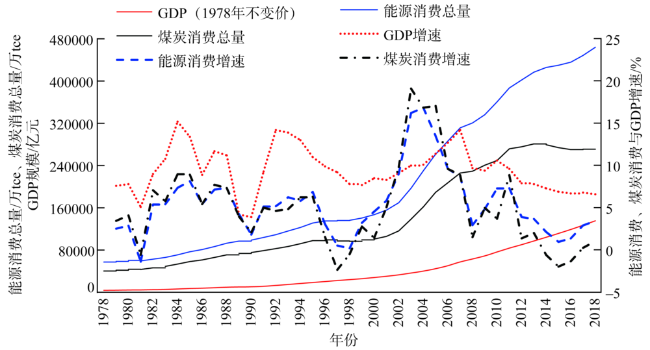
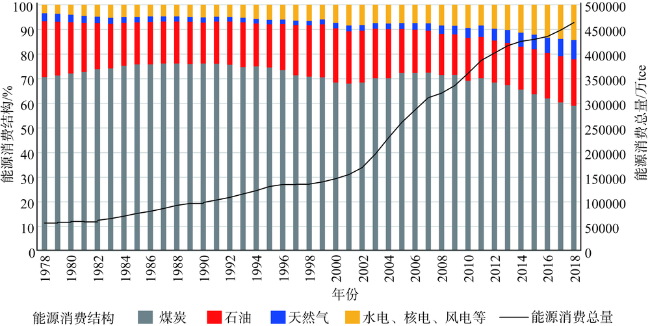
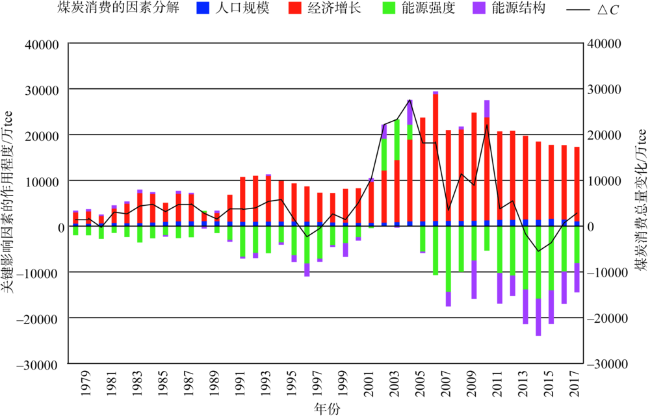
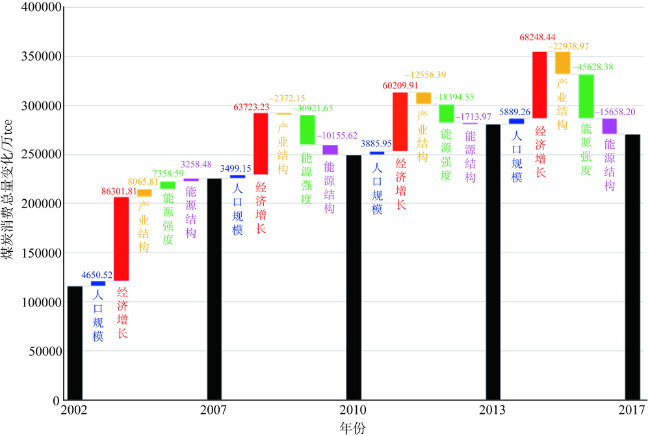
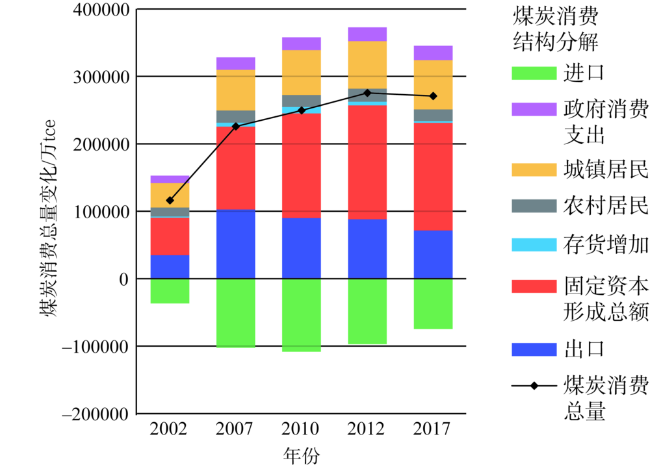
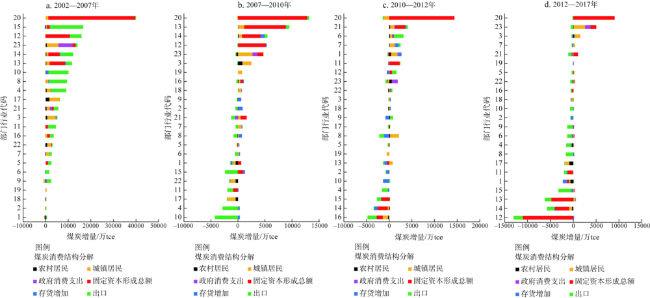
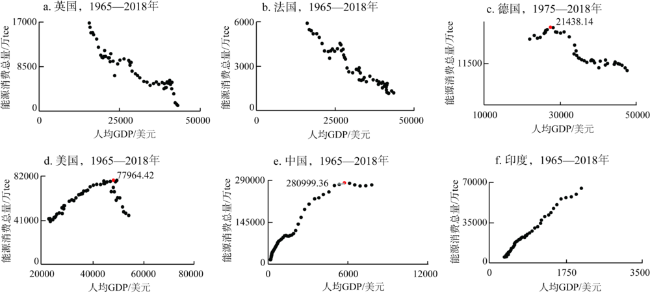
作为全球煤炭消费和碳排放最大的国家,中国煤炭消费的演变趋势及其驱动机制,一直是科研工作者和政策制定者比较关注的议题。以2013年中国煤炭消费总量28亿tce为关键时间节点,对比分析煤炭消费动力机制的差异性。通过分别构建侧重供给侧分析的LMDI模型和侧重需求侧分析的IO-SDA模型,以期揭示中国煤炭消费的演变特征及驱动机制。主要结论如下:(1)基于供给端的因素分解分析,中国的煤炭消费主要由经济增长效应、能源强度效应、产业结构效应和能源结构效应共同驱动。2013年以来的GDP增速放缓、产业结构和能源结构的深度调整,以及能源消费强度的持续降低是煤炭消费总量下降的关键所在。(2)基于需求侧的结构分解分析,中国的煤炭消费主要由固定资本形成总额、出口和城镇居民消费所影响。出口紧随固定资本形成总额,是煤炭消费增长的两大需求端驱动因素,但是,由出口诱发的煤炭消费量在2007年全球金融危机之后达到阶段性峰值。城镇居民消费在2017年超越出口,成为当前煤炭消费增长的第二大需求端驱动因素。(3)基于最终需求视角,分行业煤炭消费呈现出由“出口到固定资本形成总额再到城镇居民消费”拉动的变化特征,同时,行业发展的煤炭资源依赖性逐步降低。
王长建 , 汪菲 , 叶玉瑶 , 张新林 , 苏泳娴 , 姜璐 , 李增 , 张虹鸥 . 基于供需视角的中国煤炭消费演变特征及其驱动机制[J]. 自然资源学报, 2020 , 35(11) : 2708 -2723 . DOI: 10.31497/zrzyxb.20201112
China has been the world's largest energy consumer and carbon dioxide emitter. The evolution trend of China's coal consumption and its driving mechanism have always been a topic of concern to researchers and policy makers. Taking China's total coal consumption of 2.8 billion tons of standard coal in 2013 as the key time point, a comparative analysis of the differences in the dynamics of coal consumption mechanisms has been conducted. An extended LMDI model based on the classical IPAT identity and an input output-structural decomposition analysis (IO-SDA) model were adopted to determine the main driving factors for coal consumption in China. The impacts and influences of various factors on coal consumption were different in different development stages. China's coal consumption was mainly driven by the effects of economic growth, energy intensity, industrial structure and energy structure. The slowdown in GDP growth since the economy entered the "New Normal", the in-depth adjustment of the industrial structure and energy structure, and the continuous decline in energy consumption intensity were the key to the decline in total coal consumption since 2013. Based on the demand-side structural decomposition analysis, China's coal consumption was mainly affected by capital formation, exports, and urban household consumption. The embodied coal consumption of Chinese exports has peaked after the global financial crisis in 2007. Coal consumption induced by urban household consumption surpassed export-induced coal consumption in 2017, which became the second largest demand-side driver of China's total coal consumption growth. Based on the perspective of final demand, coal consumption by sectoral industry performed a changing feature of "driven by exports→driven by capital formation→driven by urban household consumption". The industry's coal resource dependence has gradually decreased. China's total coal consumption has entered a peak stage with the maximum value appearing in 2013.
Key words: coal consumption; LMDI; IO-SDA; China
表1 中国23部门投入产出行业分类表Table 1 China's 23 sector input-output table |
| 代码 | 产业 | 代码 | 产业 |
|---|---|---|---|
| 1 | 农、林、牧、渔业 | 13 | 交通运输设备制造业 |
| 2 | 采掘业 | 14 | 电气机械及器材制造业 |
| 3 | 食品加工制造及烟草加工业 | 15 | 电子及通信设备制造业 |
| 4 | 纺织服装业 | 16 | 其他制造业 |
| 5 | 木材及家具制造业 | 17 | 电力、热力的生产和供应业 |
| 6 | 造纸及文教用品制造业 | 18 | 煤气的生产和供应业 |
| 7 | 石油加工及炼焦业 | 19 | 自来水的生产和供应业 |
| 8 | 化学工业 | 20 | 建筑业 |
| 9 | 非金属矿物制品业 | 21 | 交通运输、仓储和邮政业 |
| 10 | 金属冶炼及压延加工业 | 22 | 批发、零售业和住宿、餐饮业 |
| 11 | 金属制品业 | 23 | 其他行业 |
| 12 | 通用、专用设备制造业 |
表2 中国煤炭消费关键影响因素的分阶段指数分解分析Table 2 Index decomposition analysis of key influencing factors of coal consumption in China in different periods (万tce) |
| 年份 | p | g | f1 | f2 | f3 | △C |
|---|---|---|---|---|---|---|
| 2002—2007 | 4650.52 | 86301.81 | -454.14 | 8487.76 | 32.19 | 109635.21 |
| 2007—2010 | 3499.15 | 63723.23 | -131.88 | -2321.14 | 80.87 | 23772.97 |
| 2010—2013 | 3885.95 | 60209.91 | -90.75 | -12715.38 | 249.75 | 31430.95 |
| 2013—2017 | 5889.26 | 68248.44 | -288.39 | -23137.60 | 487.03 | -10087.85 |
| 时段/年 | e1 | e2 | e3 | s1 | s2 | s3 |
| 2002—2007 | -60.35 | 7489.70 | -70.76 | 186.39 | 4511.78 | -1439.68 |
| 2007—2010 | -873.23 | -29715.18 | -333.24 | -183.98 | -11075.96 | 1104.32 |
| 2010—2013 | -92.16 | -17909.64 | -392.75 | -126.44 | -1253.49 | -334.04 |
| 2013—2017 | 2.98 | -44861.87 | -769.49 | 416.51 | -16087.36 | 12.65 |
| [1] |
|
| [2] |
杨宇, 刘毅. 世界能源地理研究进展及学科发展展望. 地理科学进展, 2013,32(5):818-830.
[
|
| [3] |
BP. Statistical Review of World Energy. 2019.
|
| [4] |
杨宇, 王礼茂, 江东, 等. 美国对伊朗石油禁运与全球能源安全. 地理研究, 2018,37(10):1879-1898.
[
|
| [5] |
中华人民共和国国家统计局. 中国统计年鉴. 2019.
[ National Bureau of Statistcs of China. China Statistical Yearbook. 2019.]
|
| [6] |
石敏俊, 黄文, 李娜. 资源优势能否转化为产业优势: 煤炭开发重心西移对能源密集型产业空间格局变化的影响. 自然资源学报, 2015,30(6):891-902.
[
|
| [7] |
朱孟珏, 庄大昌, 李涛. 1990—2014年中国煤炭运输网络的时空特征研究. 自然资源学报, 2018,33(3):454-466.
[
|
| [8] |
|
| [9] |
柳君波, 高俊莲, 徐向阳. 中国煤炭供应行业格局优化及排放. 自然资源学报, 2019,34(3):473-486.
[
|
| [10] |
|
| [11] |
林伯强, 吴微. 中国现阶段经济发展中的煤炭需求. 中国社会科学, 2018, (2): 141-161, 207-208.
[
|
| [12] |
|
| [13] |
|
| [14] |
林伯强, 李江龙. 环境治理约束下的中国能源结构转变: 基于煤炭和二氧化碳峰值的分析. 中国社会科学, 2015, (9):84-107, 205.
[
|
| [15] |
|
| [16] |
|
| [17] |
|
| [18] |
|
| [19] |
|
| [20] |
王长建, 汪菲, 张虹鸥. 新疆能源消费碳排放过程及其影响因素: 基于扩展的Kaya恒等式. 生态学报, 2016,36(8):2151-2163.
[
|
| [21] |
何则, 杨宇, 宋周莺, 等. 中国能源消费与经济增长的相互演进态势及驱动因素. 地理研究, 2018,37(8):1528-1540.
[
|
| [22] |
王长建, 张小雷, 张虹鸥, 等. 基于IO-SDA模型的新疆能源消费碳排放影响机理分析. 地理学报, 2016,71(7):1105-1118.
[
|
| [23] |
|
| [24] |
|
| [25] |
|
| [26] |
|
| [27] |
|
| [28] |
贺灿飞, 王俊松. 经济转型与中国省区能源强度研究. 地理科学, 2009,29(4):461-469.
[
|
| [29] |
刘卫东, 唐志鹏, 夏炎, 等. 中国碳强度关键影响因子的机器学习识别及其演进. 地理学报, 2019,74(12):2592-2603.
[
|
| [30] |
陆大道. 中速增长: 中国经济的可持续发展. 地理科学, 2015,35(10):1207-1219.
[
|
| [31] |
|
| [32] |
|
| [33] |
贺灿飞, 陈航航. 参与全球生产网络与中国出口产品升级. 地理学报, 2017,72(8):1331-1346.
[
|
| [34] |
|
| [35] |
|
| [36] |
IEA. Global Energy & CO2 Status Report 2018: The latest trends in energy and emissions in 2018. 2019.
|
/
| 〈 |
|
〉 |