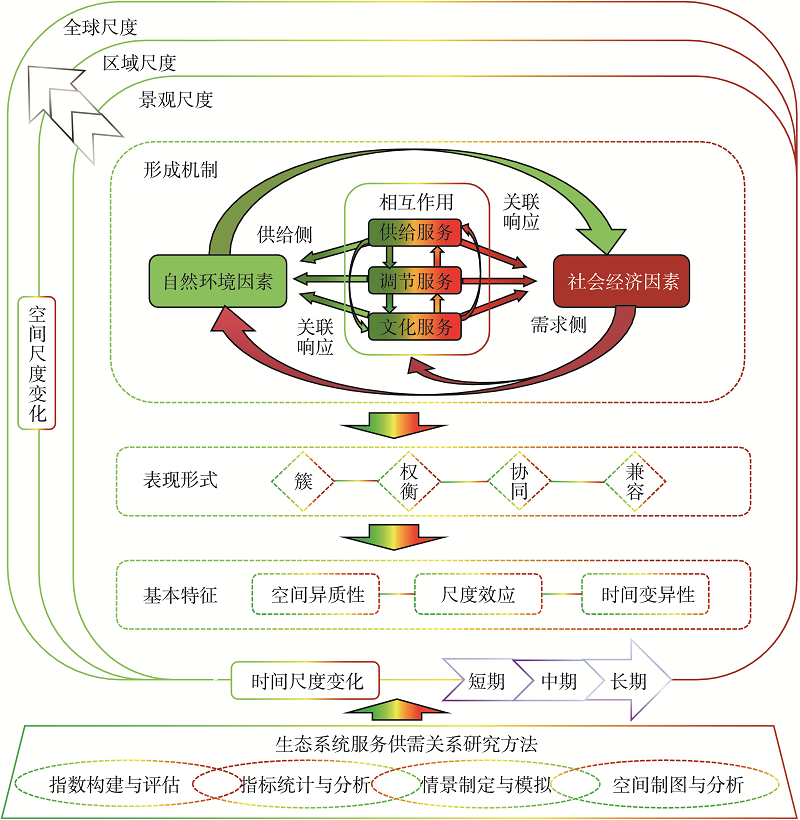
Understanding the relationships between ecosystem services supplies and demands is of vital importance for sustainably utilizing natural capital and coordinating ecosystem services supplies and demands. According to the previous research on ecosystem services at home and abroad, the research framework of the relationships among ecosystem services supplies and demands was put forward in this study. Within this framework, the formation mechanisms and representations of the relationships between ecosystem services supplies and demands were explained, the basic characteristics of the relationships between ecosystem services supplies and demands were summarized, and the potential research focuses were proposed, which could provide a guidance for the studies on the ecosystem services and the governance of ecosystem services. In general, there were two non-exclusive mechanisms that formed the relationships between ecosystem services supplies and demands. On the basis of these formation mechanisms, the representations of the relationships between ecosystem services supplies and demands included bundles, trade-offs, synergies and no-effect relationships. In terms of the characteristics, the relationships between ecosystem services supplies and demands could be spatially heterogeneous, temporally variable and scale dependent. The construction and evaluation of indexes, statistical analysis of indicators, development and simulation of scenarios, and spatial mappings and analysis were the four main methods to study the relationships between ecosystem services supplies and demands.
Recreation oriented ecological restoration (ROER) of national territorial space is an important mean of integrating the protection of damaged ecological space with human leisure function. It is also an important content in building a life community of common destiny of mountains, rivers, forests, farmlands, lakes and grasslands, and improving human well-being. Based on the present research at home and abroad, this paper defined the concept of ROER of geographical space, and pointed out that this kind of ecological restoration should follow the guidance of five theories: ecosystem services theory, man-land relationship areal system theory, location theory, landscape gene theory and earth art theory. Based on practical cases, we summarized the types, characteristics and problems of ROER of land space. Then, we put forward five optimization paths for the practice patterns to identify the restoration orientation with appropriate functions and optimal benefits, to establish a multi-level space scale of transmission mechanism, to promote the local embeddedness of ROER, to strengthen the dynamic monitoring and evaluation of the restoration effects, and to build a sustainable construction and operation management mode, which can provide theoretical and practical references for the ROER and protection of national territorial space.
Evaluation of biodiversity maintenance function is an essential precondition for ecosystem assessment. In this study, we modified and improved the biodiversity maintenance service capability model based on the law of species richness vertical zonality. Then, we further quantified the responses among three spatial scales of provincial, municipal and priority zones. The main conclusions in this study are as follows: (1) There are significant distribution differences in the scales of provincial, municipal and priority areas of biodiversity conservation (PABC). The most important areas in the provincial scale are concentrated in the Qinling-Daba mountains, while they are scarcely distributed at the municipal scale. There is a high consistency of distribution between nature reserves and the most important areas at the priority area scale. (2) The accuracy of identification from high to low in the three scales was: the priority area scale (19.5%), provincial scale (11.7%), and municipal scale (11.2%). The priority area scale assessment is more accurate than that of the administrative area scale. (3) The most important area identified by the scale assessment of the priority area is 28032.3 km2, accounting for 13.7% of Shaanxi province. Comprehensive evaluation results of land use structure and species importance in extremely important areas are superior to those in the administrative area scale.
Remote sensing data can provide long-term sequences for replenishing wetlands in changing environments under the context of scarce data. The accurate identification of wetland systems in arid regions is important to the comprehensive regulation and feedback mechanism of water and soil resources. However, we lack long-term data accumulation in the national wetlands in the context of the complex underlying surface of the Belt and Road region. In this study, random forest (RF) classification model was used to map the spatial distribution pattern of the typical terminal lake wetland in the arid regions over the past 30 years. Through the accurate wetland mapping, the spatial conversion rule of the wetland landscape is calculated, and the spatial connectivity of the wetland landscape is determined. We present the results of a high-precision classification study conducted in the Ebinur Lake National Wetland Reserve (Kappa coefficient is greater than 0.9). The spatial and temporal changes in the Ebinur Lake wetland during 1991-2017 was extremely significant, especially in different seasons of the year. From 1991 to 2017, the total area of wetlands, rivers, lakes, constructed wetlands, and salt marshes increased by 425.06 km2, 47.97 km2, 233.95 km2, 48.74 km2, and 109.41 km2, respecctively, while the total area of marshes decreased by 15.01 km2. The annual change in salt marsh conversion is the largest, and the lake wetlands were shrinking gradually from spring to autumn, mainly into swampy wetlands. In addition, the ideal spatial connectivity of Ebinur wetland is listed in the order of spring > summer > autumn. The connectivity between lake wetlands, marsh wetlands and non-wetlands is better than that of other types of wetlands. The connectivity of wetland landscapes depends on the wetland patches with larger areas. To a certain extent, this research compensates the basic wetland data in the scarce data area, and provides a typical demonstration for the long-term mechanism of ecological water replenishment in the Belt and Road region.
The impact of landscape changes on the quality and connectivity of habitats for multiple wildlife species is a global conservation concern. Zhalong Wetland is not only the priority areas of biodiversity conservation in China, but also the largest haibitat in the world with a large number of red-crowned cranes (Grus japonensis) breeding. The red-crowned crane was listed as a globally endangered species by the IUCN Red List of threatened species (IUCN, 2012), which is the umbrella species and the most sensitive biological indicator species of ecological changes in Zhalong Wetland. The selection of breeding habitat and the dispersal between suitable habitats in the study area are of great significance to the protection of wild red-crowned cranes. Firstly five variables (distance to water, soil wetness, NDVI, distance to roads and distance to buildings) were derived, which was hypothesized to influence the quality of habitat for red-crowned cranes according to the actual investigation within an area encompassing the entire Zhalong Nature Reserve. The MAXENT model was used to predict the suitable habitat distribution of red-crowned crane and analyze the response curve of each factor. The results showed that the red-crowned cranes were more likely to inhabit far away from roads and residents, and the breeding habitat might be close to water with more vegetation in a higher soil moisture condition. Finally, 38 suitable habitat patches were extracted from MAXENT model to simulate the multipath dispersal of red-crowned cranes when they lost flight ability based on circuit theory in landscape connectivity. Our map of maximum current flow between patches highlighted the possible pinch points, which can be used for red-crowned cranes moving directly between patch pairs. Current flow summed across all pairs of patches highlighted areas important for keeping the entire network connected. The results show that based on the suitable habitat patches predicted by MaxEnt model, considering the migration and diffusion behavior of the red-crowned crane in the breeding period, the comprehensive importance of the suitable habitat patches is evaluated by using the area weighting of the cumulative current density, and the suitability level is more consistent with the real nest distribution of the red-crowned cranes. Map results can be used to support the planning efforts concerned with the maintenance of red-crowned cranes metapopulation structure, as well as to protect the landscape features that facilitate the dispersal process.
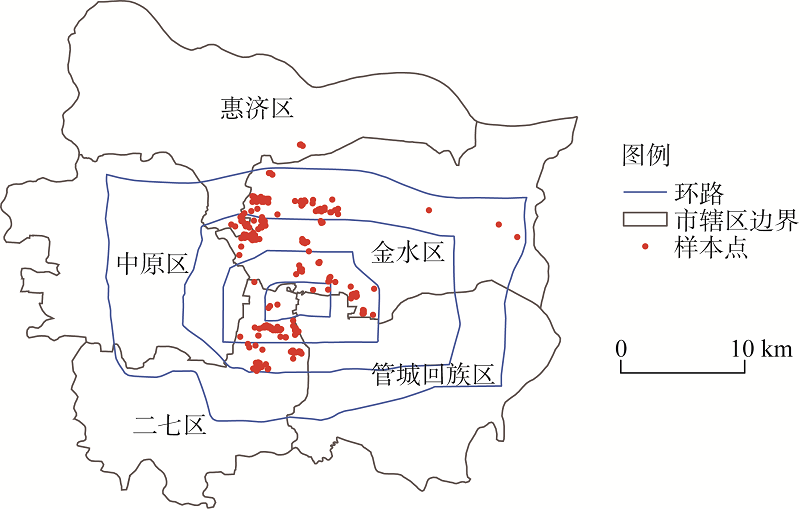
Food consumption is the primary way to get access to the basically-needed energy and nutrition for human being. Our investigation was conducted in Zhengzhou city, one of the provincial cities in central China, by a 3-consecutive-day household weighting survey. We gained a first-hand dataset consisting of 309 urban households in Zhengzhou and their food consumption data. Our research reveals that: (1) Urban households in the study city held a 372.32 g of food consumption for each meal per capita, which was dominated by plant-based foods (277.12 g). The ratio between plant-based foods and animal foods was 3∶1. (2) Among the three urban districts, Huiji consumed more sea food and fruits compared with Erqi and Jinshui. The per capita consumption of staple foods and vegetables for households in the city tended to decrease as annual per capita income rose, while that of fruits, seafood and dairy increased. Households with a smaller population consumed more food per capita compared with those with a larger population. (3) Furthermore, the comparison of research results and the general dietary guidelines indicated that the dietary pattern of urban households in Zhengzhou need to be further adjusted. Briefly, their meats consumption far exceeded the recommended upper threshold, while the consumption of dairy products and fruits did not reach the recommended anount. In the following application of "Health China" and other relevant national strategies, we should continue to highlight the urban household food consumption, promote and diversify the content and form of nutrition & health education in communities and families. The excessive meat consumption needs to be reduced in a reasonable range, and the high-nutrition foods should be expanded and encouraged.
How to widen the application of the principle and method of main functional areas governance and effectively improve the effect of territory space governance at the county level is a realistic issue in China's natural resources management in the new era. Main functional areas play a fundamental role in territorial space control, focusing on the spatial scope related to high development density, low resource and environment bearing capacity, and issues concerning national food and ecological security. The county main functional divisions should follow the idea of suitability discrimination of supply and demand orientation, take into account the ambiguity of spatial boundary and the overlapping of supervision responsibilities and powers, and integrate the technology discrimination with the main body consultation, so as to be implemented on the administrative boundary of town and village as far as possible. The application study on Ganyu county in Lianyungang city shows that the administrative boundary of the town can be used as the spatial boundary threshold to divide the main functional areas such as transition development areas, upgrading development areas, key development areas, key cultivation areas, general agricultural production areas, fruit industrial park construction area, and forbidden development areas. The delineation and implementation of county main functional areas should take into full consideration the relationship between spatial affairs and powers at the county level, and build a governance and supervision system with provincial-level and county-level governments as the main body and the participation of the whole society. And it is necessary to form a coordinated and interactive policy mechanism of control and decision-making from the three aspects of land market, policy regulation and social supervision.
Spatial function identification plays a major part in land spatial planning, which is of important theoretical and practical significance. The data sources in this article come from multivariate information, such as land use and cover status data, refined DEM data, terrain and landform data, and other types of basic geographic information; water, ecology, environment, disaster and other types of special survey research data; population, economy, transportation and other types social statistics data. From the perspective of multivariate information integration and automatic classification, we used GIS spatial analysis, multivariate statistical analysis, measurement model, rule-based classification model and other technical methods, to build a set of key technologies and methods for realizing spatial function identification for land spatial planning in city and county scales. Finally, we conducted an empirical study with the above research methods in Yulin city. The empirical study shows that the method in this paper effectively integrates geographic entity units, functional evaluation indicators and other element characteristics into unified regional units, which indirectly guarantees the accuracy of spatial function classification and identification. In addition, through classification algorithm, we can realize automated spatial function identification, which improves the objectivity and work efficiency for land spatial planning.
In the context of national park system reform, the establishment of a national park-based nature reserve system is a series of requirements for the optimization and integration of nature reserves in China. Currently, Fujian province has been optimizing and integrating nature reserves, and Taining county is one of the most complicated areas overlapped with nature reserves in this province. Therefore, the paper takes this county as the research object, and constructs three optimized and integrated scenario planning schemes as follows based on field surveys and expert opinions: (1) Maintain the status without integration; (2) Integrate with Taining National Geopark as the main body; (3) Integrate with Taining National Park as the main body. In comparision of the cost-benefit of the three schemes, it can be concluded that: Scheme 3 shows the highest existence and usage value and a moderate cost; Scheme 1 shows a moderate maintenance value and the lowest cost; Scheme 2 shows the lowest value and the highest cost. The research provides ideas and technical support for the optimization and integration of nature reserves at the county and city levels in Fujian province, as well as references for the boundary optimization of nature reserves at home and abroad.
Glaciers are important components of water resources. Due to the limitation of cognition of glacial hydrology and water resources, glacier resources are still not considered in the preparation of water resources balance sheet. In this paper, the glacier water resources balance sheet is constructed based on the compilation of water resources balance sheet in combination of the characteristics of glacier water resources. Result shows that: (1) The assets-liabilities accounting of glacier resources is different from other types of water resources. (2) The glaciers water resources consist of the water quantity assets and the water area assets. The water quantity assets include the glacier ice reserves and the glacier melt water runoff, and the glacier water area assets include the glacier area and the glacier melt water area. (3) Glacier water resources liabilities mainly come from the decline and overconsumption of glacier water resources and the damage of glacier meltwater environment caused by human activities, as well as the consequent decline of glacier water resources services. The upstream area of the great rivers on the Qinghai-Tibet Plateau is the debt region of glacial resources, and its debt benefits the midstream and downstream areas. Therefore, it is necessary to establish a national or downstream-led water resources compensation mechanism. Based on the change in the flow of glacier water resources, the river basin water resources of the Qinghai-Tibet Plateau should be managed comprehensively, and the source area should be appropriately compensated for the loss value of glacier water resources.
At present, the economic transformation of resource-based cities is still a major issue in urban development in China. Based on the core connotation of the economic transformation of resource-based cities, using the ideas and methods of the balanced scorecard and key performance indicators, this paper summarizes the characteristics of economic transformation performance of resource-based cities, and then establishes a new evolution method called "the five-dimensional evaluation method" consisting of "resource dependence, economic level, ecological efficiency, social welfare, innovation driver", selects a few key parameters that can accurately reflect the key processes and results of economic transformation as the evaluation indexes, uses the measurement models such as decoupling analysis, super-efficiency data envelopment analysis, regression analysis, coupling degree model, entropy weight method and canonical correlation analysis, so as to make the results of performance evaluation consistent with the real mechanism of economic transformation. In this paper, seven typical coal cities in Northeast China are taken as cases, and the five-dimensional evaluation method is used to evaluate the performance of economic transformation in these cities since 2003. The results show that, from the perspective of transformation effect, seven cities have initially achieved the transformation of economic growth driving force, among which Liaoyuan has relatively good performance in the development of the secondary industry, and Liaoyuan and Fuxin have relatively good performance in the industrial succession; from the perspective of transformation quality, seven cities have significantly improved the eco-efficiency, among which Liaoyuan, Fuxin and Shuangyashan have improved the relative level of economic development. Empirical test shows that the economic transformation of seven cities does not have enough effect on improving the economic support for social welfare; from the perspective of the degree of realization of the ultimate goal, the level of science and technology and innovation in the seven cities is seriously insufficient, the economic growth slows down, and the ultimate goal of economic transformation is not achieved.
Industrial structural transformation and upgrading is an inevitable path for resource-exhausted cities to realize sustainable development, and researches on measurement of industrial structural transformation and upgrading level in such cities and its influencing factors are important bases of accurate formulation of industrial transformation policies. Based on panel data of 24 resource-exhausted cities in China from 2008 to 2017, conditions of their industrial structural transformations and upgrades are measured from three aspects, namely, direction, velocity and level. In addition, the fixed effect model is adopted to explore influencing factors of industrial structural transformation and upgrading level. The results indicate that: (1) Most of the resource-exhausted cities in China have mainly transformed to the tertiary industry while a small number of cities focus on cultivating the transitional model of multi-industry integration. (2) Compared with the period 2008-2012, the speed of industrial structural transformations and upgrades from 2013 to 2017 was higher, which showed an accelerating trend, but there were differences between regions and cities. (3) Industrial structural transformation and upgrading levels in resource-exhausted cities were on the rise, industrial structures were constantly optimizing and upgrading, and the integral level was lower than the national average level, presenting a spatial pattern of higher in the eastern region, but lower in the central, western and northeastern regions. (4) Total employment, proportion of fiscal expenditures in GDP, total retail sales of consumer goods and proportion of urban population had positive effects on industrial structural transformations and upgrades of resource-exhausted cities, while the total amount of fixed-asset investments had a negative effect on it. The impact of the number of authorized patents is of insignificance.
Housing price dominates the residential location decisions, which in turn, has impacts on travel patterns and travel-related carbon emissions. Therefore, it is important to understand the effects of housing price on carbon emissions from commuting for low-carbon construction. In the paper, a theoretical model of residents' choices, housing price and carbon emissions from commuting is proposed. Then, this paper estimates the effect of housing price on carbon emissions from commuting by Multilevel Model at both individual and street levels based on data from the Jinan residents' travel survey. It is found that carbon emissions from commuting are lower in the central city but higher at outskirts, and housing price has siphon effect on carbon emissions. Specifically, the siphon effect shows that lower housing price in suburban areas leads to long commuting distance and motorization, which causes an increase in carbon emissions. Moreover, the marginal effect of housing on carbon emissions increases slowly within a 5 km distance from city center but rapidly beyond 5 km. Furthermore, we found that wages in suburban areas could moderate the siphon effect. It is easy for the suburban areas with rapid employment growth and higher wage to sustain jobs-housing balance, and less carbon emissions, but the suburban areas with lower wage tend to emit more. Overall, the government should pay attention to the polycentric spatial development, the improvement of the accessibility to work place as well as the transportation facilitation in public rental housing community in the low-carbon construction in the future.
The rapid development of waterfowl industry is inseparable from technological progress. It is very important to examine the evolution law of total factor productivity (TFP) in waterfowl industry and to explore the promotion strategies of TFP in different stages. Based on the survey data and fixed observation point data of the industrial economic team of China waterfowl system, combined with the input and output data of waterfowl industry sorted out in the relevant yearbooks, the paper uses GIS technology to analyze and draws the conclusion that the spatio-temporal evolution characteristics of waterfowl industry in 2010-2018 are "shift from east to west and from north to south". Combined with the perpetual inventory method and Solow residual value, data envelopment analysis DEA-Malmquist is used to estimate TFP of waterfowl industry in 29 provincial-level areas of China. The growth rate and contribution rate of TFP in each of six regions are compared, and then the spatio-temporal evolution law of this period is analyzed. The results show that the growth rate of TFP fell sharply in 2014, rose gradually in 2015, and then grew steadily after 2016. The spatio-temporal growth rate of TFP of waterfowl indutry is summarized. The curve of change presents a "U"-shaped pattern of first falling and then rising. Tobit model is used to examine the influencing factors of the changes. The results show that, affected by H7N9 emergencies, the labor and capital investment in waterfowl industry has changed. The main influencing factors are hydropower and fuel power investment, infrastructure maintenance and new investment, vaccine and epidemic prevention and medical investment. These factors have significant impact on the spatio-temporal changes in waterfowl TFP growth, which further shows that the technical efficiency of waterfowl industry needs to be enhanced, and the risk aversion mechanism should be improved.
The new water resource management policy, such as determining industrial structure by water resources, requires the clarified adaptabilities between water resources and advanced industrial structure for promoting water use efficiencies. To resolve the insufficiency of the existing methods in algebraic expression and economic interpretation, the measurement index of the adaptabilities between water resources and the advanced industrial structure is constructed based on the elasticity. Furthermore, the characteristic, sources and dynamic evolution of the spatio-temporal differences in the study region and its sub-regions are revealed by integrating Dagum's Gini coefficient with Kernel density estimation. Taking the Yangtze River Economic Belt as an example, we can draw the following conclusions. The role of the advanced industrial structure in promoting the efficiencies of water use should be rationally evaluated. The Yangtze River Economic Belt is gradually evolving towards a better degree of adaptation. The spatio-temporal differences of the adaptability in and between the upstream, midstream and downstream regions are major causes for the differences in the economic belt, and the unbalance of the adaptability still exists in the upstream and downstream regions. Finally, we propose some suggestions for promoting water use efficiencies. In addition, it is necessary to identify "false strong adaptation" problems due to the relatively lagging industrial development and low water-demand in some parts of this economic belt, such as Guizhou province.
Grazing systems on the Qinghai-Tibet Plateau are of great ecological and livelihood importance. However, they are now threatened by both climate change and human interference. In order to improve the situation, it is necessary to explore the current status and developing trend of the grazing systems on the plateau. Based on historical statistics, local chronicles and existing literatures, this paper analyzes the historical changes, current situation and future development trend of the pastoral system of Gonghe county from the perspective of the social-ecological system, using Panarchy as the conceptual model. The family livelihood-market subsystem is currently in the stage of steady accumulation of resources, the pasture-livestock subsystem is in the early stage of release, and the social subsystem is in the reorganization stage deviating from the normal trajectory. The deterioration of the pasture-livestock subsystem will have a negative impact on the social subsystems at larger spatial and temporal scales. In the future, more efforts should be made to prevent over-connections between family livestock production and animal husbandry market, maintain equity of benefits in the livestock industry chain, increase the diversification of herders' sources of income, focus on grassland governance, enhance the quantity and quality of grass-roots supervisory teams, encourage cooperatives to optimize herd structure to match grassland, and formulate rational policies to help herders' societies adapt to external changes.
The optimal allocation of sample size of cultivated land quality monitoring has important guiding value for reducing cost and realizing sustainable monitoring and utilization of land resources. Taking Baoji city of Shaanxi province as an example, this study, based on uses cultivated land quality monitoring data in 2018, uses traditional statistics and geostatistical methods to explore the reasonable sample size and uncertainty of soil monitoring indicators in cultivated land quality monitoring. The results show that the relationship between sample variability and sample size is not absolute. The sample representative evaluation method and geostatistical method can effectively reduce the sample uncertainty compared with the Cochran method. The sample representative evaluation method is more applicable, but the research results are lack of stability. The applicability of geostatistical methods has limitations, which can reduce the uncertainty of medium variability indicators, but less applicable to low and high variability indicators. The reasonable sample size should be determined by geostatistics method for medium variability indicators and representative evaluation method for low and high variability indicators.
In this paper, the impact of global climate warming on energy consumption of winter heating was systematically analyzed by using M-K mutation test and linear trend analysis based on the homogenized daily mean temperature derived from 77 meteorological observation stations in Anhui province during 1971-2018. The results showed that in the past 48 years, winter mean temperature showed a significant upward trend, while the beginning date of winter heating was delayed and the ending date advanced obviously. Meanwhile, the length of winter heating had been shortened and heating intensity presented an observably decreasing trend. The abrupt change in winter mean temperature was observed in 1989, and then entered the warming channel. Therefore, the research sequence was divided into the baseline period (1971-1989) and the warming period (1990-2018). Compared with the baseline period, the length of winter heating in the warming period was shortened in spatial consistency, and change range gradually decreased from northeast to southwest, with the maximum over the north of Anhui province and the east of Jiang-Huai region and the minimum over two mountainous areas (Dabie Mountain and the mountainous areas of southern Anhui). The heating intensity decreased on the whole and with a larger decrease in the northern part and a smaller decrease in the southern part. The contribution rates of climate warming on the energy saving for heating in winter were 3.6%-8.9%, with the high value in the north of Anhui, the northern Jiang-Huai region and the eastern Yangtze River Basin, while the low value areas were mainly located in the two mountainous areas.
Taiwan is a representative region of the land reclamation and the intensive human-environment interaction. The study on the reconstruction of the spatial and temporal change of historical farmland in this province can deepen the understanding of the characteristics, differences and rules of the historical land change process on both Taiwan and the mainland. Based on historical literature and statistical yearbooks, this study uses population data to analyze the characteristics of farmland and population records. Then it comprehensively adopts methods such as citation substitution, linear interpolation, occult coefficient correction method and per capita farmland coefficient method to estimate and correct the spatial and temporal changes of historical farmland in Taiwan province in the past 300 years after verifying the surplus food quantity. The results are shown as follows: (1) The total amount of farmland in Taiwan increased from 0.91×10⁴ hm2 in the Dutch occupation period to the current 79.30×10⁴ hm2, up nearly 86.60 times. The stage characteristics generally increased first and then continued to decrease. In the middle and early periods of the Qing Dynasty, it showed steady and low-speed growth. During the Japanese occupation period, it showed rapid fluctuations. Then it experienced a slow fluctuation in the middle and early periods of the Republic of China, and gradually declined in the middle and late periods of the Republic of China. (2) On a 100-year scale, there are significant differences in the rules of change between paddy fields and dry fields in Taiwan; the amount of paddy fields increased first and then gradually decreased after volatility. However, the dry farmland increased first and then decreased and then gradually increased. Before 1931, the proportion of dry farmland was higher than that of paddy fields, and its peak period witnessed 3% to 5% higher; then the proportion of paddy fields exceeded that of dry farmland and was in an advantageous position. The average proportion of paddy fields from 1936 to 1965 was 22.23% higher than that of dry fields. (3) The land reclamation process in Taiwan has represented the imbalance between spatial expansion and regional expansion. Land reclamation experienced the development process from one region to the whole area of Taiwan Island, that is, from the south to the north, and from the west to the east. Tainan was the first region to be reclaimed, followed by Taichung and Taipei districts, and the Taitung region was the last one to be reclaimed. The reclamation intensity in Tainan was higher than that in the rest, with a maximum of 36.71%. (4) The HYDE dataset and the results of this study are gradually increasing, but the difference between the farmland area and the change process is significant. The international dataset does not reflect the objective historical facts of the change of farmland in Taiwan in the past 300 years.