
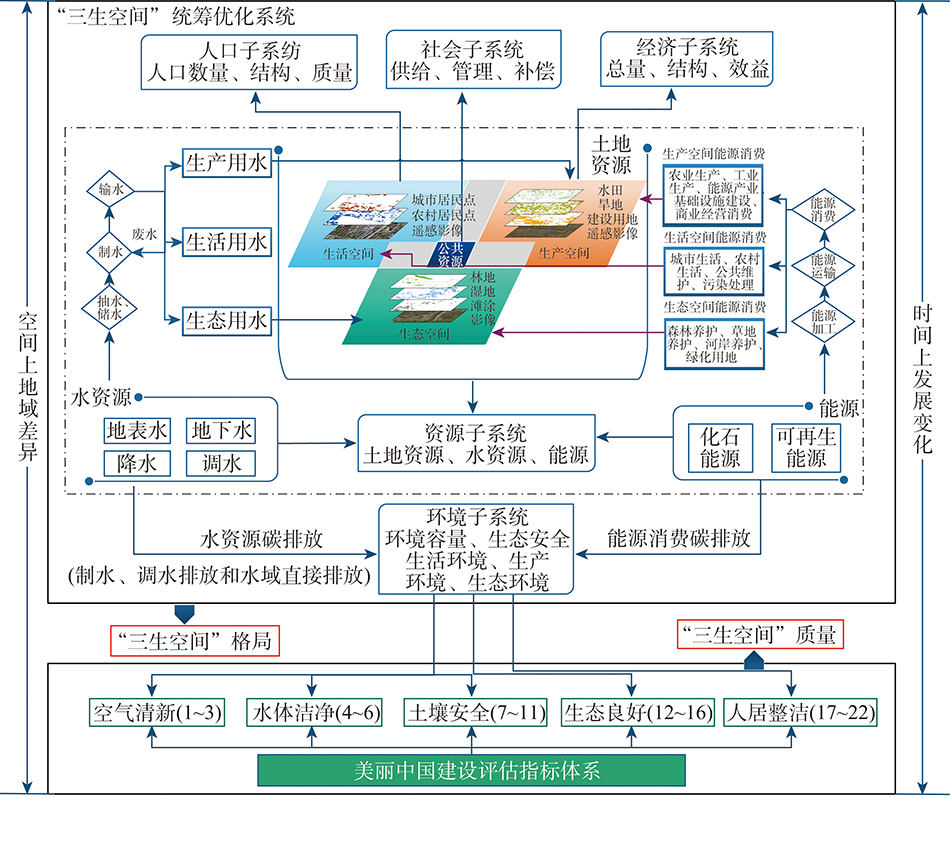
The 18th CPC National Congress in 2012 figured out that the territorial space optimization was the primary task of the ecological civilization construction and to make production space intensive and efficient, living space livable and suitable, ecological space. This study systematically reviews the recent advances for the overall optimization of production space, living space and ecological space (PLES) by the method of literature review and summary induction. It is concluded that the present studies of the overall optimization of PLES were mainly carried out from the perspective of the utilization quality of land space, land suitability evaluation, resource environmental bearing-capacity and comparative advantage. But because of the short of recognition of the scientific intension of PLES and the incompleteness of quantitative identification and classification system construction, there are still problems that the technological approaches of the overall optimization of PLES may still have to overcome. The technological approaches of the overall optimization of PLES should build the theoretical basis and technical system of PLES identification and optimization aiming for Beautiful China Initiative by the theory of human-earth coupled systems. On the theoretical level, the initiative should give full consideration to the mechanism of material and energy transfer within the PLES system and the parsing of the transfer pathway, flow process and metabolic mechanism of water, soil, energy, carbon and other key elements of PLES system by the combination of the resource metabolism theory and the geographical pattern of PLES. On the technological level, it should pay attention to the development and application of the system simulation model and the multi-objective optimization model, and synthetically consider the dynamic mechanism between population, resources, environment and land space elements, and combine the results of evolution rule and the conflict and problem diagnosis of PLES, and consequently to achieve the overall optimization of PLES by the design of different scenarios and parameters.
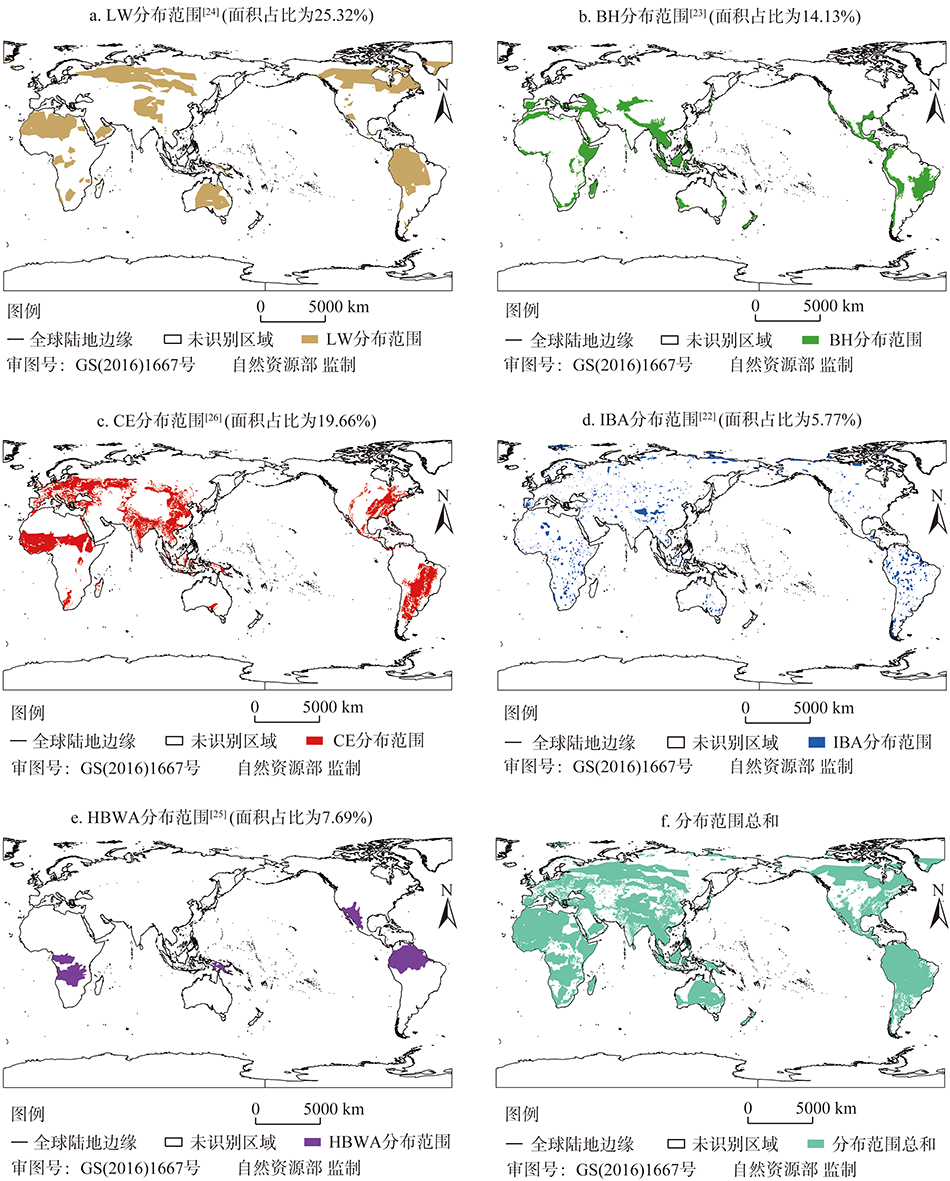
Based on the principle of ecosystem integrity, the establishment of protected areas is the most effective measure for biodiversity conservation. The "Half Earth" target addresses that the global protected area should account for 50% of the total surface area, and 85% of the global species should be effectively protected. We consider the target as a proper goal of the international biodiversity conservation, especially the proportion of species protected. Although there exists a worldwide recognized classification of protected areas developed by International Union for Conservation of Nature (IUCN), such classification cannot exactly tell us the proper locations and distributions of protected areas, and most of the existing protected areas are still the result of subjective judgment and selection. Based on various protection objects and identification criteria, many researchers have defined some conservation priorities around the world in the past few years, all of which could be regarded as valuable examples of scientific identification of protected areas, to provide some efficient references. Through comprehensive comparison and analysis of these conservation priorities, including their protection objects, identification criteria and distributions, this paper draws the following conclusions: (1) Species, habitat integrity and human activities are the main considerations when such conservation priorities were proposed, and the identification criteria include species richness (species abundance), habitat transformation and human activity intensity. Nowadays, with the international focus and research on protected areas going further, the integration of criteria has gradually become a new trend in the identification of protected areas. (2) The consideration of habitat transformation includes two different ideas: "mending for the past", which means that the habitats which have been transformed much should be protected, or "preparing for the future", which means the habitats that still remain original should be protected in case of being transformed, whereas the human activities can be direct or indirect. (3) The distributions of conservation priorities are quite different, with their proportions ranging from 5.77% to 25.32%, and the total distribution area accounts for 55.59% of the global land, exceeding the "Half Earth" target.
Based on the remote sensing monitoring data of land use change/cover in 1990, 2000, 2010 and 2018, using land use transfer matrix, eco-environmental quality index, and ecological contribution ratio of land use transition, this paper analyzes the spatiotemporal features of "Production-Living-Ecological" space structural transformation and eco-environmental effects of land use/cover change in China from 1990 to 2018. On this basis, we identify the main influencing factors of eco-environmental effects and the spatial heterogeneity by using geographically weighted regression model. The results showed that: (1) The production and living space increased, the ecological space decreased, and the overall situation was insufficient from 1990 to 2018 in the whole country. (2) The high-value areas of eco-environmental quality were concentrated to the east of the Hu Huanyong Line during 1990-2018, and mainly in the south and northeast of China. The low-value areas were mainly distributed to the northwest of Hu Huanyong Line. The squeeze of other ecological space and agricultural production space on grassland and woodland ecological space is an important reason for the deterioration of the eco-environment during the study period. (3) Slope, annual precipitation, land use intensity, elevation, topographic relief, population density, and average annual temperature were the main factors influencing eco-environmental quality pattern in China, and the spatial difference of the effect of each factor was obvious. Chinese policies on economic development should take into account the eco-environmental effect of "Production-Living-Ecological" space transformation and influencing factors in the future, and promote the rational distribution of "Production-Living-Ecological" space and the construction of ecological civilization in China.
Forest land has multiple functions. In ecological, production or living priority areas, forest land plays different roles. The traditional forest land classification is difficult to take into account the regional dominant function and development orientation. There is still a lack of quantitative description of the spatial and temporal characteristics of forest land in different functional areas. This paper establishes a forest land classification system based on the perspective of "Production-Living-Ecology". Using land use map, functional zoning, vegetation phenological characteristics and statistical data, through thematic map superposition, remote sensing recognition and decision tree classification technology, various types of forest land are extracted. The results show that from 1990 to 2018, forest land in ecological priority area decreased by 24900 km 2, but decreased slowly after 2000, and that the remote sensing area of forest land in China in 2018 was 2.2818 million km 2. Local forest lands in core ecological functional areas such as wind prevention and sand fixation, water conservation and soil conservation areas were expanded, mainly in some grasslands and sandy areas in Inner Mongolia, Northwest Hebei and the Loess Plateau. In the Northeast Region, Southwest Region and Northern Xinjiang, forest land was converted into cultivated land or grassland. The decrease of forest land in biodiversity reserve was the smallest. The timber land decreased slowly after 2010. The garden land expanded rapidly in the southeast, mainly from timber land and cultivated land. The urban forest land is increasing rapidly in Guangdong, Zhejiang, Jiangsu and Beijing. The study shows that forest land with core ecological function is partially restored in the scope of the ecological restoration project and nature reserve, but the severe man-made disturbance still leads to a large decrease in its overall area. It is suggested that the ecological forest land should be restored and the dominant ecological value should be promoted according to regional differences.
Studying the production pattern and evolution trend of crop and livestock is an important basis for optimizing crop-livestock structure to realize food security. Based on the production data sets of 335 cities in 2000 and 2017, this paper used the theory of comparative advantage to analyze the spatio-temporal evolution of the regional comparative advantages of major crops and livestock products in China. The results showed that: (1) In the past 17 years, there was no significant change in the spatial pattern of regional comparative advantages about crops and livestock products. The regions, which had the comparative advantage of meat, had been spreading. (2) The comparative advantage regions for the feed production (corn and soybeans) did not match the comparative advantage regions for livestock (pigs and poultry), where concentrated feed was mainly consumed. To improve the level of integrated crop-livestock in China, the following suggestions are put forward: rationally adjusting the regional crop-livestock structure; controling the scale of the livestock according to the scale of the regional crops; rationally allocating the distribution of manure fertilizer factories in the spatial pattern; advancing the progress of the technology so as to apply more manure fertilizer and less chemical fertilizer to crops; and strengthening the supervision of manure treatment of livestock factories.
This research analyzed the spatio-temporal distribution characteristics and the affecting factors of PM2.5 and PM10 based on the daily monitoring data in Henan province in 2018, and using statistical methods and Kriging interpolation. The results showed that: (1) The daily and monthly average concentrations of PM2.5 and PM10 showed a U-shaped pattern, and the monthly average of PM2.5/PM10 showed a W-shaped pattern. The seasonal average concentrations and ratio of PM2.5 and PM10 showed the same pattern of winter>autumn> spring> summer. (2) The monthly average concentrations of PM2.5 and PM10 showed different spatial distribution characteristics, and the spatial distribution varied greatly. However, the spatial distribution of annual average concentration of PM10 was similar to that of PM2.5. The seasonal average of PM2.5/PM10 showed different spatial distribution characteristics, which was generally higher in the east and southeast, and lower in the central and western regions. (3) The correlation analysis showed that PM2.5 and PM10 were significantly negatively correlated with NDVI and annual precipitation, and significantly positively correlated with population density and the proportion of secondary industry. The conclusions can provide an important scientific basis for air pollution control and food safety production in grain producing areas.
Since the beginning of the 21st century, China has responded to a national land-system sustainability emergency via an integrated portfolio of large-scale programmes. A series of ecological restoration projects and land regulating and planning policies have been implemented for sustainable development, which substantially improved the security status of the country's ecology. However, comprehensive assessments of the ecological status based on objective data and framework are still limited. Remote sensing-based ecological index (RSEI) has been proposed as an objective and effective approach for assessing ecological security on a regional scale. However, a national scale application has not been conducted yet. Here we generated the annual RSEI products from 2000 to 2019 by using four indicators (Normalized Difference Vegetation Index (NDVI), Normalized Difference Soil Index (NDSI), Wetness Index (Wet), and Land Surface Temperature (LST) based on Moderate Resolution Imaging Spectroradiometer (MODIS) data as well as the Google Earth Engine (GEE)-a cloud computing platform. The results showed that the multi-year average RSEI showed higher values in the southeast coastal regions compared with the northwestern regions, the regions with superior hydrothermal conditions have high RSEI values, while the arid and semi-arid inland areas with higher elevations and cold-dry climates have low RSEI values and fragile ecological conditions. In general, the whole country experienced a significant improvement of RSEI, and all the provincial-level regions in China, except Shanghai, Tibet, and Macao, have shown an increasing RSEI. The three provinces with the fastest growing rates were Shanxi, Shaanxi, and Hebei, with increases of 0.29, 0.25, and 0.19, respectively. The RSEI increased significantly in the Northeast China Plain, Loess Plateau, south and north of the North China Plain, the north of the middle and lower reaches of the Yangtze River Plain, and the south of the Junggar Basin in the northwest desert region, while the RSEI decreased in the Tianshan Mountain range, the southwest of the Qinghai-Tibet Plateau, the central part of the North China Plain and the Yangtze River Delta. This study quantitatively evaluated the macro patterns of RSEI changes based on GEE since 2000, and expecte to support decision making on land use management and ecological protection.
The terrain in Southwest China (SWC) is very complicated, and it is prone to floods and relative geological disasters due to heavy rain. In summer 1998, the SWC precipitation reached a maximum of 709.3 mm, which is around 23.9% above the climate mean. By using a Eulerian model of moisture recycling WAM2layers and big data such as ERA-Interim reanalysis, the precipitation moisture in summer SWC was backtracked. It is found that there are four major source regions for SWC, which are the southwest monsoon region, the westerlies region, the local region, and the southeast monsoon region. They contributed around 330.1 mm, 110.0 mm, 104.8 mm, and 65.6 mm in water depth of SWC in summer 1998, which accounted for 52.2%, 17.4%, 16.6%, and 10.4% of the tracked precipitation moisture, respectively. The southwest monsoon region, from the west Indochina Peninsula to the Indian subcontinent to the Indian Ocean, as the largest moisture source, contributed more than half the precipitation moisture. The extra moisture of the extreme precipitation during summer 1998 came mainly from the southwest monsoon region, the westerlies region, and the local region, contributing about 80.1 mm, 29.3 mm, and 27.1 mm, respectively, above the average moisture contribution, which together accounted for 99.9% of the extra precipitation. The southwest monsoon region dominated the extra moisture contribution once again. Further analyses revealed that the Western Pacific subtropical high (WPSH) stretched to the southwest, forming two anomalous highs in the Northern Bay of Bengal and the South China Sea. This change made moisture transport by the southwest monsoon to SWC extremely strong, which resulted in extreme precipitation in SWC.
Based on the data of land use data and statistics in 2005, 2010 and 2018, this paper explored the spatial and temporal differentiation characteristics and synergy/tradeoff relations of the "Production-Living-Ecological" functions in Shanxi province by using the comprehensive evaluation model and mechanical model. The results revealed that: (1) The spatio-temporal differentiation feature of the "Production-Living-Ecological" function was obvious in Shanxi from 2005 to 2018. The production function value was generally in a state of decline, showing a pattern of "high in the plains and low in the mountains". The living function continued to rise, and its spatial distribution was similar to that of the production function. Meanwhile, the ecological function was on the rise. However, it is necessary to pay attention to the deterioration tendency and its spatial pattern. (2) During the study period, the coupling coordination of Shanxi province was improved and the trend was reasonable. The spatial distribution of coupling coordination had a certain overlap with that of production and living functions. (3) According to the deviation characteristics of the coordination degree of the "Production-Living-Ecological" functions, the function leading areas and required promotion areas were divided, and the functional characteristics of each county in Shanxi was clarified. The results can provide a basis for land spatial planning.
Analyzing the carbon metabolism process of "Production-Living-Ecological" space could contribute to achieving the regional elements integration and structure optimization of "Production-Living-Ecological" space, which could help to strive for green and low carbon development. Taking Zhaotong as an example, this research systematically analyzed the spatial and temporal distribution of carbon metabolism in "Production-Living-Ecological" space from 2010 to 2018 through calculating vertical carbon flux between urban system and atmosphere, and building horizontal carbon flows model between components of the urban system. Besides, ecological network analysis was used to evaluate the comprehensive ecological effects of the "Production-Living-Ecological" space evolution on urban carbon metabolism. The results suggested that: (1) The vertical net carbon flux and the horizontal net carbon flows in Zhaotong from 2010 to 2018 were both negative, which indicated that "Production-Living-Ecological" space evolution had a negative influence on the urban carbon metabolism balance, resulting in an increase in carbon emissions. (2) The main ecological relationship of "Production-Living-Ecological" land in carbon metabolism system was restrictive and predatory relationship. Ecological spaces were occupied by living spaces and production spaces, leading to the imbalance of carbon metabolism. (3) The value of whole ecological utility function J was 0.85 (< 1), showing that the comprehensive effect of "Production-Living-Ecological" space pattern change on urban carbon metabolism was negative. This result was consistent with the inference of net carbon flows calculations. The study results can provide theoretical and data basis for the optimization of land space utilization and low-carbon transition in the study area, as well as decision-making support for the development of "Production-Living-Ecological" space.
With the increase of per capita income and the advancement of urbanization, residents' meat consumption increases. It is of great significance to clarify the change of meat production pattern for sustainable meat supply. Based on the data of meat production at county level in China from 2000 to 2016, this study uses standard deviation ellipse, spatial autocorrelation, geographical detector and other methods to reveal the spatio-temporal evolution of meat production in China and its influencing factors. The results showed that: (1) From 2000 to 2016, the national meat output showed an increasing trend, up by 43.5%. The meat output of different regions showed a great difference. (2) The number of counties with high meat production in China increased significantly, the range expanded, and the barycenter shifted to the north as a whole. The agglomeration characteristics of production were significant and relatively stable, but there were some local differences. (3) Natural resource endowment, socio-economy and agricultural technology all affect the evolution of meat production spatial pattern at different stages. Grain output and value added of the primary industry were the main factors. The influence of the total power of agricultural machinery increased year by year, and the interaction between factors strengthened the effect of spatial differentiation of meat production.
Accurate identification of potential land-use conflicts is conducive to early warning, trade-off and coordination of conflict land, so as to promote the scientific planning of land space. In this paper, based on the revised data of the third national land survey, and assuming that a county should at least have ecological function, productivity and suitability for living (ecological-production-living suitability), we proposed an empirical model to identify and diagnose potential land use conflicts in tourism resorts by taking Hengfeng county with high vegetation coverage as an example. The land-use conflict recognition matrix was used in the research, and it includes five zones at different conflicting levels: zone without conflict, zone with intense conflicts, zone with moderate conflicts, zone with general conflicts, and zone with weak conflicts. The results show that: (1) The spatial distribution and area composition of the "Production-Living-Ecological" suitable land in the study county are significantly different, and there are obvious spatial superimposition and conversion characteristics, which indicates the existence of competitions and conflicts in land use. (2) According to the land-use conflict recognition matrix results, the zone without conflict, zone with intense conflicts, zone with moderate conflicts, zone with general conflicts, and zone with weak conflicts accounted for 64.02%, 9.66%, 17.19%, 1.66%, and 7.48%, respectively. Among them, suitable zone for land use are relatively large, the zones with intense, moderate and general levels are reflected in the conflicts between production and life, which are in the transitional stage of human production, life and ecology. (3) The difference in the spatial distribution and manifestation of various conflict types in the study area determines that the countermeasures for conflict reconciliation must adapt to local conditions and be suitable for land use. In other words, targeted measures should be taken in areas with weak, intense, moderate and general conflicts. The research results can provide a theoretical reference for the evaluation of the "Production-Living-Ecological" suitability of land use in counties with high vegetation coverage, as well as a basis for land space planning in asimilar counties.
Based on "Production-Living-Ecological" space theory, the productive, living and ecological spaces in Wuyuan county were classified based on the 30 m spatial resolution Landsat time-series images. The spatial and temporal characteristics of the three types of spaces were further analyzed. The kernel density estimation method was applied to explore the spatial features for the conversions among three types of spaces. In addition, to further identify the causes of these changes, Redundancy Analysis (RDA) method was applied to attribute the spatiotemporal changes to different socioeconomic factors. Results showed that the two indices, namely, mean area of patches and aggregation index, decreased in both living space and ecological space, while they increased in production space during 2002-2018. We revealed that the fragmentation and dispersion of production space and ecological space was enhanced due to increasing urban area and living spaces, which facilitated the splitting of the continuity of production space and ecological space. From the perspective of changing function, 56% and 44% of the increased living space area was from production space (mainly cropland) and ecological space (mainly forest or grassland), respectively. The living space area showed a significant (P<0.05) increasing trend, the ecological space area showed a non-significant increasing trend; while the production space area showed a significant decreasing trend. All this revealed that the urbanization rate was accelerated by the rapid growth of tourism economy, and the ecological environment improved in Wuyuan county during 2002-2018.
Efficient utilization of urban land is one of the important ways to promote the high-quality development of cities and towns. Taking the panel data of 30 provincial-levels in China during 2009-2016 as samples, a "one-stage" stochastic frontier production function model is used to measure urban land use efficiency. Then, the correlations between efficiency level, inputs, and pollution emission during land use in various regions of China are further analyzed. Results show that: (1) Undesirable output results in a loss of land use efficiency. During the study period, undesirable output causes 3.77%, 7.74%, and 8.77% declines in the eastern, central, and western regions, respectively. (2) Urban land use efficiency shows a significant regional difference. The average efficiency level in the eastern region is the highest, while that in the western region is the lowest. The difference among various regions becomes greater when undesirable output is considered. (3) High input-output level does not necessarily guarantee high efficiency level. A higher pollution emission intensity may cause a greater efficiency loss. The research results help to reveal the focus and direction of the improvement of urban land use efficiency in the future.
Spatial correlation and convergence of the development level of China's water eco-civilization is vital to its coordinated construction. Constructing an evaluation system of water eco-civilization construction, whose dimensions contain water security, water ecology, water environment, water conservation, water supervision and water culture, this paper adopts entropy methods to measure water eco-civilization development index of China and its 31 provincial-level regions from 2010 to 2018, uses exploratory spatial data analysis (ESDA) and space-time transition method to examine the spatio-temporal evolution patterns, and builds spatial panel Durbin model to reveal the spatial convergence. The results are obtained as follows. (1) The development index of China's water eco-civilization is increasing year by year, but water ecology, water supervision and water culture are still the main short boards. There are significant regional differences, showing a pattern of "high-low-medium" from east to west. (2) The development index of China's provincial water eco-civilization shows significant positive spatial spillover effect and spatial pattern locking characteristics. The high-high aggregation areas mainly include eastern coastal regions while the low-low ones mainly include northeast, northwest and southwest of China, and middle reaches of the Yangtze River, and the latter is difficult to realize the transition to HH-type provinces. (3) There exists significant α convergence, absolute β and conditional β convergence in China as well as in its eastern, central and western regions from 2010 to 2018, with the fastest in the eastern region referring to absolute β convergence and the fastest in the central region referring to conditional β convergence, while the western region is the slowest in both types of β convergences. (4) Economic development, population density, human capital and technological progress have significant effects on the convergence of China's water eco-civilization development, but there are obvious regional variations. Specific countermeasures and suggestions are put forward accordingly.
In the era of mass leisure, homestay tourism has become a new driving force for balancing urban and rural development, invigorating the tourism economy, and helping rural revitalization and poverty alleviation. As a special type and manifestation of industrial agglomeration, homestay tourism agglomeration area is an important symbol to measure the development level of homestay tourism. But relevant academic attention is obviously insufficient. Based on the connotation of three elements of L-location, R-resource and D-dynamic, the paper constructs the L-R-D theory of the development of homestay tourism agglomeration. Taking the Yangtze River Delta, where homestay development plays a leading role in China, as a case, this paper mainly analyzes five development models of urban scenic market-oriented mode, suburban leisure market-oriented mode, historic village market-oriented mode, rural aging industry market-oriented mode and rural leisure market-oriented mode. It provides solid support and scientific reference for improving quality and increasing efficiency, and integrating and upgrading in homestay tourism agglomeration areas.
Scenic spot governance is an important part of tourism research. With the development of global integration, the status and role of international tourism organizations in scenic spot governance are gradually highlighted. Taking Huangshan Scenic Spot as an example, based on the theory of path creation and using qualitative research methods such as literature analysis, participatory observation and in-depth interview, this paper constructs an analysis framework of tourism development path creation, and discusses the evolution process and influence of mountain scenic area governance under the background of international tourism organizations. The results show that: (1) The intervention of international tourism organizations has changed the main principal part and structure of scenic spots governance, created a new path for Huangshan Scenic Spot governance, which is an important force to promote the evolution of its governance. (2) From the five dimensions of application subject, action path, scope involved, influence content and intervention effect, Huangshan Scenic Spot experienced three times of path creation after joining the international tourism organization and produced obvious effects. (3) The intervention of international tourism organizations has a significant impact on the internal governance, adjacent communities participation and governance experience output of Huangshan Scenic Spot.
The phenomenon of urban heat island has become a critical environmental issue in many large cities. The trees and vegetation in the urban environment help to cool urban temperatures, whereas previous studies have concentrated on the field observation and factor analysis of cooling effect from urban green spaces in hot summer, but few studies have quantified the spatial coupling relationship between human settlement demand and cooling effect provision. This paper evaluated the cooling effect of urban green spaces in Shanghai based on the high-resolution images and observed results of typical sites, and analyzed theirs space consistencies between cooling effect and air temperature or population distribution with the help of GIS techniques. The results showed that, the green areas of Shanghai reached 104.5 thousand hectares in 2017, and could absorb 8.49×10 15 J of heat via evapotranspiration in summer, implying that the cooling effect saved 1457 million RMB for the electricity consumption of air conditioners. Approximately 46% and 33% of cooling effect were provided by the broad-leaved forest and mixed forest, respectively, and the green spaces in Pudong New Area, and Chongming and Fengxian districts jointly contributed about 67% of cooling effect, whereas the per hectare green spaces in districts of Hongkou, Huangpu and Xuhui presented higher values of cooling effect. Inconsistency, in particular, between cooling effect and air temperature or population density was observed in some parts of Shanghai. Around 28.62% of cooling effect from urban green space was loosely coupled with air temperature, and 7.31% of green spaces generated the low coupling between cooling effect and population density, especially the low coupling areas distributed mainly in the central urban regions. Therefore, we propose to enhance the temperature reduction capacities of urban forest in central district, and import the cooling effect from suburban green spaces through ecological corridors.
The research on divisions of drought risk is vital to reducing drought disasters and increasing grain yield. In this paper, crop water deficit index (CWDI) was used as a drought index in the northwestern Liaoning province. Based on the daily meteorological data from 1965-2019 and the data of maize planting over years, the spatial and temporal evolution of maize drought and the response characteristics of meteorological factors were revealed by mathematical statistics and path analysis. And the drought risk regionalization was carried out by constructing the drought disaster loss model. The results showed that: (1) In the past 54 years, the CWDI of spring maize during the heading-maturation period increased at a rate of 2.2/10 a, and the other growth stages showed a downward trend. And the spatial distribution of drought frequency of spring maize in the study area gradually increased from north to west. (2) Relative humidity and precipitation are negatively correlated with CWDI, while other meteorological factors are positively correlated; among which temperature and relative humidity have direct influence on it. (3) Northwestern Liaoning is divided into four disaster risk areas, and the degree of drought disaster risk shows an increasing trend from north to west. The research results can provide some reference for spring maize field management and disaster prevention and mitigation.