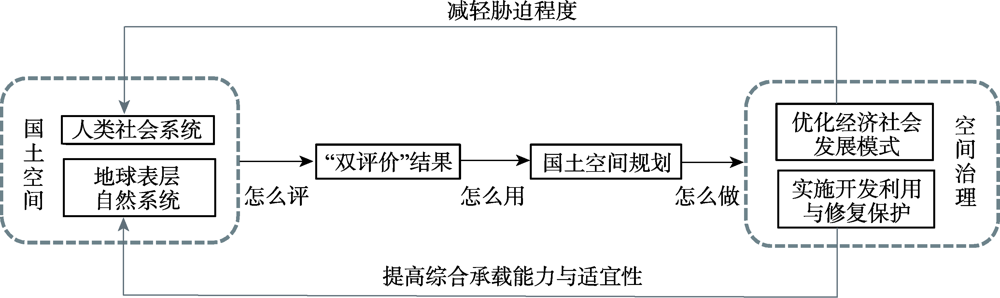
Resources and environment carrying capacity evaluation and spatial development suitability evaluation (referred to as "Double Evaluation") are considered as scientific basis and developing constraints of spatial planning. This paper analyzes and summarizes the "Double Evaluation" work in current spatial planning. The "Double Evaluation" plays an active role, but it has many problems, including insufficient recognition on the scientific nature and internal mechanisms of resources and environment carrying capacity and spatial development suitability, imperfect evaluation methods and application system, and so on. This paper intends to put forward the realistic needs of spatial planning under the concept of ecological civilization. And it is necessary to improve the scientific logic, technical logic and application logic of "Double Evaluation", so that we can improve the scientificity and practicability of "Double Evaluation". At the same time, it should be recognized that essential problems of spatial planning are wicked problems as "Double Evaluation" can only play a limited rational role. We should solve such problems through communication and cooperation so as to avoid falling into the misunderstanding of technical rationality.
Eating habits has always been considered as an important factor in food waste. This paper takes 29 universities, all in different provincial-level regions, as study cases to explore the factors that affect students' wasting behavior. Based on a questionnaire survey of 9192 college students, this paper focuses on the impact of North-South differences on individual food waste behavior, and attempts to answer: Southerners and Northerners, who are more likely to waste food, who waste more food? The results show that compared with the northern native college students, the probability of food waste in the students of the southern region is higher, and the food waste and food waste rate of the students of the southern origins in the college cafeteria are higher than those of the northern students. In order to verify whether the difference in diet patterns between the "rice" model in the south and the "wheat" model in the north is the main reason for the above phenomenon, this paper confirms that the difference between the north and the south diet patterns is the key reason for the fact that the southerners waste more food than the northerners through the mediation effect model. This paper further matches the individual's North-South origin and the North-South position of the colleges and universities. Based on the mode of "Southern students studying in the South", we found that the "Southern tudents going to school in the North" mode has a lower probability of food waste, waste amount and food waste rate. However, under the "Northern students going to school in the South" mode, individuals did not have a low probability of food waste, the weight of waste and food waste rate. Therefore, this paper confirms that the southerners are more wasteful of food than the northerners. And it is proved that the mainstream diet pattern in the north and the south is the leading driving force to the difference in waste.
Five climate models of ISI-MIP were used to simulate and output future climate data under four RCP scenarios, and the scenario data of global warming by 1.5 ℃ and 2.0 ℃ in the future was screened. Based on CERES-Rice model, the trends of rice yield in various regions of China were simulated under the two scenarios, and the relationship between characteristics of future climate change and rice yield were comprehensively analyzed. The results showed that: under the global warming of 1.5 ℃ and 2.0 ℃, the average temperature in China increased by 1.19 ℃ and 1.87 ℃, respectively, and the average precipitation in China increased by 3.07% and 6.17%, respectively, relative to baseline period. Under the global warming of 1.5 ℃, the yield of rice per unit area decreased by 7.49% on average, the area of yield reduction and serious yield reduction accounted for 68.8% and 10.3% of the total rice planting area, respectively. Results showed that the biggest reduction rate was found in double cropping rice planting area of South China, and the biggest increase rate was observed in single cropping rice planting area of Northeast China. Under the global warming of 2.0 ℃, the yield of rice per unit area decreased by 12.02% on average, and the area of yield reduction and serious yield reduction accounted for 70.6% and 18.7% of the total rice planting area. And also, the biggest reduction rate was found in double cropping rice planting area of South China, and the biggest increase rate was observed in single cropping rice planting area of Northwest China.
Central Asia is of great significance for maintaining world food security because of its special geographical location and high grain production capacity. Exploring the potential of grain production in this region will help alleviate the global food crisis. In this paper, the GAEZ method, combined with the FAOSTAT database, is used to quantitatively analyze the potential yield per unit area and potential area of nine grain crops in the five Central Asian countries. And based on the assumption that the production area is a constant, the output per unit area is a constant, while the output per unit area and the production area are changed. In addition, the grain production potential, and the range of development potential in this region are measured. The results show that among the five countries, Kazakhstan has the greatest potential for grain production and development potential. In terms of crop types, wheat has the greatest potential for grain production and development potential, followed by barley; while oats, rye, sorghum, millet and buckwheat have the least grain production and development potential, and are concentrated in Kazakhstan In addition, sorghum has the largest range of development potential in the whole region.
Kazakhstan, which was the granary of the Soviet Union, is a large grain producing country. Research on grain production efficiency can evaluate its grain production potential and grain production level of future, and provide a reference for promoting Sino-Kazakh food cooperation. Based on the inter-state data of Kazakhstan from 2005 to 2017, this paper applied the Three-Stage DEA-Windows method to calculate the country's grain production efficiency in controlling environmental factors, and analyzed its dynamic evolution and regional differences. The results show that after excluding the environmental factors, the grain production efficiency fell sharply except for the northern region, and the average national efficiency dropped from 0.755 to 0.286. The differences in regional grain production efficiency are significant, with 0.857 in the northern part and only 0.112 in the western part, which means that there was much room for the increase of the grain production efficiency. After the adjustment, the grain production efficiency of the whole country and all regions showed an upward trend, but the efficiency gap between the North and other regions was continuing to increase. The changes of grain efficiency of different states in the same region tended to be similar.
Resource industries can lead to over concentration of human capital within resource cities. Emerging industries thus can only find low-skilled employees when entering the city, which may cause labor demand reduction. This study examines whether transformation of resource-based cities affects labor demand. We investigate the impacts of National Plan for Sustainable Development of Resource-based Cities (2013-2020) in China. The impacts of this plan are estimated by combining propensity score matching with the difference-in-differences approach. We also use DDD method based on the cities' education level and rate of manufacture industry to find out the mechanism of the effects. We found that the labor demand of resource-based cities decreased by 6.9% due to urban transformation. Our estimation results also reveal that mature cities and declining cities have the main impacts on labor demand reduction. And the results show that cities with high education level and high rate of manufacture industry are less affected, which proves that the self-improvement mechanism of the resource sectors reduces the local labor demand.
Green environmental efficiency reflects the balance between economic development and resources environment. It is of great practical significance to evaluate the environmental efficiency of resource-based cities comprehensively for promoting high-quality economic development. From the perspective of heterogeneous environmental pollution emissions, this paper selects four environmental pressure indicators, and uses non-radial SBM model and Sequential Malmquist index model to conduct an in-depth analysis of the regional differences and dynamic evolution of environmental efficiency and environmental productivity of 11 cities in Shanxi Province during 2003-2016. Then it adopts the fixed effect model, differential generalized moment estimation model and panel quantile regression model to analyze the impact of environmental regulation on environmental productivity in Shanxi. The results show that: (1) Under the premise of maintaining the existing technology level, the overall environmental efficiency of the study area still has 25.31% potential for improvement; the environmental efficiency value of the central part is higher than that of the northern and southern parts, but the environmental efficiency values of the three regions are declining. (2) The average annual growth rate of environmental productivity is 14.63%. The increase of technical efficiency to environmental productivity shows a "negative effect", and technological progress is the main source of the increase of environmental productivity. (3) There is no linear relationship between environmental regulation and environmental productivity, but there is a significant "U" type relationship. In different quantiles, the impact of environmental regulation on environmental productivity shows significant heterogeneity.
Based on the PSR model, the entropy weight TOPSIS model and the obstacle degree model, taking the restricted development zone of Jilin province as the research area, this paper analyzes the spatial-temporal pattern characteristics and the influencing factors of resources and environment carrying capacity in this province from 2008 to 2016. The results indicate that: (1) During the study period, resources and environment carrying capacity in restricted development zone of Jilin showed a gradual downward trend, and the resources and environment carrying capacity was not high. On the contrary, the variation coefficient of resources and environment carrying capacity in the study area continued to increase, and the difference of resources and environment carrying capacity of each county (city, district) gradually expanded. (2) The spatial differentiation of resources and environment carrying capacity in the restricted development zone is generally widening from west to east. In addition, the pressure index is high in the middle and low in the east and west, and the state index is low in the middle and high on both sides, and the response index east-west spatial differentiation is remarkable, and the difference in the east part is obviously higher than that of the central and western parts. (3) The per capita net income of rural residents, per capita food production, population density, removal rate of COD in industrial wastewater, forest coverage and urbanization rate are the key influencing factors that hinder the improvement of resources and environment carrying capacity in the study area.
With the continuous acceleration of urbanization, human engineering activities have become increasingly strong, and geological environmental problems have become a pivotal factor hindering the development of green cities. Understanding the status of regional geological environment carrying capacity can help to provide effective geological environment control measures and scientifically guide regional development planning. We take Huangshi city in Hubei province as the research area, and build a geological environment carrying capacity evaluation system consisting of 16 evaluation indexes of geological environment, ecological environment and social environment. The FCE (fuzzy comprehensive evaluation) is used to determine the membership degree of each factor. The AHP (analytic hierarchy process) is used to determine the weight of each factor. Finally, the GIS spatial analsis is used to comprehensively evaluate the geological environment carrying capacity of Huangshi city. The research indicates that the geological environment carrying capacity is low in the northeast of the study area, which is mainly restricted by the disaster factors. Therefore, we recommended that disasters should be reduced. The geological environment carrying capacity is low in the southwestern part of Chengui town owing to mining over-exploitation. Thus, we recommended that mining environment restoration project should be carried out. The Southern Yangxin county, which has a high geological environment carrying capacity, can be appropriately developed and utilized. Generally, we should take targeted measures to improve geological environment carrying capacity in different parts of the study area.
With the integration of urban and rural development and the increasing demand of rural households, it is important to improve rural living environments and implement the rural revitalization strategy for the coordination of multifunction of rural settlements. We selected Wangcun town of Shandong province as the study area. This paper, based on the "identification-diagnosis-optimization" logical thinking, builds an evaluation index system of multifunction of rural settlements from the perspective of living-production-ecological function, and uses the spatial auto-correlation, coordination degree and disorder diagnosis model to analyze the spatial pattern, coordination and obstacle factors of multifunction of rural settlements. Then it establishes a promotion and coordination optimization model of multifunction of rural settlements. The results show that: (1) The overall performance of the surveyed rural settlements in Wangcun town is good in production function, average in living function, but poor in ecological function. Different functions have significant spatial heterogeneity. (2) The overall coordination of living-production-ecological function of rural settlements in the town of Wang village is relatively high, but the coordination type is obviously complicated and unbalanced. (3) The living-production-ecological function coordination-obstacle factors of multifunction of rural settlements in Wangcun Town are generally similar and have no barriers in individual villages. Land use intensity, traffic conditions, resource endowment, infrastructure construction and ecological environment are the main obstacles to high-intensity coordination of multifunction of rural settlements. (4) Based on the combination of obstacle factors, the coordination optimization model of multifunction of rural settlements is proposed, which provides a theoretical reference for sustainable rural development.
Currently, China is in a stage of economic and social transformation, with an accelerated restructuring of urban-rural space, the redistribution and reorganization of production factor resources plays an important role in the transformation of rural space by promoting not only dynamic and pattern conversion but also a reconfiguration of functions and values. In the context of urbanization, rural settlements in Suzhou have manifested a diversified development pattern. Many villages have been urbanized, even more than towns. However, other villages have begun to transform towards specialization, such as historical and cultural protected villages, tourism villages, industrial villages, and modern agricultural villages. In light of these facts, rural development in Suzhou presents complex patterns of differentiation and reorganization, which means in the process of globalization, rural localities will not perish, and rural space will retain its diversity and otherness. Multifunctional rural space gives full play to comparative advantage, and the core value belongs to rural territory in urban-rural systems, indicating that the transformation of rural space is not simply a linear substitution of one by another. With rapid urbanization, rural space will not come to end but will become more diversified. Evaluation of multifunctionality on village scale is of importance to revealing differentiated development of rural space transforming from homogeneity to heterogeneity. Taking the exploration on activities variation of behaviour subject in rural space as a new approach, this study originally creates function index of habitat, work and consumption according to the patterns of human mobilities using location-based big data, and conducts an empirical analysis of Luxiang and Zhonganqiao villages mainly consisting of agricultural and ecological land, as well as Jishan and Zhoujing villages where construction land dominates. Results show that villages with similar regional characteristics have different dominant functions considering index change on weekday, weekend and holiday. Luxiang and Zhonganqiao villages are divided into two types: the combination of agriculture and tourism, and the competition of various industries. Jishan and Zhoujing villages are divided as another two types: modern industrial park, and urban community. As an attempt of big data application in rural geography, this study could provide references for classification development proposed in the national strategy of rural vitalization.
Studying the evolution law of cultivated land utilization efficiency is related to agricultural industry revitalization and national food security. This paper, which is based on the calculation of cultivated land utilization efficiency of 12 counties in Nanyang Basin over the 2000, 2010 and 2016 with the DEA-GWR model, investigates characteristics of spatiotemporal evolution of cultivated land utilization efficiency by using trend surface analysis and $G^{*}_{i}$ index and analyzes its influencing factors. The results show that: (1) In 2000, 2010 and 2016, the comprehensive efficiency was on the rise. In 2000 and 2016, the scale efficiency had a greater effect on the comprehensive efficiency. In 2010, the pure technical efficiency had more effect on the comprehensive efficiency. (2) From a global perspective, the high-value areas with comprehensive utilization efficiency of cultivated land changed from the southeast to the middle and northwest in three periods, showing obvious regional differentiation; from a local perspective, relatively high value (low value) areas with comprehensive utilization efficiency of cultivated land show a strong cluster-like agglomeration in space. (3) According to the factors influencing cultivated land utilization efficiency, the absolute value of degree of influence is listed in the order: agricultural labor>multiple cropping index>total power of agricultural machinery>fertilizer application amount>per capita cultivated land>topographical conditions>per capita disposable income of rural residents>urbanization level.
Based on the perspective of urban-rural integration and regional coordinated development, a new evaluation index system for the coupling and development of urbanization and agricultural modernization was constructed. The coupling and coordination relationship between the two regions in the central region of China from 2007 to 2017 was analyzed by using the global principal component analysis and the coupling coordination degree model. The temporal and spatial evolution characteristics were systematically studied. The results show that: (1) During the research period, the new urbanization and agricultural modernization of the provinces continued to grow with a certain degree of fluctuation, but the overall benefits under the two-way interaction were generally low, and economic development was the main force driving the improvement of the two levels. (2) The new urbanization and agricultural modernization in the central region were highly coupled. In 2007-2017, the two systems experienced a transition from "mild imbalance-primary coordination". The coupling and coordination relationship tended to be continuously optimized, and the coordination level presented a spatial pattern of "high in the south and low in the north". (3) The coupling and coordination of new urbanization and agricultural modernization in the central region had some shortcomings. In contrast, the development of new urbanization was slightly lagging behind. Since 2012, under the regulation and guidance of macroeconomic policies, the imbalance of the development of the two systems has gradually weakened, and most provinces have successively achieved simultaneous development at different coordination levels. Mastering the coupling and coordination characteristics of new urbanization and agricultural modernization and the spatio-temporal evolution trend have positive and practical significance for the realization of the rise of the central region and the goal of modernization in the New Era.
Taking three large-scale amusement theme parks in the Yangtze River Delta as cases, this paper analyzed the spatial structure of theme parks' tourist market based on mathematical statistics method and GIS spatial analysis. The method of GeoDetector was used to identity the impact factors and their interactions. The results showed that: (1) The spatial distribution of tourist flow in the Yangtze River Delta theme parks presented an overall pattern of "point-axis radiation in the core area (Yangtze River Delta), planar homogeneity in the peripheral area (provinces bordering the Yangtze River Delta), and dotted distribution in the edge area". The main boundary of tourist flow distribution was established in the delta, and the core market boundary was located in the provincial-level regions (except Shanghai). (2) The spatial distribution characteristics of tourist flow varied in time period and three destinations. The curve of tourism space used in amusement theme parks showed a typical basic feature. In normal times tourists were found in the neighboring region, while on holidays tourists were in the distant region. (3) There was some heterogeneity in the main range and form of tourist flow in the three theme parks. The market domain shape of Happy Valley was similar to that of Dinosaur Park. On the whole, Fangte's market domain was pie-shaped. Eighty percent of the three theme parks' market areas overlapped, and there existed a certain spatial competition among the three theme parks. The rank and status of the cities in which the parks were located affected the distribution pattern of tourists. (4) The influencing factors of the theme parks' tourism market varied in spatial degree and intensity. Economic connection intensity, per capita disposable income of residents and the distance were the leading factors affecting tourist flow, but the leading driving factors in different regions differed significantly. Two influencing factors, bilinear and nonlinear, interacted with each other, which could well explain the spatial distribution of tourist sources.
By means of spatial analysis and econometric models, the spatio-temporal correlation characteristics and effects between PM2.5 pollution and industrial eco-efficiency of prefecture-level cities in China from 2004 to 2016. The results show that: (1) Industrial eco-efficiency and PM2.5 shows a pattern of spatio-temporal staggered distribution. Areas with high PM2.5 pollution are mainly concentrated in the North China Plain and the middle and lower reaches of the Yangtze River, while high industrial eco-efficiency areas are distributed in coastal cities such as the Yangtze River Delta, the Pearl River Delta and the Bohai Rim Economic Zone, and a few major cities in the urban agglomerations of central and western China. (2) There is reciprocal interaction relationship between industrial eco-efficiency and PM2.5 pollution. Industrial eco-efficiency has a negative cumulative effect on PM2.5 pollution, and shows a "U-shaped" pattern, while the influence of PM2.5 pollution on industrial eco-efficiency is manifested by the positive cumulative effect of "inverted U-shaped" change. (3) Industrial eco-efficiency and PM2.5 pollution have significant spatio-temporal association, and the evolution of different types of spatio-temporal correlation keeps higher stability. Thereinto, the high industrial eco-efficiency and the high PM2.5 pollution regions are mainly concentrated in the urban agglomerations of the Beijing-Tianjin-Hebei region, the Shandong Peninsula and the Yangtze River Delta; the low industrial eco-efficiency and the low PM2.5 pollution regions are mainly distributed in the urban agglomerations of the Poyang Lake, the Guanzhong and the western region, as well as in a few cities in the northeast region. (4) Overall, industrial eco-efficiency has a significant and robust positive effect on PM2.5 pollution, but shows significant spatial heterogeneity. Specifically, the industrial agglomeration level, technological innovation and urban greening rates have a significant negative impact on PM2.5 pollution, while the effect of other variables is not significant.
It is important and valuable to reveal the spatial pattern, changing characteristics of nitrogen and phosphorus emissions from agricultural sources and the relationship between them and water environment for rational allocation of investment in agricultural non-point source pollution control and optimization of regional agricultural structure. Based on this understanding, a series of parametric models were established to estimate the agricultural source nitrogen and phosphorus emissions in China from 1990 to 2017. Then, the changing characteristics of nitrogen and phosphorus emissions from agricultural sources were studied from three aspects including total emissions, nitrogen and phosphorus emissions per unit area and migration of emission center, and the relationship between nitrogen and phosphorus emissions from agricultural sources and water environment was revealed through correlation and regression analysis. The study found that the nitrogen and phosphorus emissions from agricultural sources in China were distributed randomly between provinces, indicating that there was no significant interprovincial dependence of nitrogen and phosphorus emissions, which were mainly influenced by internal factors of each province. Throughout the study period, the provinces with the highest annual total nitrogen and phosphorus emissions were Henan, Shandong, Sichuan, Hubei, Hebei, Anhui and Jiangsu provinces. The pattern was relatively stable, but the emission center experienced a reciprocating transfer from east to west and had an overall transfer trend in the northwest direction. Among them, the center of gravity of nitrogen and phosphorus emissions shifted 33.94 km and 52.31 km respectively in the direction of north by west 33.52° and 15.45°. Based on the pattern research and combined with pattern characteristics of spatial dimension and changing characteristics of time dimension, nitrogen and phosphorus emissions of 31 provincial-level regions were divided into 8 categories, namely, high emission growth type, high emission stable type, high emission inverted "U" shape type, medium emission growth type, medium emission inverted "U" shape type, low emission growth type, low emission inverted "U" shape type, and low emission approximate "U" shape type. Furthermore, the water quality data from automatic monitoring stations in 2017 were used to verify the relationship between nitrogen and phosphorus emissions and water environment. The results can be used as the basis for identifying key regions in agricultural non-point source pollution control.
Stormwater management measures can effectively control the runoff volume and rainwater pollutants. This study presented a systematic analysis of the impacts of stormwater management measures on runoff volume and pollutants in order to understand water environmental effects of stormwater management based on a meta-analysis method. A pool of studies identified by a literature search were analyzed to extract the information on the types of stormwater management measures, application scale, rainfall conditions, reduction rate of runoff volume and pollutants and to review the variation of runoff and pollutants under different stormwater management measures. The results of statistical analysis show that: (1) Different types of stormwater management measures generateed different water environment effects (e.g., green roof had the strongest runoff reduction capacity, while permeable pavement had the strongest runoff pollution reduction effect); (2) The impacts of stormwater management measures were scale-sensitive, namely, large areas had lower average rates of runoff reduction and small areas had lower average rates of pollutions reduction; (3) With the increase of rainfall, the capacity of stormwater management measures to reduce runoff and pollutant concentration showed a decreasing trend. Through the systematic analysis of existing cases, the research demonstrated differences in water environmental effects of controlling runoff volume and runoff pollutant, as well as the key factors behind such differences. The results can provide theoretical references for runoff regulation and runoff pollution treatment in stormwater management.
Climate is an important factor affecting plant habitat. It is of great significance to promote the sustainable use of natural resources and predict the impact of climate change on the potential distribution of plants. The potential geographical distribution of Taxus chinensis var. mairei in China was simulated by the maximum entropy model (Maxent), based on 11 environmental variables under three climate scenarios (RCP2.6, RCP4.5 and RCP8.5) in the 2050s. And we discussed the significance of its distribution patterns to the northern boundary of subtropical China. The results showed that AUC=0.950, indicating that Maxent had high accuracy and reliability in prediction of the potential distribution for Taxus chinensis var. mairei. Jackknife test results showed that the main environmental variables affecting the distribution suitability of Taxus chinensis var. mairei. were the precipitation of coldest quarter (bio19), mean diurnal range (bio2), temperature annual range (bio7), mean temperature of warmest quarter (bio10) and altitude (Elev), and the cumulative contribution of >90%. The suitable habitats (P>0.2) of Taxus chinensis var. mairei are mainly distributed in the subtropical and warm temperate monsoon areas of 18°-36°N and 104°-124°E in China, and most of the core habitats (P>0.6) were distributed to the south of Qinling-Daba Mountains. With the increase of greenhouse gas concentrations in the 2050s, the suitable habitats of Taxus chinensis var. mairei increased in RCP2.6 scenario, and decreased in RCP4.5 and RCP8.5 scenarios. With the climate warming in the future, the suitable habitats range of Taxus chinensis var. mairei in RCP2.6 and RCP4.5 scenarios are expanding north- and westward, while shrinking south- and eastward. In the RCP8.5 scenario, the suitable habitats distribution of Taxus chinensis var. mairei are "expanding westward", and "shrinking eastward". With climate change, the centroid of Taxus chinensis var. mairei distribution moved to the northwest under the scenarios of RCP2.6 and RCP4.5, and moved to the southwest in the RCP 8.5 scenario. The distribution of Taxus chinensis var. mairei presents a rising trend as the altitude and the latitude increase in the 2050s, but the migration rate is low and the spread range is small. And the northern boundary of subtropical China will move northward under climate change.
With the deepening understanding of the Scientific Outlook on Development, the coupling coordination degree model has become an effective evaluation and research tool for the regional overall balanced development. However, for this model, there are four types of misuses, including writing errors, coefficients loss, weight misuses and model failures, which have significantly affected the scientific nature of academic research. Therefore, this study firstly clarified the normative formula of the traditional coupling coordination degree model. On the basis of discussing the validity of the traditional model in the field of social science research, this study further proposed a modified model of coupling degree. In addition, the coupling coordination degree model has three reliability issues: the subjectivity of index construction, and the volatility and incomparability of coupling results. Taking the ecological and economic system of the Beijing-Tianjin-Hebei region as an example, we proved that the modified coupling coordination degree model has better validity, and the spatial and temporal changes of the research object will affect the reliability of the coupled coordination model.