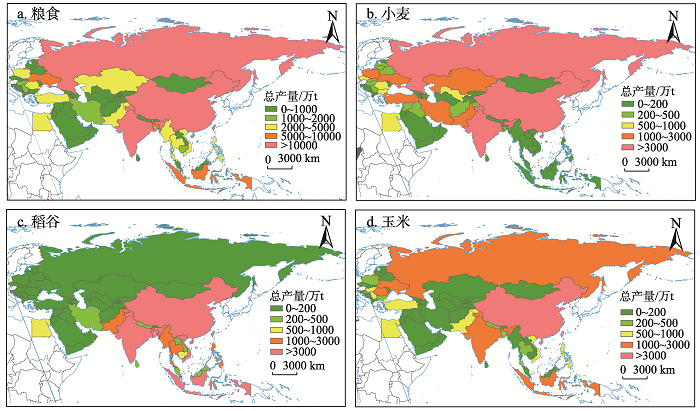
The "Belt and Road" Initiative is the inevitable result of globalization in the new era. As an important strategic resource, food production research is of great significance to regional and global food security. By a quantitative analysis of cereals production, planting area, yield and planting structure, the spatial-temporal patterns and regional differences of countries along the "Belt and Road" were revealed based on time-series data of nearly 40 years. The results showed that: (1) The countries along the "Belt and Road" were important cereals production areas, and the production accounted for 50% to 60% of the world total. A constant growth trend of cereals production was showed during 1977-2016. Per capita cereals production has increased with much difference at country level during 1995-2016, which means the man-grain relationship has been gradually improved and the regional food security has increased. (2) There were obvious regional differences in cereals production in countries along the "Belt and Road", and the spatial pattern was relatively stable. China, India and Russia were high cereals production countries. Cereals production in countries in Southeast and South Asia was generally high, while that in the Arabian Peninsula was relatively low. (3) Rice, wheat and maize were major cereal crops in countries along the "Belt and Road", and rice contributed the most to the total production. The proportions of rice and wheat were relatively stable, but that of maize was increasing. Meanwhile, the regional distribution characteristics of the three major crops were also obvious.
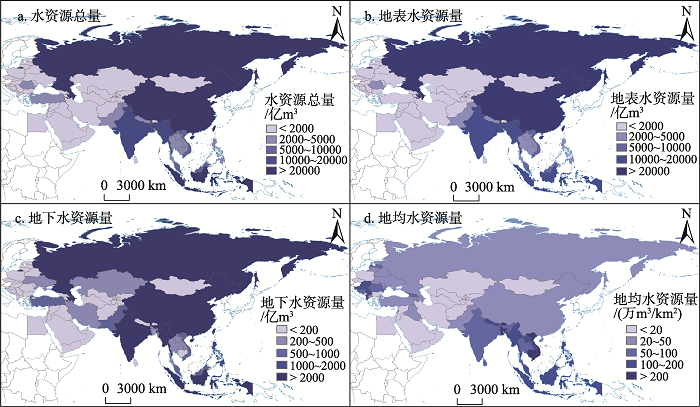
Water resources is the basic strategic resource. It is of great significance to conduct research on water resources of countries along the Belt and Road for promoting the scientific construction of the Belt and Road. Based on the World Bank and the FAO Water Resources Databases, we started from the perspective of water exploitation and utilization, analyzed the natural endowment and utilization status of water resources of countries along the Belt and Road, and further explored the water resources exploitation potential status. The results showed that: (1) In terms of water endowment, the surface water, groundwater and total water resources were relatively high in Russia, China, Southeast Asia and South Asia, while they were relatively low in Central Asia and West Asia. The per capita water resource was relatively high in Central and Eastern Europe, Russia and Southeast Asia, while it was relatively low in West Asia and South Asia. The external water dependency rate was high in the downstream of transboundary rivers, while it was low in the upstream of transboundary rivers and island countries. (2) In terms of water utilization, the water consumption was higher in the east than in the west of the Belt and Road region, the per capita water consumption was the highest in Central Asia and it was low in the surrounding areas. In terms of water use structure, agricultural water was dominant in Asian countries, while industrial water was dominant in Central and Eastern Europe countries. (3) In terms of water resources exploitation potential, the exploitation potential of countries in the Arabian Peninsula was extremely low, and it was extremely high in Central and Eastern Europe and Southeast Asia.
From the perspective of economic transition, the paper analyzes the impact mechanisms of globalization, marketization, decentralization, and other factors on urban land use efficiency, and builds a measurement index system for urban land use efficiency based on the panel data in the Yangtze River Delta Region from 2000 to 2015. Based on this, the super-efficiency DEA model is used to measure urban land use efficiency in each sub-region of the Yangtze River Delta. Then the spatial econometric model is used to demonstrate the impact of globalization, marketization, and decentralization on urban land use efficiency. The results show that: (1) From the perspective of the characteristics of temporal evolution, the urban land use efficiency in the study region presents a two-stage volatility and upward trend. The urban land use efficiency in 2000-2008 shows a relatively obvious upward trend, while in 2009-2015 it shows a tendency of decline followed by a slow rise. (2) There are regional differences of the urban land use efficiency in the delta. The areas with high-value urban land use efficiency are distributed along the "Shanghai-Nanjing-Hangzhou-Ningbo" traffic line, and this spatial feature is relatively stable. (3) From the first phase (2000-2008) to the second phase (2009-2015), the globalization factor has played an increasingly important role in promoting urban land use efficiency in this region; the overall effect of economic marketization factors has been weakened; fiscal decentralization has a significant positive effect on urban land use efficiency in the first phase, while it has a significant negative effect on the efficiency of urban land use in adjacent areas; in the second stage, both effects become insignificant; the process of land finance on urban land use efficiency is somewhat complicated. Specifically, land finance plays an important role in the improvement of land use efficiency in the first stage, but in the second stage, as the capitalization of land is strengthened, land finance is not conducive to the improvement of land use efficiency. (4) Among the control variables, the advanced level of industrial structure has played a significant role in promoting the efficiency of urban land use; the direct impact of population density on urban land use efficiency is also increasingly significant.
Faced with the background of natural resources integration and the more complex land use structure, it is difficult to effectively meet the demand for rational land use planning with a single land use structure optimization method. Considering the objectives of sustainable utilization of land use, ecological civilization, rural development, and urban-rural integration, we constructed an integrated system for land use structure and layout optimization, which will play a positive role in improving the applicability of planning. This study first sets three scenarios of natural evolution, economic priority, and ecological priority, and then uses the MOP model (multi-objective planning model) to calculate the optimal land use structure under different scenarios. Finally, it can carry on land use layout optimization based on the GeoSOS-FLUS model in 2030, Jintan district, Jiangsu province, China. Results show that, by integrating the MOP and GeoSOS-FLUS models and adopting the "Structure + Constraint + Layout + Criterion" approach to optimize the land use structure and layout in the county, it is conducive to optimize the quantitative land use structure and improve the land use spatial distribution; from the results of the case analysis, the area of industrial and mining land in cities and towns has increased by 39% and 95% under the natural evolution and economic efficiency priority scenarios; the forest land has increased by 40% under the eco-efficiency priority scenario; rural settlements decreased by 33%, 66% and 66%, respectively in the three scenarios. Under the three development scenarios, the spatial pattern will face the two-level differentiation of urban space and ecological space. In the later period of regional development, it is necessary to strengthen the coordinated development of urban and rural land use and ecological protection, and promote a balanced spatial distribution.
Land cover/use change (LUCC), which is a focus in global changing study, deeply influences the geographical distribution pattern and productivity of terrestrial ecological system. Normalized differential vegetation index (NDVI), as a key indicator of vegetation productivity, plays an important role in assessing regional vegetation productivity. We selected Ten Tributaries Basin (TTB), where the Yellow River has ten first-level tributaries, to analyze the relationship between the vegetation change trend and LUCC conversion based on the annual data of MODIS NDVI from 2000 to 2015 in the northern part of Ordos, China. Meanwhile, this study employed trend analysis and transfer matrix to analyze the relationships. The results showed that the productivity had an increasing trend totally due to the dominance of grasslands in farming-pastoral region, and areas of significant increase and unsignificant increase account for 22.01% and 67.4% of the total area, respectively. The areas of unsignificant decrease, unchange and significant decrease account for 4.59%, 3.32% and 2.68%, respectively. Land conversion areas in unsignificant increase and significant increase come to 235146.08 hm2 and 82761.76 hm2, respectively. The conversion of grassland to farmland, woodland, water body, construction land and unused land, especially the conversion of grassland to farmland, led to the increase of vegetation productivity in corresponding regions.
Ecological efficiency is an important basis for evaluating the level of regional ecological civilization. It is also a common index and variable for the comprehensive study of resources and environment in geography and economics. The lack of research on the measure of ecological efficiency at the county level has restricted the above-mentioned problems to be researched at the county level. Constructing a scientific path for measuring ecological efficiency at the county level is conducive to accurately identifying the regional economic and social ecological development pattern and providing a possibility for county-level government green performance assessment. Under the national strategy of ecological priority and green development of the Yangtze River economic belt, taking the middle reaches of the Yangtze River as the research area and relying on the multi-source remote sensing data to construct the index system for estimating the ecological efficiency of the county scale, the ecological efficiency of the county area from 2000 to 2015 was calculated by using the non-consensual output EBM super efficiency model, and the GIS spatial analysis tool was used to reveal spatial differences and spatial correlation characteristics. A robust test scheme is designed to test the scientificity and robustness of the county-scale ecoefficiency measurement path. The results show that: (1) The ecological efficiency of the counties under the jurisdiction of Changsha-Zhuzhou-Xiangtan urban agglomeration and Poyang Lake urban agglomeration is better than that of the counties under the jurisdiction of Wuhan urban agglomeration. (2) During the study period, the ecological efficiency of 12 counties and cities such as Wuhan maintained a high level, while that of 7 counties and cities such as Ruichang maintained a low level. (3) The H-H concentration area of ecological efficiency in the early stage is mainly in Hengyang, Zhuzhou and its surrounding areas. By 2015, these areas had disappeared. The L-L agglomeration area of ecological efficiency follows the clockwise trend and gradually forms a closed circular area around the city of Wuhan. (4) The robustness test based on the comparison of city ecological efficiency rankings shows that the measurement path and results of county ecological efficiency constructed in this paper have high reliability.
With the rapid development of social economy and the continuous development of ecological construction, the change of water resources in the Hanjiang River Basin plays an important role in the sustainable development of trans-regional water transfer. Thus, it is worthy to analyze the variation characteristics and influencing factors of extreme precipitation in the Hanjiang River Basin, using the peaks-over-threshold approach, extreme precipitation concentration degree (EPCD) and extreme precipitation concentration period (EPCP). The results show that (1) In terms of the "10-day" scale, the extreme EPCD in the river basin is relatively high, and it shows the distribution characteristics of "high in the west and low in the east", which illustrated that the precipitation is more uniform in the eastern part than in the western. And the EPCD in the lower reaches of Hanjiang River has a decreasing tendency in recent years, which indicated that the precipitation tends to disperse. The annual average value of EPCP in the Hanjiang River is concentrated in late July, and it shows the spatial distribution features of "early in the east, and late in the west", that is, there is earlier arrival of the flood season in the east than in the west. (2) For the monthly scale, the extreme precipitation in the study basin is concentrated in May and September, and extreme precipitation rarely occurs during the period from October of the same year to April of the following year. (3) At the seasonal scale, since the start of the 21st century, the proportion of extreme precipitation in summer in the basin has decreased, and the summer extreme precipitation has mainly changed to spring in the upper reaches, which turned into autumn in the middle and lower reaches of the basin, indicating that summer is the key season that leads to the uneven variation of the extreme precipitation. (4) As for influencing factors, the East Asian summer monsoon and South Asia II have a negative correlation with the extreme precipitation. When the East Asian summer monsoon and South Asia II are strong, the extreme precipitation in the whole river basin decreases. However, when the East Asian monsoon and South Asia II are weak, the correlations with extreme precipitation present spatial difference. The weaker the East Asian monsoon, the increase of extreme precipitation varies from north to south, while in South Asia region II, the increase of extreme precipitation varies from east to west.
Eco-tourism in Mt. Jade Dragon heated up these years, which had an impact on the environment and vegetation resources in the region. Understanding the ecosystem degradation under disturbance is vital to policy making for ecological protection and sustainable development. In order to clarify the anthropic influence on the alpine meadow ecosystem, the typical alpine meadow area in Mt. Jade Dragon was selected as the study area; with field investigation and sampling during 2012-2016, we analyzed the degradation pattern of alpine meadow, and confirmed grazing and tourism as the key drivers for meadow degradation. The disturbance model was built to quantize disturbance intensity, and variation partitioning was used to determine the contribution of grazing and tourism to meadow degradation in the study area. The results showed that: (1) Half of the study area was disturbed by yak grazing and 70% area by tourism, and the grazing center mainly concentrated near livestock drinking points, while tourist noised around Viewing Deck and the Temple. We found that grazing and tourist activities matched with the trail system, the trail layout and tourists behavior mode account for the disturbance pattern. (2) Meadow degraded with the increase of disturbance intensity, the severe meadow degradation region overlapped with the highest disturbance intensity area. (3) Although there are grazing center area and tourist focus area, tourism, instead of grazing, has become the main disturbance driver in the study area. On the whole, tourism contributed more to the meadow degradation, and the future will remain so. Therefore, to reduce the impact of tourism on alpine meadows in Mt. Jade Dragon, informal trails of high frequency use can be fixed to formal artificial trail, vegetation and soil along the low usage informal trails can be recovered or regenerated.
The coordination of interests among stakeholders in water resources management for trans-boundary rivers remains to be a challenge. Taking the Taipu River, a typical trans-boundary river in the Taihu Lake Basin, as an example, this paper analyzed the interest demands of stakeholders for water resources protection in the upstream and downstream regions of the Taipu River. Based on the game theory, this paper introduced both external driving forces (Watershed Agency Intervention and Incentive and Restraint Policies) and internal equilibrium measures (Ecological Compensation and Sectional Water Quality Assessment) to explore a cooperation mechanism that can mitigate the conflicts and encourage cooperation between the upstream and downstream regions. The results show that: (1) The game cooperative strategy (Reaching Standard, Compensation) is realized in the game model with the coordination methods. (2) Based on the results of game analysis, the realization of the game strategy (Reaching Standard, Compensation) is closely related to the strength of incentives and constraints, the amount of compensation, water rights, upstream protection costs and benefits. (3) The external driving forces can help to coordinate the function orientation difference of upstream and downstream demands of the Taipu River, and to create the enthusiasm and initiative of protection cooperation of the upstream and downstream regions. The internal equilibrium measures can compensate for the loss of upstream water rights and industrial development interests, making the water quality of the Taipu River to meet the safety standard of the downstream water intake. (4) The coordination mechanism of the water resources protection for the Taipu River was constructed, which provides theoretical and decision-making support to accelerate the coordinated development of the Yangtze River Delta and establish a Clean Water Corridor in the Taihu Lake Basin.
Forest resources are important natural resources. Preparing the forest resources balance sheet helps integrate forest resource management into the ecological civilization performance appraisal system, and it will be greatly significant to sustainable and ecological security. Based on analyzing the current research of forest resources accounting and natural resources balance sheet, the paper takes the forest resources balance sheet as an information system which serves government's forest resources administration. On the basis of this objective, an accounting system of forest resources balance sheet is built by combining the theory and methods of financial accounting with the characteristics of China's forest resources management. For preparing forest resources balance sheet, the paper defines forest resources assets, forest resources liabilities, and forest resources net equity as the three accounting elements, and sets accounts for the three accounting elements. The forest resources liabilities mainly account for the unfinished statutory responsibilities and the unfinished bottom line targets in forest resource management of reporting entity. Then, the paper designs the statement form of forest resources balance sheet according to the relationship of assets equal equity, which composes a reporting system with statement of changes in forest resources assets, statement of changes in forest resources liabilities and net equity. Further, the paper puts forward the dynamic accounting process based on forest resources inventory data and forest resources change information, and the accounting method based on double-entry accounting. By this accounting system, it could achieve the goal of preparing forest resources balance sheet every year.
This study, based on a strong sustainability paradigm guided by ecological economics and sustainable development theory, aims at measuring the ecological civilization construction performance of China during 2006-2015 by means of two-stage network Super-EBM model from the perspective of overall well-being, and then an international comparison among 42 countries in 2014 is conducted accordingly. The employment of two-stage network DEA model is to open the "black box" during the ecological well-being transformation process. Thus, the ecological civilization construction performance is divided into two parts, namely ecological economy efficiency and economy well-being efficiency. The empirical results indicate that: (1) The overall efficiency of China during 2006-2015 is 0.986, which is at a relatively low level, and no single one of the ten DMUs performs efficiently in terms of the DEA efficiency value, while the overall efficiency is getting better during the 12th Five-Year Plan period (2011-2015). At the global level, Switzerland (1.647), Indonesia (1.365) and Ireland (1.039) ranked top three in terms of overall efficiency among 42 countries in 2014, while China (0.297) ranked the last but one with a very low efficiency. In addition, there are great differences between countries, showing a trend characterized by "OECD countries (0.677) rank top, G20 countries (0.611) rank second and BRICS countries (0.417) the last". (2) According to the efficiency of each stage, the ecological economy efficiency in the first stage is apparently lower than the economy well-being efficiency in the second stage, and the relatively low ecological economy efficiency mainly contributes to the low performance of ecological civilization construction at the whole level. (3) The two-stage network Super-EBM model with the consideration of both radial and slacks issues can provide more accurate and near-factual result when compared to the traditional DEA models. Besides, the network Super-EBM model enjoys a good reference on efficiency or performance assessment in other similar fields that involve two or more stages. Finally, some specific suggestions are proposed in accordance with the aforementioned conclusions.
Taking the first two batches of characteristic towns in the China as an example, comprehensively using the spatial analysis methods, such as the nearest index, geographic concentration index, imbalance index, nuclear density, and geographical contact rate, this paper analyzes the spatial distribution of characteristic towns in the country. On this basis, it puts forward the industrial characteristics and development suggestions. The main conclusions can be drawn as follows: The distribution of characteristic towns in China is characterized by "agglomeration in general, relying on economy, along the line, besieging the city and near scenery". From the perspective of spatial distribution type, the characteristic towns are mainly distributed in the eastern region, and southeast of the demarcation line, which shows a trend of concentration pattern. From the perspective of spatial distribution equilibrium, the characteristic towns show an unbalanced pattern, and the concentration ratio is high. From the perspective of spatial distribution density, they present a pattern of more in the east while fewer in the west, more in the south while fewer in the north, as well as more in the southeast while few in the northwest. Generally speaking, there are five major agglomeration areas: the Bohai Rim, the Yangtze River Delta, the southeast coastal region, the Chengdu and Chongqing in the southwest, and the Central Plains. The spatial distribution of the characteristic towns is the result of the comprehensive role of regional economy, location transportation, core city and tourism resources under the policy guidance. The first two batches of characteristic towns are mainly dominated by agriculture and industry, and the industrial characteristics need further improvement. According to the results, we put forward some suggestions for future development of characteristic towns from rule of law, policy guidance, industry guidance and elements matching.
Assessment of sustainability is an important part of sustainable scientific research. Based on HDI and HSDI, this paper constructed the weak Human Sustainable Development Index (HSDI) and strong HSDI assessment indexes with different emphases on environmental factors. Taking the Bohai Rim region in China as an example, we studied the basic state and change process of the regional sustainability from 2000 to 2015. The results are shown as follows. From the point of basic state, the hierarchy of the sustainability in the Bohai Rim was imbalanced. The level of weak HSDI and strong HSDI were both in a spindle-shaped structure with small proportions at both ends and a large proportion in the middle. The numbers of cities with weak HSDI and strong HSDI at middle level account for 59.09% and 43.18%, respectively. However, the hierarchy of weak HSDI was more imbalanced than that of strong HSDI, and the regional differences of weak and strong HSDI were obvious. In terms of the change process, the paces of the sustainable development in different cities were inconsistent. Although both the weak and strong HSDI presented a significant growth trend, the weak HSDI mainly showed medium-high speed growth, while the strong HSDI mainly showed medium-low speed growth. The coincidence rate of weak HSDI and strong HSDI growth areas is as high as 71.79%, but there is obvious spatial dislocation in the growth rate. Based on the assessment results, cities can be classified into sustainable development state and process matrix. The cities in the four state matrices (I, II, III and IV) of sustainability were suitable for "incentive", "propelled", "control-oriented" and "supportive" sustainable development strategies successively. And the cities in the four process matrices (1, 2, 3, and 4) were suitable for sustainable development strategies of "stabilizing growth and optimizing environment", "conquering emphasis and promoting coordination", "adjusting structure and preventing risks" and "promoting reform, seeking development" successively. This study can provide decision-making reference for promoting regional sustainable development by proposing targeted diversification strategies.
To determine the effect of management intensity on runoff nutrient losses in bamboo forests under natural rainfall conditions, separate field observation stations were set up at the mouths of each field-sized catchment (micro-watershed) in extensively or intensively managed areas, at Qingshan Bamboo Orchard in Lin'an district, Hangzhou city, Zhejiang province. After every successive rainfall during the year, runoff volumes were measured, and water samples from the sand-settling tanks at the observation stations were collected and analyzed for total nitrogen (TN), total phosphorus (TP), nitrate nitrogen (NO3--N), ammonium nitrogen (NH4+-N), and phosphate (PO43-) contents. Simultaneously, soil samples were also collected and analyzed for pH, organic matter, effective nitrogen and available phosphorus contents. The results showed that: (1) Annual runoffs from intensively managed and extensively managed bamboo forests were 8086.52 m3/hm2 and 4850.95 m3/hm2, respectively; (2) Nitrogen loss in runoff from the bamboo forests was dominated by nitrate nitrogen; (3) Intensive management increased the risk of nutrient losses from the bamboo forests; the annual losses of nitrogen and phosphorus from intensively managed areas were 45.26 kg/hm2 and 25.05 kg/hm2, respectively; but they were only 0.31 kg/hm2 and 0.21 kg/hm2, respectively, from extensively managed area. Compared with losses from extensively managed area, the losses of nitrogen and phosphorus from intensively managed area increased by 80.68% and 47.62%, respectively; (4) The TN content in runoff water had a significant negative correlation with alkali-hydrolyzed nitrogen content of the soil, while the TP content in runoff water had a significant positive correlation with soil available phosphorus.
Stable isotope technique is widely used to study the source of water vapor during water cycle, the supply relationship and water balance among different waters. From April 2016 to April 2017, the thesis selects three different sites in the Mount Lu area (Lianhua Town lies to the west of Mount Lu, Guling Town at the top of hill, and Haihui Town to the east of Mount Lu). Based on the isotopic data of 102 precipitation samples collected from the three places, we used linear regression analysis and comparative analysis to explore the temporal and spatial characteristics of hydrogen and oxygen stable isotopes and deuterium excess in precipitation in the Mount Lu area and their influencing factors. The results show that: In the study area, the stable isotope value of δ18O in summer precipitation was lighter than that in winter. The seasonal difference of water vapor source is obvious. The deuterium excess also showed a significant seasonal difference, and the deuterium excess value was higher than that in most parts of the world, being 10.0‰. Compared with the global meteoritic water line (GMWL) δD=8δ18O+10, the slope and intercept of the local meteoritic water line (LMWL) δD=7.45δ18O +8.36 are smaller in the Mount Lu area than in the global meteoritic water line (GMWL) δD= 8δ18O+10. Based on the HYSPLIT model, the atmospheric water vapor in this region is mainly derived from the South China Sea and the Indian Ocean at low latitudes in summer, and the dry inland in North and Northwest China in winter. The influence of local water vapor and geographical location differences lead to the spatial differences of rainfall isotopic characteristics. This study provides a scientific basis for the future study of water cycle in Mount Lu area.
Homestead withdrawal is an important means to effectively alleviate the contradiction between urban and rural construction land and promote the rural revitalization. On the basis of sorting out the path of paid withdrawal of homestead, this paper constructs the value compensation system of homestead. In accordance with the principles of affordability of government, acceptability of peasant households and sustainability of work, the effective compensation threshold of voluntary paid exit of homestead in different modes is scientifically determined based on cost-benefit theory. The results show that: (1) The compensation threshold of paid exit of homestead is the compensation range consisting of the minimum acceptable value for peasant households and the maximum acceptable value for the government; (2) When the sum of opportunity cost and total cost of homestead exit is less than the minimum threshold, peasant households are willing to accept homestead exit, and the maximum threshold is lower than the sum of the value of homestead and ground ancillary facilities and total cost of homestead exit; (3) In the mode of "transformation in different places", where the government plays a leading role and there are fewer sources of funds, the actual compensation amount is close to the minimum threshold. In the mode of "one family but several houses", where the demands of the government are equal to that of the peasant households, the compensation amount is biased to the median. In the mode of "overall relocation" and "community" modes, where farmers play a leading role and there are more sources of compensation funds from the government, the actual compensation amount tends to the maximum threshold.
A long time series of the Ayakekumu Lake level change has been compiled by combination of the T/P, RA-2 and Hydroweb data. In addition, we assessed changing index of the Ayakekumu Lake during 1995-2015 based on Landsat images. The results showed that, the Ayakekumu Lake area and level increased continuously during the observation period, the area of lake increased from 624 km2 in 1995 to 995 km2 in 2015, and water level increased by 5 m in total in the period of 1995-2015. Meanwhile, the air temperature had risen, and the area of glaciers retreated from 361.27 km2 in 1994 to 345.26 km2 in 2016. We concluded that the water volume change was related with climate factors, and the main factor was warm-wet climate. Additionally, atmosphere warning led to water level increase due to glaciers melting. The water volume changing in Ayakekumu Lake could be affected by the increasing precipitation as well as dropping evaporation. Some factors are likely to affect lake expansion, including permafrost melting and precipitation at high altitudes. In sum, accurate measurements of lake ice and water levels are critical for understanding the water resource balance and hydrologic cycle in arid or semi-arid regions of China.
Setting up a suitable quantitative analysis model is a basic work for scientific grasp of cultivated land utilization efficiency and its distribution pattern, and can provide reasonable decision-making basis for sustainable utilization of cultivated land then realizing the coordinated development of cultivated resources and environment. In order to effectively describe the complexity, dynamics and heterogeneity characteristics of cultivated land use system, a random forest (RF) model for measuring cultivated land utilization efficiency is constructed by applying random sampling Bootstrap to build a classification tree reasonably. Then by taking 172 cities in the major grain producing areas of China as an example, the RF model was trained to measure the cultivated land utilization efficiency in 2003-2015 compared with Back Propagation Neural Network and Entropy weight to verify the consistency, representative and superiority of RF. The results show that: (1) RF model has fewer parameters and simpler implementation. It can simulate the complex relations among the evaluation indexes, which makes it convenient to analyze the value of each index. (2) For efficiency measurement results of the same space unit, RF > BPNN > EW, the overall distribution pattern of the cultivated land utilization efficiency in RF and BPNN is similar while a great difference exists in EW. (3) Judged from the matching degree of evaluation results to reality and the accuracy parameters, the measurement results are reasonable and in accordance with the facts in RF, which reflected its high applicability and reliability. At the same time, compared with the other two commonly used models, RF can reduce the dimensions of input vectors and the computing complexity, then raise the training efficiency. The correlation coefficient R of RF is 0.8685, MRPD is 2.3533, with the minimum MMSE and MMAE being 0.0174 and 0.0211, respectively, which is more suitable for the study of the cultivated land utilization efficiency with complex nonlinear characteristics, and this method has explored a new way for evaluating cultivated land utilization efficiency.