 PDF(2043 KB)

华北地区颗粒物浓度时空分布特征及其因素
詹建益, 黄观超, 周华, 段文松, 吴安安, 王文洁, 李婷
自然资源学报 ›› 2021, Vol. 36 ›› Issue (4) : 1036-1046.
PDF(2043 KB)
PDF(2043 KB)
华北地区颗粒物浓度时空分布特征及其因素
Spatial and temporal distribution characteristics and factors of particulate matter concentration in North China
 ({{custom_author.role_en}}), {{javascript:window.custom_author_en_index++;}}
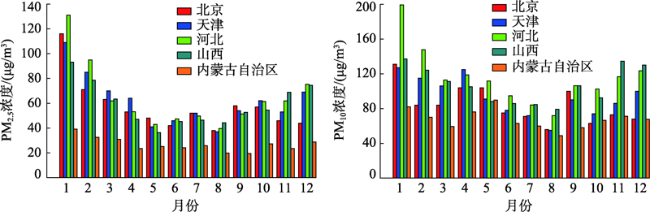
利用2017年华北地区各地级及以上城市空气质量浓度等有关数据,对该区域内的颗粒物浓度时空分布特征进行研究,在此基础上进一步利用空间自相关分析方法对该区域内的颗粒物浓度的空间聚集特征进行定量描述,并利用空间计量模型分析了影响华北地区城市颗粒物浓度的因素。结果表明:整体上,华北地区PM2.5和PM10的污染日出现的平均频率分别为17.25%和14.23%,需重点关注细颗粒物造成的污染。在时间分布上,各省市的颗粒物月均浓度存在“U”型变化,呈现出冬季>秋季≈春季>夏季的规律。在空间分布上,各地级市颗粒物年均浓度具有明显的空间聚集特性,高聚集主要出现在河北南部,低聚集主要出现在内蒙古。空间计量模型表明,风速、降雨量和人均GDP对华北地区城市的PM2.5和PM10年均浓度均具有显著的负向影响,而第二产业占比、煤炭使用量和机动车保有量均对颗粒物浓度有正向影响,其中煤炭消耗量的影响最大,其次是机动车保有量。上述研究结果可为制定华北地区大气污染控制提供有效的措施和科学依据。
Based on the data of air quality concentration of cities in North China in 2017, the spatial and temporal distribution characteristics of particle concentration in this region are studied. On this basis, the spatial autocorrelation analysis method is used to quantitatively describe the spatial aggregation characteristics of particle concentration in the region, and the spatial measurement model is used to analyze the particle concentration affected cities in North China. The results show that: on the whole, the average frequency of PM2.5 and PM10 pollution is 17.25% and 14.23% respectively in the study area. In terms of temporal distribution, there is a "U"-shaped change in the monthly average concentration of particulate matter in all provinces and cities, the average concentration has obvious seasonal changes, showing a pattern of winter > autumn ≈ spring > summer. In terms of spatial distribution, the annual average concentration of particulate matter in different prefecture-level cities has obvious aggregation characteristics. The high concentration mainly occurs in the south of Hebei province, while the low concentration mainly appears in Inner Mongolia. The spatial econometric model shows that wind speed, rainfall and GDP per capita have a significant negative impact on the average annual concentration of PM2.5 and PM10 of cities in North China, while the proportion of secondary industry, coal use and the number of vehicles have a positive impact on the concentration of particulate matter, among which coal consumption has the largest impact, followed by the number of vehicles. The above results can provide scientific basis for formulating policies for air pollution control in North China.
华北地区 / 颗粒物浓度 / 时空分布 / 空间自相关 / 空间计量模型 {{custom_keyword}} /
North China / particulate matter concentration / spatial and temporal distribution / spatial autocorrelation / spatial econometric model {{custom_keyword}} /
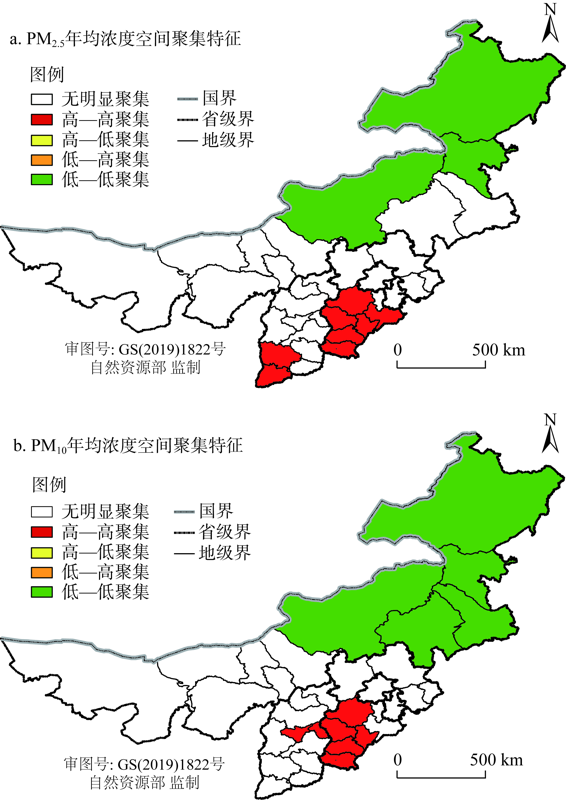
图3 2017年华北地区颗粒物年均浓度空间聚集特征Fig. 3 Spatial aggregation characteristics of annual average particulate concentration in North China in 2017 |
表1 2017年华北地区颗粒物年均浓度空间自相关分析结果Table 1 Spatial autocorrelation analysis of annual mean particulate matter concentration in North China in 2017 |
| 指标 | Moran's Ⅰ | z得分 | P值 |
|---|---|---|---|
| PM2.5 | 0.36 | 8.32 | 0.00 |
| PM10 | 0.33 | 7.63 | 0.00 |
表2 影响2017年华北地区PM2.5浓度差异的因素Table 2 Factors influencing the difference of PM2.5 concentration in North China in 2017 |
| 变量 | 模型1:OLS | 模型2:SLM | |||||
|---|---|---|---|---|---|---|---|
| B | T统计量 | P值 | B | Z统计量 | P值 | ||
| 风速 | -9.08* | -2.31 | 0.03 | -6.45* | -2.11 | 0.04 | |
| 降雨量 | -0.06 | -2.02 | 0.05 | -0.05** | -2.63 | 0.01 | |
| 人均GDP(ln) | -10.97* | -2.71 | 0.01 | -7.95* | -2.52 | 0.01 | |
| 工业产业占比 | 0.61* | 2.49 | 0.02 | 0.47* | 2.54 | 0.01 | |
| 城市化率 | -0.29* | -2.72 | 0.03 | -0.06 | -0.60 | 0.49 | |
| 森林覆盖率 | -0.21 | -0.89 | 0.38 | -0.18 | -0.99 | 0.32 | |
| 机动车保有量(ln) | 10.29** | 3.16 | 0.00 | 8.20** | 3.24 | 0.00 | |
| 煤炭消耗量(ln) | 9.61* | 2.47 | 0.02 | 8.92** | 2.99 | 0.00 | |
| 常数 | 82.90 | 1.88 | 0.07 | 17.03 | 0.47 | 0.64 | |
| R2 | 0.66 | 0.85 | |||||
| Log likelihood | — | -128.97 | |||||
| 注:*、**分别表示P<0.05、P<0.01。 |
表3 影响2017年华北地区PM10浓度差异的因素Table 3 Factors influencing the difference of PM10 concentration in North China in 2017 |
| 变量 | 模型1:OLS | 模型2:SLM | |||||
|---|---|---|---|---|---|---|---|
| B | T统计量 | P值 | B | Z统计量 | P值 | ||
| 风速 | -9.89* | -2.26 | 0.03 | -6.06* | -1.95 | 0.03 | |
| 降雨量 | -0.07 | -1.95 | 0.06 | -0.08** | -3.12 | 0.00 | |
| 人均GDP(ln) | -15.94** | -3.17 | 0.00 | -13.18** | -3.18 | 0.00 | |
| 工业产业占比 | 1.07*** | 3.92 | 0.00 | 1.06*** | 4.67 | 0.00 | |
| 城市化率 | -0.58* | -2.43 | 0.02 | -0.47* | -2.30 | 0.02 | |
| 森林覆盖率 | -0.32 | -0.95 | 0.40 | -0.21 | -1.02 | 0.39 | |
| 机动车保有量(ln) | 8.99* | 2.38 | 0.02 | 8.61** | 2.74 | 0.01 | |
| 煤炭消耗量(ln) | 11.09* | 2.26 | 0.03 | 9.73* | 2.36 | 0.02 | |
| 常数 | 15.43 | 0.41 | 0.68 | -55.59 | -1.37 | 0.17 | |
| R2 | 0.68 | 0.88 | |||||
| Log likelihood | — | -141.01 | |||||
| 注:*、**、***分别表示P<0.05、P<0.01、P<0.001。 |
表4 基于OLS回归的拉格朗日乘子检验Table 4 Lagrange multiplier test based on OLS regression |
| 检验 | PM2.5 | PM10 | |||
|---|---|---|---|---|---|
| 统计值 | P值 | 统计值 | P值 | ||
| 拉格朗日乘子(滞后) | 16.80 | 0.00 | 6.07 | 0.01 | |
| 稳健性拉格朗日乘子(滞后) | 17.21 | 0.00 | 9.07 | 0.00 | |
| 拉格朗日乘子(误差) | 1.78 | 0.18 | 0.00 | 0.95 | |
| 稳健性拉格朗日乘子(误差) | 2.19 | 0.14 | 3.00 | 0.08 | |
| [1] |
殷永文, 程金平, 段玉森, 等. 上海市霾期间PM2.5、PM10污染与呼吸科、儿呼吸科门诊人数的相关分析. 环境科学, 2011,32(7):1894-1898.
[
{{custom_citation.content}}
{{custom_citation.annotation}}
|
| [2] |
{{custom_citation.content}}
{{custom_citation.annotation}}
|
| [3] |
杨帆, 周亮, 林蔚, 等. 2001—2010年非洲大气PM2.5污染浓度空间格局演化. 世界地理研究, 2016,25(3):30-39.
[
{{custom_citation.content}}
{{custom_citation.annotation}}
|
| [4] |
杨冕, 王银. 长江经济带PM2.5时空特征及影响因素研究. 中国人口·资源与环境, 2017,27(1):91-100.
[
{{custom_citation.content}}
{{custom_citation.annotation}}
|
| [5] |
张淑平, 韩立建, 周伟奇, 等. 城市规模对大气污染物NO2和PM2.5浓度的影响. 生态学报, 2016,36(16):5049-5057.
随着我国城市的快速发展,城市的区域性大气污染问题日益突出,尤其是大城市和超大城市的污染问题更加严重。那么城市规模的扩大是否必然导致空气污染的加剧?控制城市人口规模是否是防治空气污染的有效手段?这些问题成为空气污染防治中政府、公众和学者广泛关注的焦点。采用2013年冬季全国114个重点城市两种典型大气污染物-NO2(传统)和PM2.5(新型)-浓度的实时监测数据,首先分析了这两种大气污染物的空间分布特征,进而定量分析城市人口规模和大气污染物浓度的关系。结果显示:(1)仅有21%的城市NO2浓度达到WHO的城市年均浓度标准(40μg/m3),全部城市的PM2.5浓度高于WHO年均浓度标准(10 μg/m3);(2)大气污染物的空间分布具有显著的集聚特征和区域性特征,表现为:NO2呈较为分散的空间分布,而PM2.5的空间分布呈现"北高南低、内陆高沿海低"的特征。NO2浓度高的区域主要分布在天津、河北东南部和山东中部地区,PM2.5浓度高的区域主要分布于河北西南部和山东西部;(3)常住人口规模同冬季NO2和PM2.5浓度呈倒"U"型关系;在1000到1200万的城市冬季平均NO2和PM2.5浓度最高(NO2:69.28μg/m3,PM2.5:119.58μg/m3)。(4)总人口低于1200万的城市,冬季NO2浓度和PM2.5浓度随着城市规模增加而显著升高(NO2:r=0.44,P< 0.01;PM2.5:r=0.43,P< 0.01);总人口高于1200万的城市,NO2浓度同城市规模呈显著负相关关系(r=0.91,P< 0.05),PM2.5浓度随城市规模增加逐渐降低。(5)常住人口密度在1000人/ km2以下的重点城市,NO2和PM2.5浓度同城市人口密度呈显著正相关关系(NO2:r=0.23,P< 0.05;PM2.5:r=0.36,P< 0.01)。常住人口密度在1000人/km2以上的城市人口密度同NO2和PM2.5浓度呈显著负相关关系(NO2:r=-0.61,P< 0.05;PM2.5:r=0.63,P< 0.01=""><![CDATA[随着我国城市的快速发展,城市的区域性大气污染问题日益突出,尤其是大城市和超大城市的污染问题更加严重。那么城市规模的扩大是否必然导致空气污染的加剧?控制城市人口规模是否是防治空气污染的有效手段?这些问题成为空气污染防治中政府、公众和学者广泛关注的焦点。采用2013年冬季全国114个重点城市两种典型大气污染物-NO2(传统)和PM2.5(新型)-浓度的实时监测数据,首先分析了这两种大气污染物的空间分布特征,进而定量分析城市人口规模和大气污染物浓度的关系。结果显示:(1)仅有21%的城市NO2浓度达到WHO的城市年均浓度标准(40μg/m3),全部城市的PM2.5浓度高于WHO年均浓度标准(10 μg/m3);(2)大气污染物的空间分布具有显著的集聚特征和区域性特征,表现为:NO2呈较为分散的空间分布,而PM2.5的空间分布呈现"北高南低、内陆高沿海低"的特征。NO2浓度高的区域主要分布在天津、河北东南部和山东中部地区,PM2.5浓度高的区域主要分布于河北西南部和山东西部;(3)常住人口规模同冬季NO2和PM2.5浓度呈倒"U"型关系;在1000到1200万的城市冬季平均NO2和PM2.5浓度最高(NO2:69.28μg/m3,PM2.5:119.58μg/m3)。(4)总人口低于1200万的城市,冬季NO2浓度和PM2.5浓度随着城市规模增加而显著升高(NO2:r=0.44,P< 0.01;PM2.5:r=0.43,P< 0.01);总人口高于1200万的城市,NO2浓度同城市规模呈显著负相关关系(r=0.91,P< 0.05),PM2.5浓度随城市规模增加逐渐降低。(5)常住人口密度在1000人/ km2以下的重点城市,NO2和PM2.5浓度同城市人口密度呈显著正相关关系(NO2:r=0.23,P< 0.05;PM2.5:r=0.36,P< 0.01)。常住人口密度在1000人/km2以上的城市人口密度同NO2和PM2.5浓度呈显著负相关关系(NO2:r=-0.61,P< 0.05;PM2.5:r=0.63,P< 0.01="">
[
{{custom_citation.content}}
{{custom_citation.annotation}}
|
| [6] |
成亚利, 王波. 上海市PM2.5的时空分布特征及污染评估. 计算机与应用化学, 2014,31(10):1189-1192.
[
{{custom_citation.content}}
{{custom_citation.annotation}}
|
| [7] |
岳玎利, 谢敏, 周炎. 环境空气质量新标准对珠三角区域站空气质量评价的影响. 中国环境监测, 2013,29(5):38-42.
[
{{custom_citation.content}}
{{custom_citation.annotation}}
|
| [8] |
{{custom_citation.content}}
{{custom_citation.annotation}}
|
| [9] |
程龙, 季冕, 耿天召. 合肥市颗粒物时空分布特征及其气象成因研究. 中国环境管理干部学院学报, 2017,27(5):11-15.
[
{{custom_citation.content}}
{{custom_citation.annotation}}
|
| [10] |
{{custom_citation.content}}
{{custom_citation.annotation}}
|
| [11] |
王永, 沈毅. 空间自相关方法及其主要应用现状. 中国卫生统计, 2008,25(4):443-445.
[
{{custom_citation.content}}
{{custom_citation.annotation}}
|
| [12] |
胡安俊, 孙久文 空间计量: 模型、方法与趋势. 世界经济文汇, 2014, (6):111-120.
[
{{custom_citation.content}}
{{custom_citation.annotation}}
|
| [13] |
{{custom_citation.content}}
{{custom_citation.annotation}}
|
| [14] |
HJ 633-2012, 环境空气质量指数(AQI)技术规定, https://kns.cnki.net/kcms/detail/detail.aspx?FileName=SCSD000006260743&DbName=SCSD, 2012-02-29.
[ HJ 633-2012, 环境空气质量指数(AQI)技术规定, https://kns.cnki.net/kcms/detail/detail.aspx?FileName=SCSD000006260743&DbName=SCSD, 2012-02-29.]
{{custom_citation.content}}
{{custom_citation.annotation}}
|
| [15] |
马敏劲, 杨秀梅, 丁凡. 中国南北方大气污染的时空分布特征. 环境科学与技术, 2018,41(5):187-197.
[
{{custom_citation.content}}
{{custom_citation.annotation}}
|
| [16] |
王立平, 陈俊. 中国雾霾污染的社会经济影响因素: 基于空间面板数据EBA模型实证研究. 环境科学学报, 2016,36(10):3833-3839.
[
{{custom_citation.content}}
{{custom_citation.annotation}}
|
| [17] |
康恒元, 刘玉莲, 李涛. 黑龙江省重点城市AQI指数特征及其与气象要素之关系. 自然资源学报, 2017,32(4):692-703.
[
{{custom_citation.content}}
{{custom_citation.annotation}}
|
| [18] |
The fine particulate matter (PM2.5) problem has attracted much scientific and public attention, due to its effects on visibility, human health, and global climate. There are three factors that have important effect on PM2.5 mass concentration: domestic pollutant emission sources, external sources outside of the country, and the meteorological conditions. Nagasaki is a coastal prefecture located at the westernmost part of Japan, which is an ideal location to study pollutants from long range transport and correlation between PM2.5 and meteorological conditions. In this paper, PM2.5 concentration data and meteorological data were obtained during 1 January 2013~31 December 2013. The spatial distribution depicts that the western part of the study area has the most serious PM2.5 pollution. The correlation analysis results between PM2.5 concentration and meteorological data showed that temperature had a negative, and precipitation had a positive, correlation with PM2.5. There was a threshold in the correlations between humidity and wind speed and PM2.5. The correlation was positive or negative depending on the meteorological variable values, if these were lower or higher than the threshold. From the relationship with wind direction, it can be depicted that the west wind might bring the most pollutants to Nagasaki.
{{custom_citation.content}}
{{custom_citation.annotation}}
|
| [19] |
{{custom_citation.content}}
{{custom_citation.annotation}}
|
| [20] |
南国卫, 孙虎, 朱一梅. 陕西省PM2.5时空分布规律及其影响因素. 环境科学研究, 2018,31(5):834-843.
[
{{custom_citation.content}}
{{custom_citation.annotation}}
|
| [21] |
徐成龙, 程钰. 新常态下山东省环境规制对工业结构调整及其大气环境效应研究. 自然资源学报, 2016,31(10):1662-1674.
[
{{custom_citation.content}}
{{custom_citation.annotation}}
|
| [22] |
马格, 田国行, 李永华, 等. 郑州市气象因子对大气颗粒物浓度的影响研究. 气象与环境科学, 2018,41(3):29-38.
[
{{custom_citation.content}}
{{custom_citation.annotation}}
|
| [23] |
于彩霞, 邓学良, 石春娥, 等. 降水和风对大气PM2.5、PM10的清除作用分析. 环境科学学报, 2018,38(12):4620-4629.
[
{{custom_citation.content}}
{{custom_citation.annotation}}
|
| [24] |
苏良缘, 沈然. 京津冀区域城市化程度与颗粒物污染的相关性研究. 北京城市学院学报, 2015, (2):7-12.
[
{{custom_citation.content}}
{{custom_citation.annotation}}
|
| {{custom_ref.label}} |
{{custom_citation.content}}
{{custom_citation.annotation}}
|


 PDF(2043 KB)
 图1 2017年华北地区PM2.5和PM10年均浓度分布图2 2017年华北地区PM2.5和PM10月均浓度变化图3 2017年华北地区颗粒物年均浓度空间聚集特征
 表1 2017年华北地区颗粒物年均浓度空间自相关分析结果表2 影响2017年华北地区PM2.5浓度差异的因素表3 影响2017年华北地区PM10浓度差异的因素表4 基于OLS回归的拉格朗日乘子检验
/
| 〈 |
|
〉 |


 AI Summary

