 PDF(4178 KB)
 PDF(4178 KB)
PDF(4178 KB)
PDF(4178 KB)
中国高等级旅游景区资源多尺度时空差异及其影响因素
 ({{custom_author.role_cn}}), {{javascript:window.custom_author_cn_index++;}}
Multiscale analysis of the spatiotemporal differences and the influencing factors of the high-level tourist attractions in China
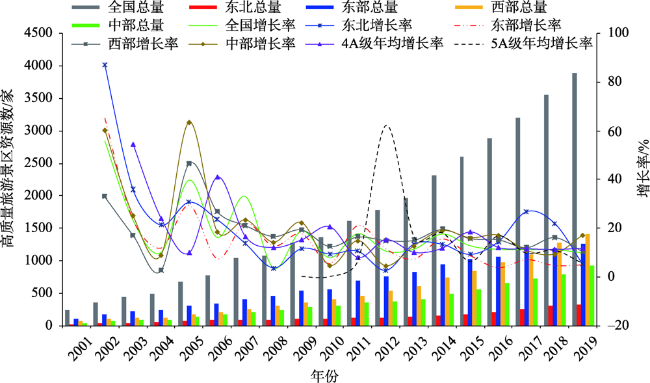
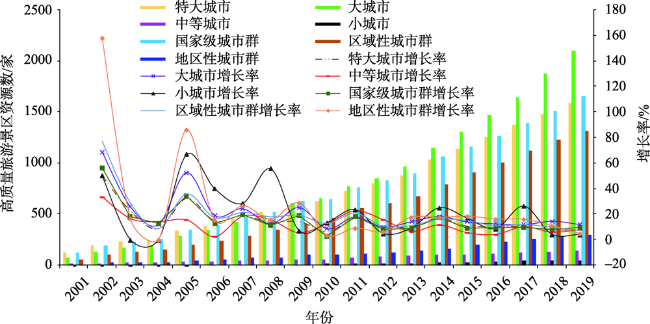
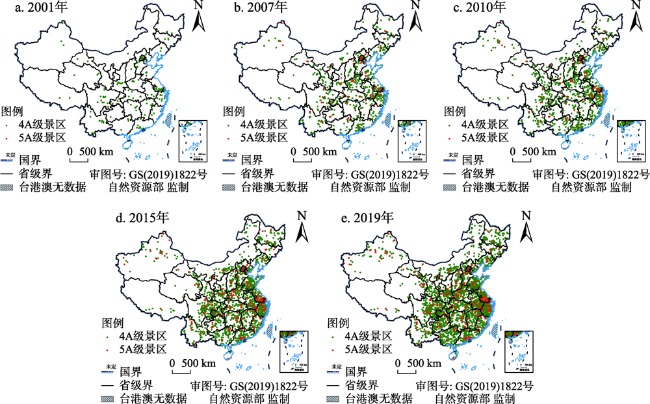
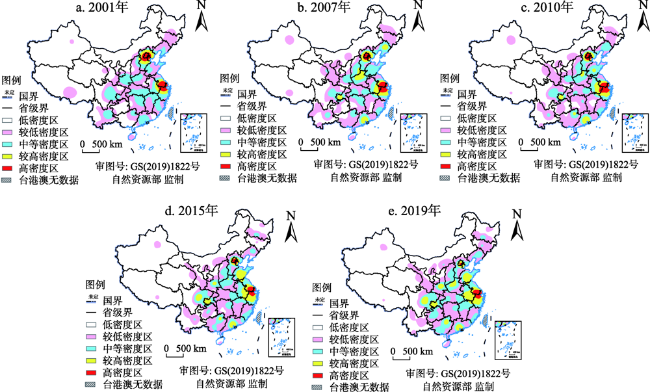
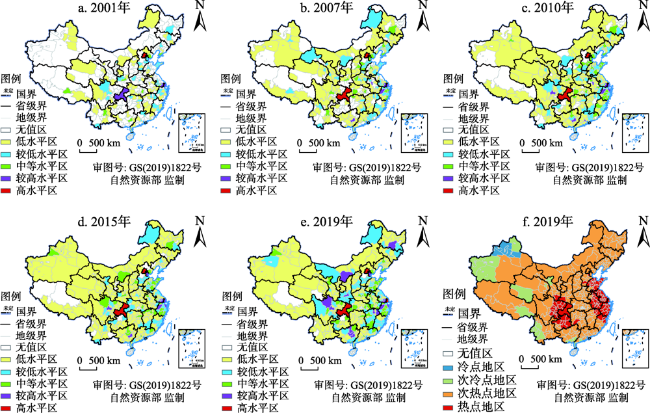
({{custom_author.role_en}}), {{javascript:window.custom_author_en_index++;}}以中国337个地级以上城市内的5A和4A级景区为研究对象,通过构建总体分异指数(GDI)并采用探索性空间数据分析(ESDA)等方法,从省级、城市群、城市等不同空间尺度,对2001—2019年中国高等级旅游景区资源时空演化特征进行综合分析。结果表明:(1)4A级景区主导了中国高等级旅游景区数量与增长率的变化趋势,2015年之后增长速度进入相对平缓状态;(2)时序上,中部和东北地区的各省份高等级旅游景区数量较少,但增长率较高,而西部省份则均相对较高,东部省份则是数量最多但增长率最低,到2017年西部超过东部,数量最多;城市规模与高等级旅游景区数量呈正比,与增长率呈反比;(3)空间上,中国高等级旅游景区分布密集程度逐年升高,呈现出主要依托东部沿海地区与中部地区城市群集聚分布的特征,且空间热点、次热点地区占主导地位,形成了“两点集聚—多极多区—集群集聚”的空间演化格局;(4)GDI指数随着研究尺度的缩小而增大,空间尺度越小,高等级旅游景区资源的差异越大;(5)中国高等级旅游景区空间分布主要受社会、经济、资源等因素相互作用的影响,其中人口规模、旅游经济、人文资源是共同的最为关键的因子。研究结果可为优化中国景区资源空间布局以及旅游业高质量及区域协调发展提供一定参考。
Taking 4A and 5A scenic spots of high-level tourist attractions in 337 cities in China as the research object, the spatial and temporal evolution characteristics of high-level tourist attraction resources in China from 2001 to 2019 were comprehensively analyzed by constructing the overall differentiation index (GDI) and using exploratory spatial data analysis (ESDA). The results show that: (1) In China, 4A scenic spots dominate the developing trend of high-level tourist attractions in number and growth, and the growth rate enters a period of being relatively stable after 2015. (2) According to the time sequence analysis, the number of high-level tourist attractions in the central and northeast regions is small, but the growth rate is higher than that of other regions. In the western region, there is a large number of high-level tourist attractions and they are increasing fast, while the eastern region has the most high-level tourist attractions, they are experiencing the lowest growth rate, exceeded by the western region in number in 2017. The size of the city is proportional to the number of high-level tourist attractions, inversely proportional to the growth rate. (3) From the spatial perspective, the distribution density of high-level tourist attractions in China is increasing year by year. The density of high-level tourist attractions is related to the agglomeration of urban agglomerations in coastal areas and the central region. The spatial hot spots and sub-hot spots occupy the dominant position, forming a pattern of "two points agglomeration, multi-pole and multi-region agglomeration, clusters agglomeration". (4) The GDI index increases with the reduction of the research scale, and the smaller the spatial scale is, the greater the differences between high-level tourist attraction resources are. (5) The spatial distribution characteristics of high-level tourist attractions in China are influenced by the interaction of social factors, economic factors, resource factors and other factors, among which, the population scale, tourism economy as well as human and culture resources are critical. The research results can provide some reference for optimizing the spatial layout of scenic spots resources and coordinating high-quality regional development of tourism in China.
高等级旅游景区资源 / 多尺度 / 时空差异 / 影响因素 {{custom_keyword}} /
high-level tourist attractions / multi-scale / spatial and temporal differences / influencing factor {{custom_keyword}} /
表1 多尺度下中国高等级旅游景区GDI指数Table 1 GDI index of high-level tourist attractions in China at multiple scales |
| 年份 | 全国GDI指数 | 四大区域GDI指数 | 城市群GDI指数 | 城市GDI指数 | |||||||||||||
|---|---|---|---|---|---|---|---|---|---|---|---|---|---|---|---|---|---|
| 省级 | 四大区域 | 城市 | 东部 | 中部 | 西部 | 东北 | 国家级 | 区域性 | 地区性 | 特大城市 | 大城市 | 中等城市 | 小城市 | ||||
| 2001 | 0.29 | 0.26 | 2.95 | 0.23 | 0.10 | 0.27 | 0.24 | 0.22 | 0.81 | 0.40 | 2.29 | 2.83 | 2.42 | 3.08 | |||
| 2002 | 0.31 | 0.26 | 2.69 | 0.22 | 0.11 | 0.30 | 0.21 | 0.23 | 1.06 | 0.30 | 2.13 | 2.50 | 2.58 | 2.74 | |||
| 2003 | 0.33 | 0.25 | 2.44 | 0.24 | 0.15 | 0.31 | 0.26 | 0.25 | 1.02 | 0.34 | 1.83 | 2.23 | 2.48 | 2.74 | |||
| 2004 | 0.34 | 0.24 | 2.39 | 0.21 | 0.15 | 0.31 | 0.34 | 0.25 | 1.05 | 0.34 | 1.73 | 2.20 | 2.61 | 2.74 | |||
| 2005 | 0.32 | 0.22 | 2.03 | 0.24 | 0.13 | 0.27 | 0.33 | 0.27 | 0.34 | 0.32 | 1.51 | 1.80 | 2.38 | 2.54 | |||
| 2006 | 0.30 | 0.19 | 1.84 | 0.23 | 0.13 | 0.29 | 0.30 | 0.24 | 0.25 | 0.34 | 1.37 | 1.63 | 2.38 | 2.03 | |||
| 2007 | 0.28 | 0.20 | 1.62 | 0.25 | 0.13 | 0.23 | 0.21 | 0.26 | 0.22 | 0.28 | 1.22 | 1.39 | 2.34 | 1.57 | |||
| 2008 | 0.27 | 0.21 | 1.45 | 0.27 | 0.10 | 0.21 | 0.19 | 0.24 | 0.21 | 0.26 | 1.15 | 1.23 | 2.12 | 0.99 | |||
| 2009 | 0.28 | 0.21 | 1.22 | 0.29 | 0.11 | 0.21 | 0.24 | 0.25 | 0.19 | 0.19 | 1.02 | 0.96 | 1.92 | 1.00 | |||
| 2010 | 0.28 | 0.21 | 1.05 | 0.29 | 0.11 | 0.24 | 0.18 | 0.22 | 0.19 | 0.18 | 0.88 | 0.80 | 1.70 | 0.78 | |||
| 2011 | 0.29 | 0.22 | 0.94 | 0.32 | 0.11 | 0.24 | 0.15 | 0.23 | 0.22 | 0.15 | 0.76 | 0.68 | 1.78 | 0.85 | |||
| 2012 | 0.31 | 0.23 | 0.94 | 0.34 | 0.10 | 0.26 | 0.14 | 0.23 | 0.23 | 0.14 | 0.75 | 0.69 | 1.61 | 0.86 | |||
| 2013 | 0.31 | 0.23 | 0.80 | 0.36 | 0.07 | 0.26 | 0.14 | 0.22 | 0.23 | 0.15 | 0.64 | 0.57 | 1.43 | 0.64 | |||
| 2014 | 0.31 | 0.23 | 0.75 | 0.36 | 0.04 | 0.27 | 0.20 | 0.22 | 0.23 | 0.14 | 0.59 | 0.53 | 1.45 | 0.61 | |||
| 2015 | 0.31 | 0.22 | 0.68 | 0.37 | 0.04 | 0.27 | 0.23 | 0.23 | 0.24 | 0.16 | 0.49 | 0.48 | 1.26 | 0.66 | |||
| 2016 | 0.31 | 0.21 | 0.62 | 0.38 | 0.06 | 0.29 | 0.14 | 0.23 | 0.23 | 0.16 | 0.46 | 0.41 | 1.20 | 0.74 | |||
| 2017 | 0.29 | 0.19 | 0.55 | 0.38 | 0.06 | 0.28 | 0.09 | 0.22 | 0.22 | 0.17 | 0.39 | 0.36 | 1.19 | 0.55 | |||
| 2018 | 0.30 | 0.18 | 0.50 | 0.39 | 0.07 | 0.31 | 0.07 | 0.22 | 0.21 | 0.19 | 0.39 | 0.29 | 1.24 | 0.59 | |||
| 2019 | 0.30 | 0.18 | 0.49 | 0.40 | 0.07 | 0.32 | 0.08 | 0.21 | 0.19 | 0.21 | 0.39 | 0.29 | 1.25 | 0.59 | |||
| 方差 | 0.00 | 0.00 | 0.64 | 0.00 | 0.00 | 0.00 | 0.01 | 0.00 | 0.10 | 0.01 | 0.37 | 0.67 | 0.28 | 0.86 | |||
表2 多尺度下高等级旅游景区资源分布影响因子探测结果Table 2 Detected results of driving factors of resource distribution of high-level tourist attractions at multiple scales |
| 探测指标 | x1 | x2 | x3 | x4 | x5 | x6 | x7 | x8 | x9 |
|---|---|---|---|---|---|---|---|---|---|
| 省级 | 0.794*** | 0.544*** | 0.135*** | 0.022*** | 0.663*** | 0.604*** | 0.473*** | 0.070*** | 0.255*** |
| 城市群 | 0.791*** | 0.408*** | 0.670*** | 0.674*** | 0.949*** | 0.750*** | 0.458*** | 0.247*** | 0.558*** |
| 城市 | 0.670*** | 0.049*** | 0.053*** | 0.063*** | 0.639*** | 0.643*** | 0.149*** | 0.014*** | 0.054*** |
| 注:***P<0.01。 |
表3 多尺度下高等级旅游景区资源分布影响因子交互探测结果Table 3 Interactive detection results of driving factors of resource distribution of high-level tourist attractions at multiple scales |
| 交互因子 | 省级 | 城市群 | 城市 | 交互因子 | 省级 | 城市群 | 城市 |
|---|---|---|---|---|---|---|---|
| x1∩x2 | 0.926 | 0.987 | 0.704 | x3∩x7 | 0.841 | 0.817 | 0.296 |
| x1∩x3 | 0.871 | 0.811 | 0.716 | x3∩x8 | 0.269 | 0.807 | 0.140 |
| x1∩x4 | 0.849 | 0.797 | 0.711 | x3∩x9 | 0.734 | 0.795 | 0.189 |
| x1∩x5 | 0.818 | 0.981 | 0.770 | x4∩x5 | 0.687 | 0.981 | 0.767 |
| x1∩x6 | 0.925 | 0.794 | 0.768 | x4∩x6 | 0.659 | 0.797 | 0.762 |
| x1∩x7 | 0.904 | 0.989 | 0.709 | x4∩x7 | 0.593 | 0.818 | 0.325 |
| x1∩x8 | 0.836 | 0.979 | 0.699 | x4∩x8 | 0.295 | 0.808 | 0.170 |
| x1∩x9 | 0.880 | 0.997 | 0.699 | x4∩x9 | 0.485 | 0.793 | 0.176 |
| x2∩x3 | 0.826 | 0.965 | 0.146 | x5∩x6 | 0.874 | 0.978 | 0.737 |
| x2∩x4 | 0.680 | 0.994 | 0.170 | x5∩x7 | 0.705 | 0.986 | 0.744 |
| x2∩x5 | 0.816 | 0.984 | 0.741 | x5∩x8 | 0.674 | 0.960 | 0.675 |
| x2∩x6 | 0.850 | 0.987 | 0.750 | x5∩x9 | 0.744 | 0.993 | 0.752 |
| x2∩x7 | 0.872 | 0.767 | 0.240 | x6∩x7 | 0.738 | 0.987 | 0.759 |
| x2∩x8 | 0.664 | 0.793 | 0.134 | x6∩x8 | 0.669 | 0.977 | 0.681 |
| x2∩x9 | 0.751 | 0.970 | 0.213 | x6∩x9 | 0.853 | 0.990 | 0.703 |
| x3∩x4 | 0.270 | 0.707 | 0.157 | x7∩x8 | 0.580 | 0.692 | 0.332 |
| x3∩x5 | 0.815 | 0.990 | 0.737 | x7∩x9 | 0.695 | 0.773 | 0.272 |
| x3∩x6 | 0.936 | 0.791 | 0.733 | x8∩x9 | 0.606 | 0.703 | 0.088 |
| [1] |
许涛. 旅游地学研究内核及其学科体系框架. 干旱区资源与环境, 2021, 35(1): 182-188.
[
{{custom_citation.content}}
{{custom_citation.annotation}}
|
| [2] |
罗浩, 冯润. 论旅游景区、旅游产品、旅游资源及若干相关概念的经济性质. 旅游学刊, 2019, 34(11): 116-123.
[
{{custom_citation.content}}
{{custom_citation.annotation}}
|
| [3] |
山海关景区被取消5A级资质河北公布整改措施. http://news.sohu.com/20151012/n423043381.shtml. 2015-10-12.
[Shanhaiguan scenic spot was cancelled 5A qualification Hebei announced rectification measures. http://news.sohu.com/20151012/n423043381.shtml. 2015-10-12.]
{{custom_citation.content}}
{{custom_citation.annotation}}
|
| [4] |
{{custom_citation.content}}
{{custom_citation.annotation}}
|
| [5] |
{{custom_citation.content}}
{{custom_citation.annotation}}
|
| [6] |
{{custom_citation.content}}
{{custom_citation.annotation}}
|
| [7] |
胡炜霞, 梁晓涛, 桑子俞. 山西省3A及以上旅游景区时空演化特征及原因分析. 干旱区资源与环境, 2020, 34(12): 187-194.
[
{{custom_citation.content}}
{{custom_citation.annotation}}
|
| [8] |
张广海, 颜文静. 我国旅游业地区比较优势的时空演化及影响因素分析. 资源开发与市场, 2020, 36(4): 427-433.
[
{{custom_citation.content}}
{{custom_citation.annotation}}
|
| [9] |
谢志华, 吴必虎. 中国资源型景区旅游空间结构研究. 地理科学, 2008, 28(6): 748-753.
[
With the rapid development in economy, the tourism industry of China is also booming. Though there are more and more man-made attractions such as Themed Amusement Park, traditional attractions with natural beauty and/or historical sites are still within the most popular choices of tourists. In this article such kind of attractions are named resources-based attraction. Based on former study, the paper makes definition of resources-based attraction. Then it selects 509 resources-based attractions as research samples from 671 National AAAA Tourist Attractions, which were authorized by China National Tourism Administration in 2005. By means of GIS spatial analysis tools and some quantitative analysis methods such as NNI (Nearest Neighbor Index), GCI (Geographic Concentration Index), Gini Coefficient and Lorenz Curve, the paper analyses the spatial structure of 509 resources-based attractions and observes their distribution in 8 geographical regions and 31 provinces in China. The result shows that the value of NNI is as low as 0.57, which means the distribution of 509 resources-based attractions is a type of agglomeration. And the distribution of 509 resources-based attractions in 8 geographical and 31 provinces is asymmetric. According to the Lorenz Curve, more than half of 509 resources-based attractions concentrate in 9 provinces, such as Jiangsu and Zhejiang. Changjiang River Delta, Beijing, Xi’an and Luoyang are the places with a high density of resources-based attractions.
{{custom_citation.content}}
{{custom_citation.annotation}}
|
| [10] |
潘竟虎, 李俊峰. 中国A级旅游景点空间分布特征与可达性. 自然资源学报, 2014, 29(1): 55-66.
[
{{custom_citation.content}}
{{custom_citation.annotation}}
|
| [11] |
丛丽, 于佳平, 王灵恩. 我国半资源消费型野生动物旅游景区时空演变特征及其驱动因素分析. 自然资源学报, 2020, 35(12): 2831-2847.
[
{{custom_citation.content}}
{{custom_citation.annotation}}
|
| [12] |
唐承财, 孙孟瑶, 万紫微. 京津冀城市群高等级景区分布特征及影响因素. 经济地理, 2019, 39(10): 204-213.
[
{{custom_citation.content}}
{{custom_citation.annotation}}
|
| [13] |
贾垚焱, 胡静, 刘大均, 等. 长江中游城市群A级旅游景区空间演化及影响机理. 经济地理, 2019, 39(1): 198-206.
[
{{custom_citation.content}}
{{custom_citation.annotation}}
|
| [14] |
吴春涛, 李隆杰, 何小禾, 等. 长江经济带旅游景区空间格局及演变. 资源科学, 2018, 40(6): 1196-1208.
长江经济带的联动发展及生态廊道建设使旅游景区的空间分布出现剧烈变化,研究旅游景区的空间变化对旅游基础设施的合理布局、制定长江黄金旅游带规划以及实现旅游经济腾飞具有重要作用。本文选取2012年和2016年长江经济带九省二市的旅游景区空间点位数据,综合运用标准差椭圆、平均最近邻分析以及核密度等方法分析了长江经济带旅游景区的空间演变特征。结果表明:长江经济带旅游景区总体分布格局基本沿长江水系发生聚集,聚集程度随时间的推移不断加深;相关政策促进、旅游业市场需求持续增加、交通可达性优化等多重因素的综合作用使区域景区聚集加速;城市休闲型景区以及主题公园兴建为城市景区聚集提供新动力。
[
{{custom_citation.content}}
{{custom_citation.annotation}}
|
| [15] |
王洪桥, 袁家冬, 孟祥君. 东北地区A级旅游景区空间分布特征及影响因素. 地理科学, 2017, 37(6): 895-903.
基于东北地区2009年、2012年和2015年A级旅游景区数据,采用最邻近指数、基尼系数、核密度分析、相关分析等数理和空间分析方法,基于GIS空间分析技术,从类型、均衡度和密度等方面对东北地区A级旅游景区的空间分布特征及影响因素进行研究,结果显示:① 2009年、2012年、2015年3个时段,东北地区A级旅游景区在空间上呈集聚状态,且集聚程度具有先强后弱的演变特征;② 省会城市和主要交通节点城市附近A级旅游景区核密度较大;③ 随着旅游业的快速发展,东北三省A级旅游景区核密度增强区域扩散较快,但蒙东地区变化较慢;④ 旅游资源空间分布受自然因素和人文因素影响很大,其中地形地貌、水文是影响A级旅游景区分布的内生因素,而社会经济水平、交通等是重要的外推动力,对A级旅游景区分布影响比较显著。
[
Based on the Northeast China’s data of level-A scenic spots in 2009, 2012 and 2015,using the nearest neighbor index, Gini coefficient, kernel density analysis, correlation analysis and other mathematical and spatial analysis methods, and based on GIS spatial analysis technology, this article studies the spatial distribution characteristics and influencing factors of level-A scenic spots in Northeast China from the aspects of type, equilibrium degree and density. The results showed that: In 2009, 2012 and 2015, level-A scenic spots in Northeast China show a agglomeration state in the spatial, and the degree of agglomeration has the characteristics of first strong and then weak. The provincial capital cities and main traffic nodes near the city have larger Nuclear Density of level-A scenic spots. With the rapid development of the tourism, the proliferation of kernel density of level-A scenic spots in Northeast China is faster, but that in eastern Inner Mongolia is changing slowly. The spatial distribution of tourism resources is greatly influenced by natural and cultural factors, topography and hydrology are important factors affecting the distribution of level-A scenic spots. On the social-economic aspect, traffic and other factors are very important power of extrapolation, and have significant influence of the distribution of level-A scenic spots. {{custom_citation.content}}
{{custom_citation.annotation}}
|
| [16] |
麻学锋, 杨雪. 大湘西高级别景区时空分布特征及影响因素的空间异质性. 自然资源学报, 2019, 34(9): 1902-1916.
[
{{custom_citation.content}}
{{custom_citation.annotation}}
|
| [17] |
李冬花, 张晓瑶, 陆林, 等. 黄河流域高级别旅游景区空间分布特征及影响因素. 经济地理, 2020, 40(5): 70-80.
[
{{custom_citation.content}}
{{custom_citation.annotation}}
|
| [18] |
刘敏, 郝炜, 张芙蓉. 山西省A级景区空间分布与影响因素. 经济地理, 2020, 35(12): 2831-2847.
[
{{custom_citation.content}}
{{custom_citation.annotation}}
|
| [19] |
刘亚晶, 罗静, 孙建伟, 等. 2018年湖北省旅游供需的空间结构特征分析: 以A级景区为例. 人文地理, 2021, 36(2): 175-183.
[
{{custom_citation.content}}
{{custom_citation.annotation}}
|
| [20] |
冯英杰, 吴小根, 张宏磊, 等. 江苏省水利风景区时空演变及其影响因素. 经济地理, 2018, 38(7): 217-224.
[
{{custom_citation.content}}
{{custom_citation.annotation}}
|
| [21] |
吴清, 李细归, 吴黎, 等. 湖南省A级旅游景区分布格局及空间相关性分析. 经济地理, 2017, 37(2): 193-200.
[
{{custom_citation.content}}
{{custom_citation.annotation}}
|
| [22] |
白子怡, 薛亮, 严艳. 基于GIS的旅游景区空间分布特征及影响因素定量分析: 以云南省A级旅游景区为例. 云南大学学报: 自然科学版, 2019, 41(5): 982-991.
[
{{custom_citation.content}}
{{custom_citation.annotation}}
|
| [23] |
林丹, 周向丽, 程叶青, 等. 海南岛乡村旅游资源点空间格局及影响因素. 海南师范大学学报: 自然科学版, 2020, 33(3): 307-317.
[
{{custom_citation.content}}
{{custom_citation.annotation}}
|
| [24] |
程海峰, 胡文海. 池州市A级旅游景区空间结构. 地理科学, 2014, 34(10): 1275-1280.
采用最近邻距离模式、连接度、通达度、紧密度分析的研究方法,从总体空间分布特征与区域内空间分布结构2方面对池州市旅游景区空间结构进行分析测定,发现池州市A级旅游景区空间距离较小,呈集聚型分布;β指数为1.56、 γ指数为0.53、平均径路长为3.26,旅游景区间交通网络的通达度较低,交通网络联系程度较弱,尚未形成稠密的旅游交通网络,旅游资源整合水平较低;紧密度指数C为0.55,紧凑程度处于中等,为区内旅游交通建设,提高区内旅游资源网络连通性、通达性提供了较好的基础。
[
{{custom_citation.content}}
{{custom_citation.annotation}}
|
| [25] |
许志晖, 戴学军, 庄大昌, 等. 南京市旅游景区景点系统空间结构分形研究. 地理研究, 2007, 26(1): 132-140.
[
{{custom_citation.content}}
{{custom_citation.annotation}}
|
| [26] |
吴荣华, 张宏磊, 张捷, 等. 城市历史文化旅游地的小尺度空间结构及关联: 以南京夫子庙景区为例. 地理研究, 2014, 33(12): 2427-2436.
旅游地小尺度空间结构研究可以全面而系统地考察旅游地在旅游发展中空间形态发生的变化,指导旅游地的建筑、业态及相关环境的规划、保护与更新。运用空间句法理论探讨空间结构与社会关系,以南京夫子庙景区为例,从通道、景点与商铺等要素及其间的空间关联解读城市历史文化旅游地的小尺度空间结构。结果表明:夫子庙这一类城市历史文化旅游地的道路针对游客、内部居民和城市人群等群体明显分化为三类道路,三类道路在空间区位、空间句法值、使用人群上有所差别;桥梁在空间中起着非常重要的联通作用;景点的分布主要沿传统中轴线形成小范围集聚,与路网的通达性并未一一对应。传统中轴线和重点吸引物经过多年的配套和演变仍处于一个空间核心位置,这一地方性空间的独特性体现了夫子庙这一类历史文化街区仍受到中国传统礼制的影响。小尺度地区景点的空间分布极大地影响着游客的行走路径。最后,对旅游地较低的空间理解度和景点与道路之间的低关联性提出了对应的规划、保护与更新策略。
[
{{custom_citation.content}}
{{custom_citation.annotation}}
|
| [27] |
王洋, 方创琳, 盛长元. 扬州市住宅价格的空间分异与模式演变. 地理学报, 2013, 68(8): 1082-1096.
以2001-2012 年扬州中心城区各居住小区的住宅平均单价为基本数据,通过建立住宅价格总体分异测度指数(GDI) 计算其总体分异趋势及各住宅类型内部的分异趋势;采用核密度函数等方法探索住宅价格的分布形态和分异格局的演变规律;利用趋势面分析不同住宅类型价格的空间分异趋势;基于上述结果总结空间分异的演变模式,并分别探索空间分异与格局演变的驱动力。结果表明:① 2001 年以来扬州市住宅价格差距显著增大,分异趋势在波动中增强,与城市住宅均价的年增长率耦合;住宅价格呈现西高东低的空间分异格局,同档次价格小区由空间集聚转为相对分散,高、低价格住宅区分别沿固定扇面由中心向外围扩散。②不同住宅类型内的价格分异走势差别显著,各类型住宅间的价格趋势面差距明显,但其空间形态类似。③ 空间分异模式由2001 年西高东低的扇形同档次价格集聚式分异转变为2012 年扇形与圈层相结合的多档次价格混合式分异。④ 2001 年以来住宅价格总体分异的核心驱动力是城市居住空间的迅速扩展、居民收入差距的增大、房地产市场的繁荣和住宅类型的多元化,其住宅价格空间格局演变的驱动力为城市发展方向的确立与变化、特定住宅类型建设的区位指向和古城保护、旧城改造与新区建设。
[
{{custom_citation.content}}
{{custom_citation.annotation}}
|
| [28] |
{{custom_citation.content}}
{{custom_citation.annotation}}
|
| [29] |
{{custom_citation.content}}
{{custom_citation.annotation}}
|
| [30] |
{{custom_citation.content}}
{{custom_citation.annotation}}
|
| [31] |
赵磊, 丁烨, 杨宏浩. 浙江省旅游景区空间分布差异化研究. 经济地理, 2013, 33(9): 177-183.
[
{{custom_citation.content}}
{{custom_citation.annotation}}
|
| [32] |
{{custom_citation.content}}
{{custom_citation.annotation}}
|
| [33] |
张军以, 苏维词, 张凤太. 基于PSR模型的三峡库区生态经济区土地生态安全评价. 中国环境科学, 2011, 31(6): 1039-1044.
[
{{custom_citation.content}}
{{custom_citation.annotation}}
|
| [34] |
赵雪雁, 王晓琪, 刘江华, 等. 基于不同尺度的中国优质医疗资源区域差异研究. 经济地理, 2020, 40(7): 22-31.
[
{{custom_citation.content}}
{{custom_citation.annotation}}
|
| [35] |
胡艳兴, 潘竟虎, 陈蜒, 等. 基于ESDA和GWR的中国地级及以上城市四化协调发展时空分异格局. 经济地理, 2015, 35(5): 45-54.
[
{{custom_citation.content}}
{{custom_citation.annotation}}
|
| [36] |
王劲峰, 徐成东. 地理探测器: 原理与展望. 地理学报, 2017, 72(1): 116-134.
空间分异是自然和社会经济过程的空间表现,也是自亚里士多德以来人类认识自然的重要途径。地理探测器是探测空间分异性,以及揭示其背后驱动因子的一种新的统计学方法,此方法无线性假设,具有优雅的形式和明确的物理含义。基本思想是:假设研究区分为若干子区域,如果子区域的方差之和小于区域总方差,则存在空间分异性;如果两变量的空间分布趋于一致,则两者存在统计关联性。地理探测器q统计量,可用以度量空间分异性、探测解释因子、分析变量之间交互关系,已经在自然和社会科学多领域应用。本文阐述地理探测器的原理,并对其特点及应用进行了归纳总结,以利于读者方便灵活地使用地理探测器来认识、挖掘和利用空间分异性。
[
Spatial stratified heterogeneity is the spatial expression of natural and socio-economic process, which is an important approach for human to recognize nature since Aristotle. Geodetector is a new statistical method to detect spatial stratified heterogeneity and reveal the driving factors behind it. This method with no linear hypothesis has elegant form and definite physical meaning. Here is the basic idea behind Geodetector: assuming that the study area is divided into several subareas. The study area is characterized by spatial stratified heterogeneity if the sum of the variance of subareas is less than the regional total variance; and if the spatial distribution of the two variables tends to be consistent, there is statistical correlation between them. Q-statistic in Geodetector has already been applied in many fields of natural and social sciences which can be used to measure spatial stratified heterogeneity, detect explanatory factors and analyze the interactive relationship between variables. In this paper, the authors will illustrate the principle of Geodetector and summarize the characteristics and applications in order to facilitate the using of Geodetector and help readers to recognize, mine and utilize spatial stratified heterogeneity. {{custom_citation.content}}
{{custom_citation.annotation}}
|
| [37] |
方创琳, 毛其智, 倪鹏飞. 中国城市群科学选择与分级发展的争鸣及探索. 地理学报, 2015, 70(4): 515-527.
城市群作为国家参与全球竞争与国际分工的全新地域单元,是中国新型工业化和新型城镇化发展到较高阶段的产物,是“一带一路”建设的主战场,因而在推进国家新型城镇化和经济社会发展中具有举足轻重的战略地位。城市群的发展不仅主宰着国家经济发展的命脉,也主导着中国新型城镇化的未来。但中国城市群在选择与培育过程中出现了一系列亟待解决的现实问题,需要从科学角度提出推进城市群健康发展的技术路径和科学方案。基于这一意图,中国地理学会、中国城市百人论坛和中国科学院地理科学与资源研究所于2014年12月20日联合举办了首届《中国城市群发展高层论坛》。通过近100位专家激烈的辩论、争鸣与思考,一致认为:城市群在国家新型城镇化中占据主体地位并发挥重要作用,城市群的研究与发展是一个复杂科学问题和漫长过程,是一个自然自需过程,不能违背客观规律;城市群基本内涵和空间识别范围标准存在着激烈争论与思考,政策空间层面的城市群和学术空间层面的城市群有着不同的利益导向和价值取向;城市群选择和培育中存在着“滥圈滥划、扩容贪大、拔苗助长、无中生有、拼凑成群”等一系列亟待解决的“城市群病”;未来中国城市群空间格局正在形成不同的组织方案;不同发育程度的城市群存在着不同的问题和不同的发展模式,如京津冀城市群的协同发展优化模式、长江三角洲城市群的扩围模式、珠江三角洲城市群的“两条腿”并行模式、辽中南城市群的空间整合模式、哈长城市群的“井”字型空间组织模式、中原城市群的战略整合模式、关中城市群的均衡组织模式等。
[
As a country's brand-new geographical unit in global competition and international division of labor, urban agglomeration is the product of China's new industrialization and urbanization in a higher stage, as well as the main battlefield of the "One Belt and One Road" project. Meanwhile, the development of urban agglomerations dominates not only the economic arteries, but also the future of China's new urbanization. Hence, it is of great strategic significance to promoting China's new urbanization and socio-economic development. However, a series of problems have emerged in the selection and cultivation process of China's urban agglomerations, which needs appropriate technological paths and plans to facilitate the healthy development of China's urban agglomerations from the scientific point of view. Therefore, the "High-Level Forum on China's Urban Agglomeration Development", jointly organized by the Geographical Society of China, the China's City Forum of Hundred Experts, and the Institute of Geographic Science and Natural Resources Research, CAS, was held in Beijing on December 20, 2014. After a series of heated debates, contention and discussion, nearly 100 experts attending the forum agreed that: (1) urban agglomeration plays an important role and dominates China's new urbanization. The research and development of urban agglomerations is a complex scientific issue and a very long process, as well as a natural process which cannot go against the objective laws; (2) there is a fierce debate and discussion on the basic connotation and standards of spatial recognition range, the benefit and value orientation are different at the policy level and academic level; (3) during the selection and cultivation process, "urban agglomeration disease", such as indiscriminating enclosure, unlimited sprawl, spoiling cities by excessive enthusiasm, create something out of nothing and throwing cities together in groups, should be solved as soon as possible; (4) different organization plans for the future spatial pattern of China's urban agglomerations are forming; (5) distinctive development patterns and problems do exist among urban agglomerations with different development levels, for example, the collaborative development optimization mode of Beijing-Tianjin-Hebei urban agglomeration, the expansion mode of the Yangtze River Delta urban agglomeration, the parallel development mode of the Pearl River Delta urban agglomeration, the spatial integration mode of Central and Southern Liaoning urban agglomeration, the intersecting parallels ("#") space pattern of Harbin-Changchun urban agglomeration, the strategic integration mode of Central Plains urban agglomeration, and the balanced organization mode of Guanzhong urban agglomeration. {{custom_citation.content}}
{{custom_citation.annotation}}
|
| [38] |
国务院关于调整城市规模划分标准的通知. http://www.gov.cn/zhengce/content/2014-11/20/content_9225.htm, 2014-11-20.
[Circular of The State Council on adjusting the standards for the classification of city sizes. http://www.gov.cn/zhengce/content/2014-11/20/content_9225.htm, 2014-11-20.]
{{custom_citation.content}}
{{custom_citation.annotation}}
|
| [39] |
陶全刚, 张洪岩, 程雄, 等. 基于县区单元的我国3A级以上旅游景区空间聚集性研究. 地理与地理信息科学, 2017, 33(3): 113-119.
[
{{custom_citation.content}}
{{custom_citation.annotation}}
|
| [40] |
黄园淅, 杨波. 从胡焕庸人口线看地理环境决定论. 云南师范大学学报: 哲学社会科学版, 2012, 44(1): 68-73.
[
{{custom_citation.content}}
{{custom_citation.annotation}}
|
| [41] |
刘宁, 宋秋月, 侯佳佳, 等. 中国旅游产业结构变迁及空间网络演进. 地理与地理信息科学, 2020, 36(5): 119-127.
[
{{custom_citation.content}}
{{custom_citation.annotation}}
|
| [42] |
吴媛媛, 宋玉祥. 中国旅游经济空间格局演变特征及其影响因素分析. 地理科学, 2018, 38(9): 1491-1498.
[
{{custom_citation.content}}
{{custom_citation.annotation}}
|
| {{custom_ref.label}} |
{{custom_citation.content}}
{{custom_citation.annotation}}
|
/
| 〈 |
|
〉 |

 AI Summary


