

自1978年以来,中国40余年的经济增长、社会转型与空间重构,深刻影响了不同区域基本公共服务供需规模、供需结构与供需机制的持续演化。作为城市基本公共服务与生态系统的重要组成部分,城市公园绿地不仅是居民日常休闲娱乐和社交活动的重要场所,也是丰富与补充城市空间特色及功能、缓解“大城市病”的重要媒介[1]。21世纪以来,中国城市公园绿地建设长足发展且成效卓著,多数城市采取的“建筑优先,绿地填空”的发展方式使得城市公园绿地供给总规模得到显著提升,然而考虑不同区域城市发展基础与发展进程的显著差异,城市公园绿地服务供给依旧存在明显的不平衡、不充分等问题,城市公园绿地服务在兼顾供给“数量”和供给“质量”等方面均面临较大的挑战,这也成为了制约新型城镇化等国家战略实施的瓶颈之一[2]。
城市公园绿地服务供给及其空间布局等相关问题持续引发学界关注[3],研究内容聚焦时空演化特征[4]、驱动机制[5]、环境经济效应[6]与空间优化路径[7]等方面,研究范围涵盖了宏观区域尺度[8]、中微观城市及社区尺度[9]等多个维度。于宏观区域尺度,重点关注城市公园绿地发展水平评价[10]、公园绿地与城市经济发展的互动关系[11]、游憩服务质量及影响因素[12]等问题。在中国实行最严格的耕地保护制度背景下,城市建设用地的增量空间日趋紧张,城市公园绿地的供给压力不断加大[13]。相较于城市人口规模和社会经济发展水平的持续提升,公园绿地供给数量和供给质量始终处于滞后状态[14],人口增长与公园绿地供给失配现象日益突出[15]。于中微观尺度,主要聚焦典型城市公园绿地时空格局演化及供需机制[16]、公园绿地规划与布局调控[17]、公园绿地可达性与公平性评价[18]、公园绿地的社会经济及环境效应[19]等问题。例如,Fan等[20]通过冷热点分析等多元空间分析方法,探讨了上海市城市周边快速土地变化背景下的城市公共绿地可及性时空格局演变。仝德等[21]基于深圳市公园绿地空间矢量数据和手机信令数据,采用改进高斯两步移动搜索法对深圳公园绿地可达性进行了中微观尺度评价。Li等[22]通过基于出行行为的高斯两步移动搜索法在评估南京公园可达性的基础上,识别了其空间公平性的空间集聚模式。既有研究为把握典型城市公园绿地空间格局演化特征[23],刻画不同空间尺度下城市人口与绿地的异速生长关系[24]提供了重要的理论及方法支撑。但总体来看,现有成果对于城市公园绿地供需的长时序演化特征及区域差异刻画相对不足,对于其关键影响因素的识别与宏观驱动机制的凝练依旧欠缺。当前中国正处于推进国家治理体系和治理能力现代化的关键时期,包括城市公园绿地服务在内的基本公共服务均等化成为解决“不平衡、不充分”矛盾的关键着力点。面向城市基本公共服务均等化的实践导向,基于中国区域及城市发展差异,深化中国城市公园绿地供需的时空格局演化特征及其驱动机制研究愈加必要。
鉴于此,本文基于2000年以来中国地级市尺度城市公园绿地与社会经济面板数据,引入变异系数、探索性空间数据分析,刻画公园绿地供需的时空格局演化特征,采用计量经济模型考察公园绿地供需演变的驱动机制及其异质性,以期为完善中国城市公园绿地差异化供给提供研究支撑。尝试基于下述两个方面对既有文献形成补充:(1)整合较长时序的城市公园绿地及社会经济面板数据,基于中国地级以上城市人均公园绿地面积指标,定量刻画城市公园绿地供需时空格局演化特征,为辨识中国城市公园绿地供需的宏观格局及区域差异提供证据,对当前主要关注典型城市的中微观尺度研究形成补充。(2)采用经济计量模型揭示中国城市公园绿地供需时空格局演化的驱动机制及其区域异质性,丰富和深化城市公园绿地时空格局演化的驱动机制研究,弥补既有文献以区域或典型城市分析为主的不足,以期为不同区域城市公园绿地服务优化供给提供差异化的对策建议。
1 理论框架与研究假说
图1
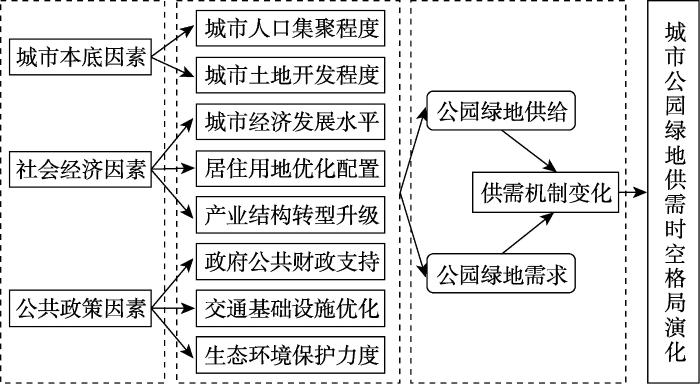
图1
城市公园绿地供需演化机制
Fig. 1
Evolution mechanism of supply and demand for urban park green space
(1)城市本底因素。人口是城市公园绿地等基本公共服务的主体和需求端,城市人口总量和集聚程度直接决定了人均公园绿地面积状况,其动态变化也会造成公园绿地供需格局和供需机制的演化。随着城镇化进程的持续推进,城市人口规模的快速增长也会带来对公园绿地等公共空间需求的持续扩张。但有限的城市建设用地增量空间对于公园绿地的规划建设具有明显的约束作用,这也决定了公园绿地的供给规模不可能无限制地增长。因此,城市人口集聚与城市土地开发程度分别从需求端和供给端影响公园绿地供需演化,其对于公园绿地供需格局演化具有限制性影响,据此,本文提出:
假说1:城市本底因素是影响城市公园绿地供需演化的限制性因素,城市人口集聚与城市土地开发程度对公园绿地供需演化具有负向影响。
(2)社会经济因素。区域经济发展驱动下的土地要素需求总量持续增加,同时催生了对于城市公园绿地、市政公用设施等生活性地类的强需求。尤其对于经济发展水平较高的区域,更加注重城市绿色公共空间的营造,通过完善城市公园绿地的多样化增长,推动自身城市功能的优化和空间质量的提升。城市居住用地供应及房地产开发和公园绿地的规划布局具有明显的伴生关系,呼应居民日益提升的住房品质需求,房地产商对于房地产周边配套公共空间也更加重视,这对于房地产周边社区公园的建设具有明显的带动作用。此外,随着城市产业结构的持续调整,尤其是现代服务业的快速发展,大量城市开始注重城市用地的社会效益与生态环境效益,逐渐形成城市公园绿地的协同规划与供给。据此,本文提出:
假说2:社会经济因素是型塑城市公园绿地供需演化的关键驱动力,经济发展水平提升、产业结构升级与居住用地优化配置对城市公园绿地供需演化具有正向影响。
(3)公共政策因素。城市公园绿地不仅具有休闲、文化、教育等社会功能,还具有净化环境、维持生物多样性、减轻城市热岛效应等生态功能[27]。区域环境保护力度的增强对于城市公园绿地供给规模和供给质量的提升具有重要的推动作用。同时,随着居民生活品质需求的日益提升,在政府公共财政支持下,城市公园休闲产品设施质量与各项基础设施建设水平不断提升,能够促进公园绿地服务质量、服务范围与空间布局的优化调整。城市交通基础设施线网及枢纽的建设对于城市公园绿地规划布局具有“廊道效应”,其在直接带动交通基础设施沿线及枢纽区域的附属公园绿地建设的同时,也通过提升公园绿地的交通通达度,间接促进公园绿地服务范围的增加及空间布局的完善[28]。据此,本文提出:
假说3:公共政策因素是优化城市公园绿地供需的重要推动力,政府公共财政支持、交通基础设施完善与环境保护力度提升对于公园绿地供需演化具有正向影响。
中国城市数量众多、区域差异显著。随着中国城镇化的持续推进,不同区域城市人口集疏格局持续演化,建设用地规模不断扩张,用地结构也频繁调整。不同区域城市社会经济发展的基础和进程各有差别,城市用地配置利益导向、总量和结构均存在显著差异,加之各地方政府在财政支出、环境规制等公共政策方面注意力的差异,均造成不同区域城市公园绿地供给规模与供给质量也不尽相同。基于此,本文进一步提出:
假说4:城市公园绿地供需演化由包括城市本底、社会经济与公共政策等在内的多维因素综合驱动,各因素的作用机制具有明显的区域异质性。
2 研究方法与数据来源
2.1 研究方法
2.1.1 变异系数
引入变异系数(Coefficient of Variance,CV)测算城市公园绿地供需的差异程度及演变趋势[29],CV可通过标准差与平均值之比以表征数据的离散程度。计算公式如下:
式中:σ为样本标准差;
2.1.2 探索性空间数据分析
(1)全局空间自相关分析
采用Global Moran's I指数测度城市公园绿地供需空间相关性的总体趋势。Moran's I取值一般在 [-1, 1] 之间,在给定显著水平下,Moran's I值>0表示整体格局呈显著空间集聚;Moran's I值<0表示整体格局呈显著空间分异;Moran's I值=0则表示随机分布,不具空间自相关性[30]。计算公式如下:
式中:Xi、Xj分别为i、j区域的属性值;n为研究对象总数(个);空间权重矩阵Wij表示研究对象在第i和第j两点间的链接关系,空间相邻为1,不相邻则为0;
(2)热点分析
为进一步分析区域内部属性相似集聚区的空间分布,引入
式中:空间权重矩阵
2.1.3 回归模型分析
为进一步厘清中国城市公园绿地供需演化的驱动机制,采用面板回归分析方法辨识影响城市公园绿地供需的关键因素,模型构建如下:
式中:PGpcit为各城市人均公园绿地面积(m2/人);t为年份;Xj为自变量;β0为常数项;βj为各自变量回归系数;
综合考察长时序城市公园绿地数据的可获取性与连续性,本文选择人均公园绿地面积(lnPGpc)作为被解释变量,用于表征城市公园绿地供需水平。依据前文理论框架并结合已有研究成果,选择一组城市特征变量作为解释变量。(1)城市土地开发程度(lnPCL),采用城市建设用地占城区面积比例表征;(2)城市人口集聚(lnPop),采用单位建成区面积常住人口数量表征;(3)城市经济发展水平(lnGDPpc),采用市辖区人均 GDP表征;(4)产业结构升级(lnIndus),采用产业结构层次法计算所得产业结构层次指数表征[32];(5)城市居住用地配置(lnRESpc),采用人均居住用地面积表征;(6)交通发展水平(lnRoad),采用城市道路密度表征;(7)地方政府财政支持(lnExpend),采用人均地方公共财政支出表征;(8)环境保护力度(lnEnvir),采用建成区绿化覆盖率表征[5]。为保证数据平稳性与消除异方差影响,对相关指标进行对数转换,指标说明如表1所示。
表1 变量描述性统计
Table 1
| 解释变量 | 变量名称 | 变量符号 | 定义 | 单位 |
|---|---|---|---|---|
| 被解释变量 | 城市公园绿地供需 | lnPGpc | 人均公园绿地面积 | m2/人 |
| 解释变量 | 城市土地开发程度 | lnPCL | 建设用地占城区面积比例 | % |
| 城市人口集聚 | lnPop | 建成区常住人口密度 | 万人/km2 | |
| 经济发展水平 | lnGDPpc | 城市人均GDP | 元/人 | |
| 产业结构升级 | lnIndus | 产业结构层次指数 | % | |
| 居住用地优化配置 | lnRESpc | 人均居住用地面积 | m2/人 | |
| 交通基础设施优化 | lnRoad | 城市道路密度 | km/km2 | |
| 政府公共财政支持 | lnExpend | 人均地方公共财政支出 | 万元/人 | |
| 生态环境保护力度 | lnEnvir | 建成区绿化覆盖率 | % |
2.2 数据来源
综合考察数据的可获取性与连续性,本文将研究时段确定为2000—2020年。选取数据面板较为完整的中国284个地级以上城市为研究对象,数据缺失严重且较难溯源的城市予以剔除处理。为揭示城市公园绿地供需演化的区域差异,将284个地级以上城市按照地理区域依次划分为东部、东北、中部和西部地区四组。研究所用数据包括城市公园绿地数据、相关城市环境及社会经济数据等。城市公园绿地数据来源于历年《中国城市建设统计年鉴》;相关社会经济数据来源于历年《中国城市统计年鉴》《中国城市建设统计年鉴》;同时通过各省市统计年鉴与统计公报等公开数据来源,以及EPS全球统计数据/分析平台数据进行补充与校核。鉴于个别年份数据缺失,综合考查数据缺失机制的不同,分别采用均值法和线性趋势法进行插补。为保证统计口径一致及数据可比,对相关社会经济数据进行平滑处理。
3 结果分析
3.1 中国城市公园绿地供需时空格局演化
3.1.1 时序特征演化
21世纪以来,中国城市公园绿地建设不断提速且成效显著,城市公园绿地总面积由2000年的14316 hm2增长至2020年的797912 hm2,人均城市公园绿地面积由2000年的3.69 m2/人大幅增加至2020年的14.78 m2/人,年均增长率分别达到8.97%与7.18%(图2a)。研究期内,各区域城市人均公园绿地面积均呈现上升态势,区域差异分化显著且具有明显的阶段性变化特征;东部城市人均公园绿地面积均值为11.99 m2/人,始终处于最高水平;西部与中部城市次之,分别为10.21 m2/人与10.06 m2/人;东北城市最低,仅为9.77 m2/人。21世纪初,大多数城市经济发展与基础设施建设尚处于起步阶段,城市整体公共服务水平均有待提升,公园绿地服务供给存在总量不足、人均面积较少的特点。2012年以后,西部城市公园绿地建设不断提速,人均公园绿地面积均值由11.80 m2/人快速上升至2020年的16.13 m2/人,先后超过东北和中部城市,达到全国平均水平以上。2010年以后,东北城市公园绿地建设速度逐渐趋缓,人均公园绿地面积与其他区域差距不断拉开。
图2
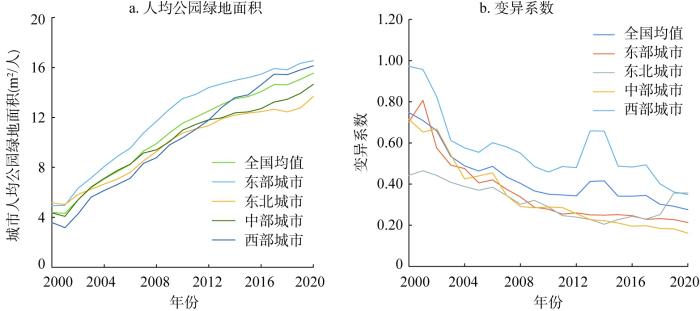
图2
2000—2020年中国城市人均公园绿地面积与变异系数变化
Fig. 2
Park green space per capita and variation coefficients in Chinese cities during 2000-2020
引入变异系数进一步刻画城市人均公园绿地面积整体及分组差异特征(图2b)。结果显示,整体变异系数由2000年的0.748大幅下降至2020年的0.276,表明城市人均公园绿地面积总体差异显著缩小。各区域城市人均公园绿地面积变异系数均呈现波动下降趋势。其中,西部城市变异系数始终处于最高水平,由2000年的0.957下降至2020年的0.350。东部城市和中部城市变异系数的变化趋势较为一致,分别由2000年的0.703和0.715波动下降至2020年的0.214和0.162。东北城市变异系数则呈现明显的“V”型变化趋势,由2000年的0.443下降至2014年的0.205后,又波动上升至2020年的0.357。近年来,东北地区城市常住人口持续外流与省会城市人口集聚效应叠加,不同城市人口—公园绿地供需格局加速分化,造成变异系数呈现上扬趋势。总体来看,伴随20余年城镇化水平的不断提升,中国城市公园绿地建设取得显著成效,区域间非均衡程度显著收敛。但囿于社会经济发展起步较晚、经济发展与城市建设基础薄弱,部分东北地区和中西部地区中小城市公园绿地规划建设水平始终偏低,这也造成不同区域之间差异水平依旧明显。
3.1.2 空间格局演化
(1)总体空间格局演变
图3展示了2000—2020年间中国城市人均公园绿地面积空间格局演变过程。研究期内,中国城市公园绿地供需状态持续改善,整体保持与经济社会发展相似的区域格局,维持了“东部地区高、中西部及东北地区偏低”的特征。2000年,城市公园绿地建设尚处于起步阶段,供给总量不足、人均供给量低是该时期的主要特点,大量城市公园绿地总面积和人均面积均处于较低水平。人均公园绿地面积次高值及以上城市(>15 m2/人)仅有6个,主要包括呼伦贝尔、乌兰察布、承德、临汾、池州等中小城市,具有人口规模小、人均公园绿地面积高的典型特征。大量城市均处于次低值及以下区间(<10 m2/人),而以北京、广州、武汉等为代表的超大特大城市,尽管城市公园绿地总面积位于全国前列,但囿于城市人口规模较大,人均公园绿地面积多处于中等水平。2001年5月,国务院发布了关于加强城市绿化建设的通知。在此背景下,各城市公园绿地规划建设均不断提速。2007年,人均公园绿地面积次高值及以上城市大幅增加至22个,逐渐形成点状扩散态势;次低值及以下城市显著减少至180个,依旧维持了连片分布的空间格局特征。“十八大”以来,随着生态文明建设的部署推进,住房和城乡建设部进一步出台《关于促进城市园林绿化事业健康发展的指导意见》,各城市公园绿地建设持续推进并得到大幅提升。2013年,近80%的城市人均公园绿地面积已突破10 m2/人;次低值及以下城市大幅减少至80个,范围逐渐收缩至中西部地区。截至2020年,次低值及以下城市仅有9个,仍然以经济欠发达的东北和中西部城市为主。
图3
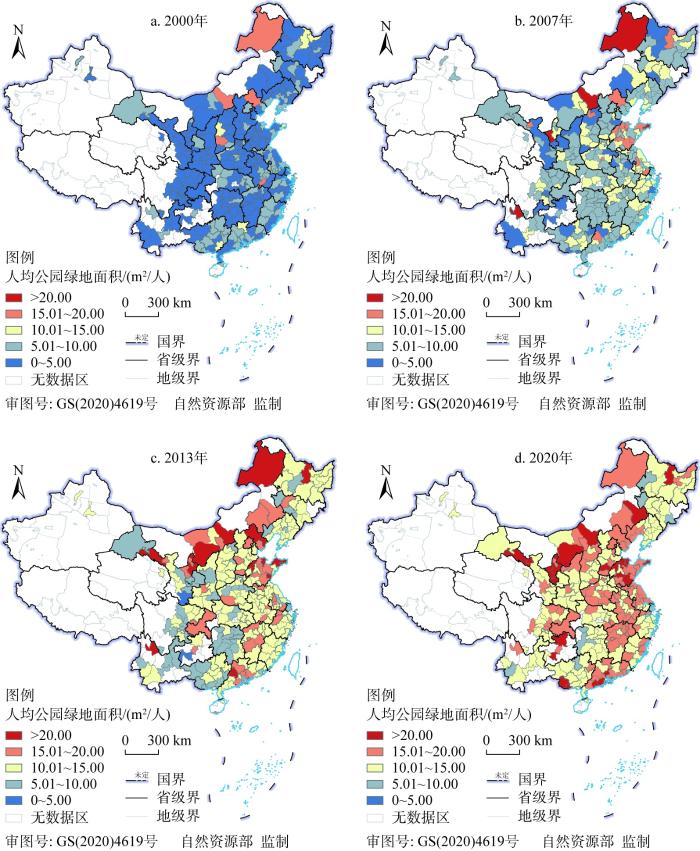
图3
2000—2020年中国城市人均公园绿地面积时空格局演变
注:本图基于自然资源部标准地图服务系统下载的标准地图制作,底图无修改,下同。
Fig. 3
Spatio-temporal patterns of park green space per capita in Chinese cities during 2000-2020
(2)空间关联特征演变
通过全局Moran's I指数刻画中国城市公园绿地供需的空间自相关特征(表2)。研究期内全局Moran's I指数均>0,表明中国城市人均公园绿地面积存在较强的空间正相关关系。从变化趋势来看,全局Moran's I指数值由2000年的0.086波动上升至2020年的0.119,峰值为2015年的0.224,整体呈现出“低—高—低”的变化趋势,表明研究期内城市人均公园绿地面积整体空间集聚特征显著增强。全局Moran's I指数的变化幅度不大,说明中国城市公园绿地供需格局具有一定的时序惯性和空间稳定性。
表2 2000—2020年中国城市人均公园绿地面积全局Moran's I指数
Table 2
| 年份 | Moran's I | 期望值 | Z(I) | P(I) |
|---|---|---|---|---|
| 2000 | 0.086 | -0.004 | 3.8753 | 0.004 |
| 2005 | 0.067 | -0.004 | 3.054 | 0.007 |
| 2010 | 0.114 | -0.004 | 5.083 | 0.001 |
| 2015 | 0.224 | -0.004 | 10.003 | 0.001 |
| 2020 | 0.119 | -0.004 | 5.116 | 0.002 |
通过局部
图4
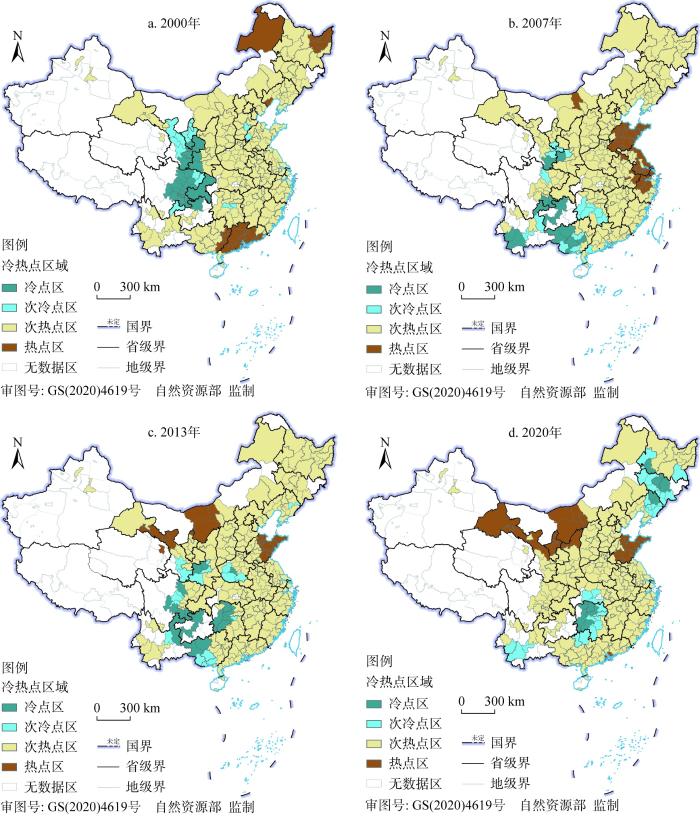
图4
2000—2020年中国城市人均公园绿地面积冷热点格局分析
Fig. 4
Spatial agglomeration patterns of park green space per capita in Chinese cities during 2000-2020
3.2 中国城市公园绿地供需演化的驱动机制
3.2.1 基准回归分析
基于前文理论框架,进一步分析中国城市公园绿地供需演化的驱动机制。鉴于人均公园绿地面积随时间和城市不断变化,同时结合Hausman检验结果,实证检验采用面板数据固定效应模型,控制城市和时间固定效应。考虑到生态文明建设战略于“十八大”以后的深入推进,本文将样本划分为2000—2012年、2013—2020年两个阶段。就基准回归结果看,除城市土地开发程度(lnPCL)、城市人口密度(lnPop)与产业结构升级(lnIndus)外,其他各因素均对城市人均公园绿地面积呈现显著的正向影响,但不同因素的影响程度具有明显的阶段差异(表3)。
表3 基准回归结果
Table 3
| 变量 | (1) 全样本 | (2) 2000—2012年 | (3) 2013—2020年 |
|---|---|---|---|
| lnPCL | -0.0147 | -0.0613*** | 0.0094 |
| (0.0124) | (0.0214) | (0.0118) | |
| lnPop | -0.448*** | -0.445*** | -0.352*** |
| (0.0189) | (0.0250) | (0.0237) | |
| lnGDPpc | 0.131*** | 0.100*** | 0.0513*** |
| (0.0174) | (0.0287) | (0.0163) | |
| lnIndus | 0.207 | 0.354 | 0.156 |
| (0.1396) | (0.2165) | (0.1472) | |
| lnRESpc | 0.144*** | 0.188*** | 0.0918*** |
| (0.0150) | (0.0204) | (0.0177) | |
| lnRoad | 0.198*** | 0.218*** | 0.112*** |
| (0.0152) | (0.0210) | (0.0170) | |
| lnExpend | 0.0319*** | 0.0154 | 0.0318*** |
| (0.0115) | (0.0169) | (0.0108) | |
| lnEnvir | 0.541*** | 0.459*** | 0.621*** |
| (0.0170) | (0.0223) | (0.0297) | |
| _cons | -3.297*** | -3.557*** | -1.977** |
| (0.7732) | (1.1845) | (0.8364) | |
| 时间/城市 | 控制 | 控制 | 控制 |
| R2 | 0.815 | 0.807 | 0.833 |
| N/个 | 5964 | 3692 | 2272 |
注:***、**、*分别为1%、5%、10%显著水平,括号中的数字表示标准误差,下同。
(1)城市本底因素。城市人口密度(Pop)在全样本及分阶段估计结果中均呈现显著的负向影响,城市土地开发程度(lnPCL)在第一阶段具有显著的负向影响,该结果验证了假说1。与罗文斌等[5]的研究结论一致,作为影响公园绿地服务供需关系和供需机制的关键之一,城市人口集聚会造成人均公园绿地供给比率的下降,对公园绿地供给带来显著的负向压力。但有限的城市建设用地增量空间对于公园绿地的规划建设具有明显的约束作用,这也决定了公园绿地的供给规模不可能无限制增长。
(2)社会经济因素。经济发展水平提升(lnGDPpc)与居住用地优化配置(lnRESpc)在全样本及分段估计中均呈现显著的正向影响,产业结构升级(lnIndus)并未表现预期的正向影响,该结果仅验证假说2的部分内容。经济发展水平提升是完善公共服务设施建设的基础,能够给直接推动城市公共服务优化供给。城市居住用地与公园绿地具有紧密的关联关系,居民对于高品质房地产商品的需求不断提高,势必会带动住宅周边公园绿地的配套规划,这在一定程度上助推了城市公园绿地供给水平的提高。相较于居住用地与工业用地等生产性地类,公园绿地所能产生的经济效益相对有限。城市发展初期往往盲目追求土地经济效益,产业用地的供应会严重挤压公共服务用地供给,因而造成城市公园绿地供给相对不足。
(3)公共政策因素。政府公共财政支持(lnExpend)在全样本及第二阶段估计结果中具有正向影响,生态环境保护力度(lnEnvir)与交通基础设施完善(lnRoad)在全样本及分阶段估计结果中均表现出显著的正向影响,该结果验证了假说3。随着居民对于城市公共空间品质需求的不断提升,政府公共财政支持对于城市公园绿地供需水平的正向推动作用不断凸显。21世纪以来,各区域环境保护力度不断加大,有效推动了公园绿地供给规模的增加和供给质量的优化。尤其自“十八大”以后,生态文明建设的深入实施进一步助推了城市公园绿地整体服务水平的提升。交通基础设施建设在带动新增公园绿地规划的同时,也提升了公园绿地的交通通达度,对于城市公园绿地服务水平的提升具有显著的正向驱动作用。
3.2.2 区域异质性分析
进一步分组探讨各因素影响城市公园绿地供需演化的区域异质性。根据表4分区域回归结果,归因于不同区域在城市本底、社会经济与公共政策等多方面的显著差异,各因素对不同区域城市公园绿地供需演化的影响存在明显不同,该结果验证了假说4。
表4 基于不同区域的分组模型估计结果
Table 4
| 变量 | (1) 全样本 | (2) 东部地区 | (3) 东北地区 | (4) 中部地区 | (5) 西部地区 |
|---|---|---|---|---|---|
| lnPCL | -0.0147 | -0.0736*** | 0.0138 | 0.0319 | -0.00153 |
| (0.0124) | (0.0170) | (0.0289) | (0.0213) | (0.0353) | |
| lnPop | -0.448*** | -0.466*** | -0.0727 | -0.553*** | -0.340*** |
| (0.0189) | (0.0290) | (0.0500) | (0.0409) | (0.0387) | |
| lnGDPpc | 0.131*** | 0.0999*** | 0.0389 | 0.0717** | 0.217*** |
| (0.0174) | (0.0317) | (0.0322) | (0.0326) | (0.0409) | |
| lnIndus | 0.207 | 0.771*** | -0.130 | -0.727*** | 0.314 |
| (0.1396) | (0.2886) | (0.2153) | (0.2459) | (0.2977) | |
| lnRESpc | 0.144*** | 0.0769*** | 0.0630 | 0.0782*** | 0.275*** |
| (0.0150) | (0.0207) | (0.0387) | (0.0301) | (0.0331) | |
| lnRoad | 0.198*** | 0.166*** | -0.135*** | 0.216*** | 0.243*** |
| (0.0152) | (0.0236) | (0.0362) | (0.0275) | (0.0325) | |
| lnExpend | 0.0319*** | 0.0787*** | 0.0100 | -0.00544 | 0.0733*** |
| (0.0115) | (0.0227) | (0.0184) | (0.0213) | (0.0246) | |
| lnEnvir | 0.541*** | 0.635*** | 0.244*** | 0.695*** | 0.463*** |
| (0.0170) | (0.0503) | (0.0434) | (0.0341) | (0.0281) | |
| _cons | -3.297*** | -6.362*** | 1.528 | 2.267* | -5.345*** |
| (0.7732) | (1.5453) | (1.2472) | (1.3759) | (1.6549) | |
| 时间/城市 | 控制 | 控制 | 控制 | 控制 | 控制 |
| R2 | 0.815 | 0.817 | 0.839 | 0.813 | 0.824 |
| N/个 | 5964 | 1764 | 714 | 1722 | 1764 |
具体来看,西部地区基本符合整体规律。东部地区产业结构升级(lnIndus)呈正向显著,城市土地开发程度(lnPCL)呈负向显著,其他各因素均与全样本回归结果一致。东部地区产业结构相对合理,产业用地与公共服务用地比例较为协调。大量的人口集聚不断为东部城市发展建设赋能,但也对城市公园绿地等基本公共服务供给造成了更大压力。此外,东部地区城市土地开发程度较高,新增建设用地指标不断收紧,这对加大公园绿地供给起到了明显的约束作用。中部地区政府公共财政支持(lnExpend)不显著,产业结构升级(lnIndus)则呈显著的负向影响,其他各因素均与全样本回归结果一致。大量中部城市尚未形成政府公共财政支持对城市公园绿地优化供给的有效支撑。同时,由于大量资源型城市地处中部地区,产业结构与用地结构失调也显著阻滞了城市公园绿地等公共空间的优化供给。
对于东北地区而言,仅环境保护力度(lnEnvir)呈正向显著,交通基础设施完善(lnRoad)呈负向显著,其他各因素均不显著。近年来,中国区域发展的极化效应持续增强,东南沿海城市和主要城市群的素虹吸效应不断凸显,东北地区则出现不同程度的人口流失现象。尽管人口密度下降一定程度上缓解了东北城市公园绿地的供需压力,但由于人口流失所引发的经济下滑、城市活力下降、综合交通发展水平滞后等连锁问题则成为制约公园绿地供需水平提升的主要瓶颈。
3.2.3 稳健性检验
为检验模型的稳健性及缓解内生性问题,本文分别通过改变样本、更换被解释变量与将各解释变量滞后一期等方法进行多重稳健性检验。(1)鉴于北京、上海、天津、重庆四座直辖市可能产生的特殊影响,通过剔除直辖市数据以进行稳健性检验。(2)采用城市人均公园面积表征各城市公园绿地供需水平,通过更换被解释变量以检验模型稳健性。(3)对于变量遗漏和反向因果所导致的内生性问题,将各解释变量滞后一期再次进行稳健性检验。如表5模型2~模型4所示,在稳健性检验与剔除可能存在的部分内生性后,系数显著性及符号均未发生较大变化,表明基准回归结果具有较强的稳健性。
4 结论与讨论
4.1 结论
基于2000年以来中国地级以上城市公园绿地及社会经济数据,引入变异系数、探索性空间数据,分析刻画城市公园绿地供需的时空格局演化特征,采用计量经济模型考察城市公园绿地供需演化的宏观驱动机制及其区域异质性。主要结论如下:
(1)21世纪以来,中国城市公园绿地供给规模大幅增加,人均城市公园绿地面积显著提升。不同区域城市人均公园绿地面积均呈现整体上升态势,东部地区城市人均公园绿地面积始终处于最高水平,西部地区城市公园绿地供需不断优化,东北地区城市公园绿地建设速度于2010年以后逐渐趋缓。
表5 稳健性检验
Table 5
| 变量 | (1) 基准回归 | (2) | (3) | (4) |
|---|---|---|---|---|
| lnPCL | -0.0147 | -0.0115 | -0.0192 | -0.0171 |
| (0.0124) | (0.0126) | (0.0214) | (0.0133) | |
| lnPop | -0.448*** | -0.444*** | -0.580*** | -0.286*** |
| (0.0189) | (0.0191) | (0.0324) | (0.0196) | |
| lnGDPpc | 0.131*** | 0.129*** | 0.107*** | 0.148*** |
| (0.0174) | (0.0175) | (0.0299) | (0.0183) | |
| lnIndus | 0.207 | 0.217 | 1.460*** | 0.152 |
| (0.1396) | (0.1406) | (0.2397) | (0.1468) | |
| lnRESpc | 0.144*** | 0.144*** | 0.127*** | 0.103*** |
| (0.0150) | (0.0151) | (0.0257) | (0.0156) | |
| lnRoad | 0.198*** | 0.197*** | 0.217*** | 0.107*** |
| (0.0152) | (0.0155) | (0.0261) | (0.0159) | |
| lnExpend | 0.0319*** | 0.0339*** | 0.121*** | 0.0145 |
| (0.0115) | (0.0116) | (0.0197) | (0.0122) | |
| lnEnvir | 0.541*** | 0.538*** | 0.740*** | 0.486*** |
| (0.0170) | (0.0171) | (0.0292) | (0.0176) | |
| _cons | -3.297*** | -3.343*** | -11.95*** | -2.454*** |
| (0.7732) | (0.7781) | (1.3277) | (0.8159) | |
| 时间/城市 | 控制 | 控制 | 控制 | 控制 |
| R2 | 0.815 | 0.814 | 0.750 | 0.779 |
| N/个 | 5964 | 5880 | 5964 | 5680 |
(2)中国城市公园绿地供需非均衡程度显著收敛,区域之间差异程度依旧明显。西部地区变异系数始终处于最高水平,东北地区差异程度于2014年以后出现小幅反弹。囿于社会经济发展起步较晚与城市建设基础薄弱等原因,部分东北地区和中西部地区中小城市人均公园绿地面积始终偏低,成为阻滞公园绿地均等化发展的主要症结。
(3)中国城市公园绿地供需格局和供需机制的持续演化由城市本底、社会经济与公共政策等多维因素综合驱动。城市人口集聚与土地开发程度对城市公园绿地优化供给存在负向约束作用,经济发展水平提升、产业结构升级与居住用地优化配置具有重要的推动作用,政府公共财政支持、交通基础设施完善与环境保护力度提升具有显著的正向影响。归因于不同区域城市经济基础和发展进程的显著差别,各因素对城市公园绿地供需演化的影响机制具有明显的区域异质性。
4.2 讨论
本文聚焦中国城市尺度公园绿地供需问题,采用城市人均公园绿地面积指标刻画公园绿地供需的时空格局演化特征,为厘清中国城市公园绿地供需格局演化及其驱动机制提供了有益参考。基于上述研究结论,提出以下对策建议:
(1)协调人口增长与公园用地供给的动态关系,破解区域供给不平衡不充分问题。21世纪以来的二十余年内,中国城市公园绿地建设取得了显著成效,但不同区域之间的差异依旧明显,公园绿地服务供给不平衡不充分的问题始终突出。大面积的公园绿地服务范围重叠会造成公共资源浪费,区域与城市内部人口集聚格局不断变化,应当转变规划思路、加强前瞻布局,基于对城市人口数据的精细化监测,系统性考量区域人口、资源、产业、交通等因素,结合城市公园绿地服务半径、可达性监测,完善与优化城市公园绿地服务供给和空间布局,提升城市公园绿地服务的效率和质量。
(2)因地制宜、因城施策增加公园绿地供给总量,创新供给模式和供给形式。东部城市与部分超大特大城市建设用地增量空间不断趋紧,大规模公园绿地建设已难以为继。应当通过存量空间更新改造等多元化措施创新公园绿地供给模式,针对老城区等城市薄弱地区和环节,可开展“留白增绿”、提升品质的城市修补工作,通过小微绿地等方式因地制宜地增加绿地游憩空间。大中城市在城市扩容的进程中,应当吸取特大超大城市发展过程的经验和不足,科学规划城市公园绿地空间布局,注重公园绿地服务供给数量和质量相协调。中西部地区与东北地区的部分中小城市是公园绿地供给的薄弱点,尤其大量东北城市已逐渐出现明显的人口流失现象。人口收缩背景下,应当推动闲置城市用地向公园绿地等公共空间转变,促进城市空间质量提升和绿色转型。
(3)破除体制机制障碍,完善公园绿地市场化运维机制。在确保政府投入的基础上充分发挥市场机制的作用,持续推动基本公共服务供给方式创新。在政府主导推进基本公共服务体系建设的前提下,需要采取差异化的服务供给模式,进一步引导社会、市场力量积极参与,发挥好联动效应。一方面,政府要立足基本职责,着力做好政策制定实施、资金保障等工作;另一方面,要充分发挥市场在资源配置中的决定性作用,按照政府职能转变的要求,进一步理顺政府和市场主体、社会组织的关系,鼓励引导社会各方积极参与,因时、因地制宜地加大公共服务购买力度,更好地激发市场活力。
需要指出的是,囿于大尺度、长时序公园绿地数据较难获取,尽管采用人均公园绿地面积指标直观刻画城市公园绿地服务供需的时空格局特征具有较强的代表性,但缺乏对城市公园绿地空间布局、可达性等内涵的描述,往往掩盖了城市公园绿地规划建设的内部信息。随着公园绿地供需及均等化等内涵的不断丰富,未来有必要基于更丰富的视角和多源数据展开城市公园绿地供需演化的量化分析。
参考文献
城市绿地空间供需评价与布局优化: 以徐州中心城区为例
DOI:10.13249/j.cnki.sgs.2019.11.011
[本文引用: 1]

以徐州市为例,基于0.25 m空间分辨率的Google影像与网络爬虫技术获取空间绿地与居住小区人口;采用两步移动搜索法评价小区尺度的绿地供给情况,结合相关标准分析其空间供需状况;为最大限度减少绿地供给不达标小区数量,用空间启发式算法搜索合适的低效工业地块转换为绿地得到优化的绿地布局。研究发现:徐州中心城区绿地供需存在空间不公平,39%的小区绿地供给小于20.1 m <sup>2</sup>的需求标准,供给饱和区主要在云龙湖与泉山森林公园片区,不足区则主要在老城与金山桥片区;绿地空间配置应与人口空间分布保持一致,因此要在高层住宅集聚区配置大中型公园绿地;在空间上选取合适数量与位置的低效工业地块转换为绿地,转换431 hm <sup>2</sup>的工业地块可使绿地不达标小区数目减少37个,而得到优化的绿地空间布局。
Spatial supply-demand evaluation and layout optimization for urban green space: A case study of Xuzhou central district
DOI:10.13249/j.cnki.sgs.2019.11.011
[本文引用: 1]
Since urban green space (UGS) can provide significant ecological and social benefits, it is considered to have important impacts on urban environment and inhabitants’ quality of life. Thus, UGS allocation has become the focus of urban planning and the main avenues for low-carbon city and sponge city building. However, the population and green space data used by existing studies for UGS allocation were not adequately accurate, and the results were course with limited referential value. In addition, existing studies rarely go further step to study layout optimization of the newly increased green space. The main work of this research is to evaluate the supply and demand for UGS at community level, then proposing an optimization approach to promote the level of the green deficit communities to get a more equal green space layout. Firstly, Google image with resolution of 0.25 m was used to get different green land distributions, and Web Crawling method was employed to obtain population of communities from the real estate transaction websites such as Anjuke, Fang.com and Tencent's property. Secondly, the UGS supply of 520 communities was evaluated with the two-step floating catchment area method, and then the supply-demand match and its spatial variation were analyzed according to relevant demand standards. Lastly, in order to minimize the number of green deficit communities, a spatial heuristic model was established. With this model, the inefficient industrial parcels with proper quantity and location were selected to be converted into green space to generate optimized green space layout. The results are as follows: 39% communities has a green space supply less than the planning standard (20.1 m 2). Thus, the supply-demand correspondence of green space in central urban area of Xuzhou is not equal. While a large proportion of supply saturated communities are located in Yunlong Lake and Quanshan Park districts, most supply deficit communities are located at old urban areas and along Huaihai Road down to Jinshanqiao district. Since the green space distribution should be consistent with the population spatial distribution, it is necessary to configure large and medium-sized green parks in high-rise residential cluster areas rather than allocating most of the land to commercial and residential uses for “land finance” purpose. As a result of the UGS layout optimization with spatial heuristic algorithm, green space supply deficit communities decreased by 37 with the cost of 431 hm 2 inefficiency industrial plots being converted into green land. This study can provide scientific reference and technical support for UGS allocation during urban planning. It can also provide reference for the choices of residential communities for home buyers from the perspective of accessible UGS quantity.
中国大城市公园绿地可达性的公平性研究: 以武汉市中心城区为例
DOI:10.18306/dlkxjz.2022.04.007
[本文引用: 1]
城市公园绿地(UPGS)是城市生态系统的重要组成部分,良好的UPGS可达性可促进城市宜居、提高居民福祉。进入新时代,在建设“生态文明”和“人民城市”的背景下,关注中国大城市UPGS可达性的公平性问题意义重大。论文以武汉市中心城区为研究区域,从供给、需求2个方面综合测度可达性,从局部、整体角度评估了UPGS可达性的空间特征,并进一步探究了可达性与居民社会经济条件之间的关系,以此探讨社会公平性。研究发现: ① 区域型、全市型和综合型UPGS可达性空间分布优于社区型UPGS可达性空间分布;② UPGS的总体可达性在中心城区呈现“核心—边缘”逐渐递减的空间形态,UPGS数量多、密度大的区域的社区具有更高的可达性水平; ③ UPGS可达性与居民社会经济条件之间存在空间正相关关系,房价较高的社区,居民的UPGS可达性也较高,UPGS可达性反映的社会不平等现象明显。建议未来应重视更加精细化的UPGS布局优化和调控,不同区域和社会群体需求采取选择性策略,落实精准施策。论文弥补了现有研究的不足,应用大数据和新技术优化指标数据源,采用UPGS面积、生态系统服务价值、游憩设施和安全条件等指标精细化测度公园品质,并考虑了多种交通模式、实时路况以及不同年龄群体的选择偏好等因素,综合测度可达性,创新了研究方法;从城市经济结构视角出发,从房价入手探讨UPGS的公平性问题,拓展了已有分析框架,为中国大城市的基础设施布局和空间资源配置提供了支撑。
The equity of urban park green space accessibility in large Chinese cities: A case study of Wuhan city
DOI:10.18306/dlkxjz.2022.04.007
[本文引用: 1]
Urban park green space (UPGS) is an important part of the urban ecosystem. Good accessibility of UPGS can promote urban livability and improve residents' well-being. It is important to evaluate the fairness of UPGS accessibility. Taking the central city of Wuhan as a study case and 2020 as the research time period, this study measured the accessibility from the supply and demand aspects, evaluated the spatial characteristics of the accessibility of UPGS from both the local and global perspectives, and further explored the relationship between accessibility and residents' social and economic conditions, in order to explore its social equity. Our findings include: 1) The spatial distribution of accessibility of regional, city, and comprehensive level UPGS is better than that of community level UPGS. 2) The spatial pattern of the overall accessibility of UPGS in the central city area of Wuhan gradually decreases from the core to the periphery. The communities with more UPGS and higher UPGS density show a higher level of accessibility. 3) There is a positive spatial correlation between UPGS accessibility and residents' socioeconomic conditions. The communities with higher housing prices also have higher UPGS accessibility. Thereby we identified marked social inequality in terms of the UPGS accessibility for Wuhan. It is recommended that in the future we should be further concerned with the optimization and regulation of the layout of UPGS with more nuance. While implementing the universal strategies, we should adopt targeted strategies and implement precise policies for the needs of different regions and different social groups. This study contributes to the literature in several ways. Using multi-source data and new technology to optimize indicators and data sources, the quality of parks was measured from UPGS area, ecosystem service value (ESV), recreation facilities, and safety conditions and various traffic patterns, real-time conditions, and selection preferences of different age groups, and so on were considered. At the same time, this study paid attention to the social inequality of accessibility, which enriches the empirical content and case materials and provides a scientific basis for the layout of urban infrastructure and the practice of environmental justice.
城市公园用地增长的时空分异及其驱动因素: 基于湖南省城市面板数据的实证分析
Spatial and temporal differentiation of urban park land growth and its driving factors: Empirical analysis based on urban panel data of Hunan province
Does economic development improve urban greening? Evidence from 289 cities in China using spatial regression models
DOI:10.1007/BF00394211 URL [本文引用: 1]
A spatial-temporal analysis of urban parkland expansion in China and practical implications to enhance urban sustainability
In response to serious environmental and socio-cultural challenges brought about by fast urbanization, the concept of a sustainable city emphasizes the quality of life of urban residents, assuring the importance of parkland provision in urban development. Despite China’s fast urban expansion in recent decades, scant attention has been paid to the development pattern of urban parkland in China and its implications toward urban sustainability. Engaging official data from government sources, this study conducted a spatial-temporal analysis of urban parkland in China. Results support the overall fast increase of urban parkland provision in China with a clear regional disparity. Moreover, the shift of development momentum from the east to the west has been identified in the recent decade. The status of economic development, the progress of urbanization, and the level of urban development investments are identified as key influential factors influencing the temporal changes of urban parkland in China. With the increasing demand for urban parkland and its important role in ensuring urban sustainability, recommendations to improve urban park development in China are proposed, including integrating urban parkland in urban land use management with specific planning guidelines, establishing a dynamic urban parkland monitoring system, incorporating both national and regional policy frameworks catering for both national standards and regional preferences, and shifting urban development investments with more emphasis on urban maintenance expenditure.
Assessing the equity of accessibility to urban green space: A study of 254 cities in China
DOI:10.3390/ijerph19084855
URL
[本文引用: 1]
Urban green space has environmental benefits of purifying the air, reducing the heat island effect and providing the social and economic benefits of rest places and social platforms. An integrated and organized green space system is important for fully realizing the positive functions of an urban ecosystem. Previous studies have considered green space supply and demand, but few studies have examined large-scale, diverse and small-scale systems, making it difficult to conduct a comparative study of urban green space accessibility and equity under the same conditions (such as data sources and calculation methods). Using the two-step floating catchment area method, this study evaluates the equity of 254 urban green spaces in China within four ranges of accessibility: 1 km, 2.5 km, 5 km and 10 km. The study also considers urban house price in the research. The results show the following: (1) There are large differences in the accessibility of green space between different cities in China. Within the accessibility threshold of 10 km, the city with the most accessible urban green spaces has an accessibility level that is 27,813 times that of the city with the lowest accessibility. (2) Within the range of walking/cycling, there are significant inequalities in green space access in the 254 cities; the inequality of green space accessibility in most of the studied cities is at the “dangerous” level. (3) The two-step floating catchment area method indicates that the social superiority (high social class) represented by high housing prices is associated with a greater opportunity to access urban green space services. This paper highlights the main problems associated with the accessibility of urban green space in China and proposes targeted development recommendations. These recommendations provide a reference for urban managers to develop effective green space development policies and realize the optimal allocation of urban green space.
基于改进两步移动搜索法的上海市黄浦区公园绿地空间可达性分析
DOI:10.18306/dlkxjz.2021.05.005
[本文引用: 1]
为解决高密度城市公园绿地供需不平衡的问题,论文提出了一套改进的两步移动搜索模型,并以上海市黄浦区为例,对其现有公园绿地进行步行条件下的空间可达性分析。首先从网络爬取研究范围内居住小区POI信息,将其聚合在边长100 m的正六边形蜂窝网内,计算得到每个人口单元的人数及人口密度,并利用百度地图API路径规划接口爬取各供给点和需求点间基于实时路况的出行时间;其次,以黄浦区2019年底已建公园绿地为例,从居住区人口需求、可达性分级、冷热点和盲区分析4个方面对其供需配置进行量化分析,结果表明,黄浦区公园绿地可达性水平整体北高南低,和人口密度分布呈负相关,存在供需错位问题,且仍有9.16%的显性盲区和16.5%的隐性盲区亟待消除。研究结果为进一步优化绿地空间布局和选址提供指导依据;最后从适度增量、盘活存量、社区共治3个方面提出建议,以期为黄浦区绿化“十四五”规划提供理论支持。
Spatial accessibility of park green space in Huangpu district of Shanghai based on modified two-step floating catchment area method
DOI:10.18306/dlkxjz.2021.05.005
[本文引用: 1]
In order to solve the problem of unbalanced supply and demand of park green space in high density cities, this study used a Gaussian based two-step floating catchment area method to analyze the spatial accessibility of existing park green space in Huangpu District of Shanghai, under walking conditions. First, we extracted the point of interest (POI) data of residential areas from the Internet and aggregated them into a 100 m long hexagonal cellular network to calculate the number of people and population density, then through the Application Programming Interface (API) of Baidu Map we extracted the travel time between supply and demand points based on actual road conditions. Second, the paper took the park green space built by the end of 2018 in Huangpu District of Shanghai as an example, and considered the four aspects of residents' demand, accessibility classification, cold and hot spots, and blank areas. The results show that the accessibility level of park green space in Huangpu District is higher in the north and lower in the south, which is negatively correlated with the population density distribution. The dominant blind areas (9.16% of the total area) and the recessive blind areas (16.5% of the total area) should be eliminated. This study made a quantitative analysis on the supply and demand allocation, to provide guidance for the further optimization of green space layout and site selection. Finally, recommendations were made from three aspects of "increasing green space appropriately", "strengthening the quality of existing green space" and "community co-governance", in order to provide theoretical support for the Fourteenth Five-Year Plan of greening Huangpu District.
中国城市公园综合发展水平评价及障碍度分析
Evaluation of urban parks on comprehensive development level and obstacle degree in China
DOI:10.1016/S0921-8009(00)00263-9 URL [本文引用: 1]
基于动态计量模型的我国公园绿地面积与城市人口互动关系
The interactive relationship between park green space area and urban population in China: Based on dynamic econometric model
中国城区公园绿地面积与人口数量、建设用地面积演变的脱钩关系研究
Decoupling relationship of the evolution of urban park green space area with population quantity and construction land area in Chinese urban areas
Temporal trend of green space coverage in China and its relationship with urbanization over the last two decades
长三角地区城市人口—绿地面积异速增长特征及驱动机制
DOI:10.11821/dlyj020201111
[本文引用: 1]
人口城镇化的快速推进与生态城镇化的建设滞后是中国快速城镇化进程中面临的重要问题。以长三角地区城市人口与绿地面积为研究对象,构建城市人口-绿地面积异速增长模型分析2000—2018年两者关系的时空变化规律,并运用地理探测器模型揭示异速增长的驱动机制。结果表明:① 长三角地区城市人口呈加速增长态势,绿地建设增长缓慢,城市人口-绿地面积异速关系逐渐由人地基本协调型转变为人口扩张弱型,2000—2008年多数城市表现出绿地扩张的特征,2009—2018年则转变为人口扩张的特征。② 教育投入度、人口集中度、设施供给度、土地开发度和对外开放度是影响长三角地区城市人口-绿地面积异速增长的主要因子,双因子交互解释力均高于单因子,各因子间的影响具有协同增强的特征。③ 长三角地区城市人口-绿地面积异速增长是行政力、市场力和外资力共同驱动的结果,三种驱动力彼此联系、协同作用,主导驱动力逐渐由行政力转变为市场力。
The characteristics and driving mechanism of allometric growth of urban population and green space area in the Yangtze River Delta Region
DOI:10.11821/dlyj020201111
[本文引用: 1]
The rapid development of population urbanization and the lag of ecological urbanization are major problems in the process of China's rapid urbanization. This paper, taking the urban population and green space area in the Yangtze River Delta (YRD) as the research object, constructs an urban population and green space area allometric growth model to analyze the spatial and temporal variations of the relationship between the two from 2000 to 2018, and uses the geographic detector model to reveal the driving mechanism of the allometric growth. The results show that: (1) The urban population in the study area is increasing rapidly, while the green space construction land is growing slowly. The allometric relationship between urban population and green space area in the region has gradually changed from the coordination of human and land to population expansion. Most cities are characterised by green space expansion from 2000 to 2008, but by population expansion from 2009 to 2018. (2) Education input, population concentration, facility supply, land development, and external development degree are the main factors affecting the allometric growth of urban population and green space area in the YRD. The interactive explanatory power of the two factors is higher than that of the single factor, and the influence among the factors is characterized by synergistic enhancement. (3) The allometric growth of urban population and green space area in the YRD is the result of the joint drive of administrative force, market force and foreign capital. The three driving forces are interrelated and synergistic, and the leading driving force is gradually transformed from administrative force to market force.
Spatiotemporal dynamics of urban parks and their driving forces in Xi'an, China from 1949 to 2015
DOI:10.1108/OHI-03-2017-B0023
URL
[本文引用: 1]
Urban parks play a key role in recreational activities, public health, and ecosystem services in urban areas. Using GIS and Fragstats, this study investigated the spatiotemporal dynamics of urban parks in Xi'an, China from 1949 to 2015 and the corresponding driving forces. The results show that the number and area of parks in Xi'an increased constantly during this period, especially from 2000 to 2015. Up to 2015, small green spaces, usually adjacent to streets, occupied the largest proportion among all types of parks. Archaeological parks were the largest in total area, but wetland parks were leading in average size of a single park. The density of parks was negatively correlated with their distance to the Clock Tower at the center of Xi'an. The dynamics of urban parks in highly urbanized areas were significantly different from that of their counterparts in suburban areas. Driving forces such as urban planning, urbanization and green space policies, and milestone events in the city's development jointly had a great effect on the distribution of parks in Xi'an. The research outcomes will support the upcoming Green Space Planning of Xi'an and benefit the pursuit of sustainability and human wellbeing.
高密度城区小微型公园绿地布局调控方法
Mini-park layout formation method in high-density cities
Modelling accessibility to urban green areas using open earth observations data: A novel approach to support the urban SDG in four European cities
DOI:10.3390/rs13030422
URL
[本文引用: 1]
Cities are recognised as key enablers for the world’s sustainable future. Urban sprawl and inefficient use of land are important issues significantly impacting the provision and use of open green spaces. The United Nations Sustainable Development Goal (SDG) indicator 11.7.1 aims at globally monitoring the amount of land that is dedicated by cities for public space. In Europe, the indicator “Share of urban population without green urban areas in their neighbourhood” is supposed to correspond to the SDG11.7.1 but is currently on-hold due to methodological issues and lack of data. Moreover, to efficiently assess public space conditions, timely and spatially disaggregated information is essential but not yet widely adopted by urban practitioners. Hereafter, we use a combination of satellite and crowdsourced Earth Observations (EO) to model physical accessibility to urban green spaces in four European cities. Findings suggest that it is technically feasible to derive information on the share of urban population without green urban areas in their neighbourhood. Results demonstrate that the proposed methodology represents a consistent, valid, reliable, low-cost, timely and continuous source of information for sustainable urban development. Open and free EO data can be a good complement to enhance official and traditional statistics on urban areas facilitating EU reporting against the SDG indicator for better comparison between EU countries.
Economic valuation of urban parks with historical importance: The case of Quinta do Castelo
Accessibility of public urban green space in an urban periphery: The case of Shanghai
DOI:10.1016/j.landurbplan.2016.11.007 URL [本文引用: 1]
基于改进高斯两步移动搜索法的深圳市公园绿地可达性评价
DOI:10.18306/dlkxjz.2021.07.004
[本文引用: 1]
公园绿地可达性是衡量城市宜居水平的重要指标。针对传统可达性分析多用统计数据开展评估而导致的供需尺度失衡问题,论文以深圳为例,采用公园绿地空间矢量数据和手机信令数据获取供需空间分布,采用高斯两步移动搜索法计算交通小区(TAZ)尺度公园绿地可达性,并结合可达性结果及供需、交通情况聚类,剖析可达性差异化模式及成因。主要结论如下:① 通过改进传统可达性计算数据源和高斯两步移动搜索模型,建立城市中微观尺度公园绿地可达性评价及成因研究框架,可更精确地评估优化城市公园绿地可达性;② 深圳市公园绿地综合可达性整体水平较高,但存在明显的从中心向外围递减的趋势,社区公园可达性差异与公园绿地供需不匹配是造成各区域可达性差异大的重要原因;③ 根据K均值聚类分析结果,将深圳市TAZ单元分成低供给低需求低可达性区、中供给低需求中可达性区、高供给高需求中可达性区、高供给低需求高可达性区,各类区域具有差异化的可达性内涵、特征和成因;④ 公园绿地可达性提升可针对不同分区特征,通过公园布局优化、道路建设和居住区规划布局等差异化方式实现。研究充实了城市公园绿地可达性评价案例,提出的基于手机信令数据和高斯两步移动搜索法的可达性分析方法不仅可应用于城市公园绿地布局与规划,也可为其他地理现象可达性分析提供思路参考。
Evaluation of green space accessibility based on improved Gaussian two-step floating catchment area method: A case study of Shenzhen city, China
DOI:10.18306/dlkxjz.2021.07.004
[本文引用: 1]
Accessibility of park green space is an important indicator of the livability level of a city. In order to solve the problem of scale imbalance between population and park green space distribution data by traditional accessibility analysis, this study used mobile phone signaling data to obtain the spatial distribution of population, and adopted the Gaussian two-step floating catchment area method to calculate the accessibility of park green space at the scale of traffic analysis zone (TAZ) in Shenzhen City. It also conducted a cluster analysis based on the accessibility results, supply and demand, and traffic conditions. The main conclusions are as follows: 1) More refined population information can be obtained through mobile phone signaling data to improve the accuracy of demand assessment. For different types of parks, the Gaussian two-step floating catchment area method represents an improvement in calculating the accessibility of parks in the city. 2) The overall level of comprehensive accessibility of park green space in Shenzhen is relatively high, but there is an obvious decreasing trend from the city center to the periphery. The mismatch between the accessibility of community parks and the supply and demand of park green space is an important reason for the large difference of accessibility among different regions in Shenzhen. 3) According to the results ofK-means clustering analysis, the TAZ units of the city was divided into low supply low demand low accessibility zone, medium supply low demand medium accessibility zone, high supply high demand medium accessibility zone, and high supply low demand high accessibility zone. 4) The accessibility of park green space can be improved by optimizing park layout, road construction, and residential area planning and layout. By improving data source and model of the traditional accessibility calculation, this study enriches the cases of park green space accessibility evaluation, and the proposed accessibility analysis method based on mobile phone signaling can also provide a reference for the accessibility analysis of other geographic phenomenon.
Spatiotemporal evolution differences of urban green space: A comparative case study of Shanghai and Xuchang in China
社会公平视角下深圳公园绿地可达性研究
DOI:10.13249/j.cnki.sgs.2022.05.015
[本文引用: 1]
公园绿地是城市中重要的绿色基础设施。针对传统可达性分析微观尺度研究不足和交通成本估计失真等问题,以深圳为例,采用公园绿地矢量数据和基于手机SDK(Software Development Kit,软件开发工具包)定位的人口数据作为供需数据源,基于住房分类数据以城中村、保障房、商品房居民划分社会群体,利用改进的高斯两步移动搜寻法计算得到居住小区尺度的公园绿地可达性社会公平情况。研究发现:① 深圳公园绿地可达性存在社会分异:商品房和城中村可达性较好;公租房和安居房社区公园可达性差;人才住房仅对社区公园可达性高;② 驾车可达性最均衡,公共交通方式下不同住房群体间的可达性差异较大。研究补充了中国城市公园绿地可达性社会公平研究的不足,改进了小尺度可达性研究的数据与方法,为公园绿地规划体系提供反思,并可为深圳城市发展提供政策依据。
Evaluation of park green space accessibility in Shenzhen from the perspective of social equity
DOI:10.13249/j.cnki.sgs.2022.05.015
[本文引用: 1]
Park green space, which is important green infrastructure in the city, can provide opportunities for physical exercise, social communication, nature exposure and emergency hedge. Spatially fine-grained evaluation of accessibility to park green space has been limited by data availability. This study fills the research gap by using mobile SDK positioning data in Shenzhen. It uses this data to obtain population distribution; it uses the improved Gaussian two-step floating catchment area method to calculate park green space accessibility of neighborhood scale; it uses open source map API to calculate the travel time of different transportation modes. The accessibility indicators are analyzed by different housing groups: Urban villages, affordable housing and commodity housing. The results show first a social disparity in the accessibility of park green space in Shenzhen. The accessibility of urban villages is good and balanced. Public rental housing and economic and comfortable housing have poor accessibility to neighborhood parks, while the former has high accessibility to urban parks and the latter to natural parks. In addition, the accessibility of talent worker housing is the lowest. Talent housing has high accessibility to neighborhood parks, but poor accessibility to urban parks and natural parks, resulting in low overall accessibility. Third, Transportation mode has great influence on the accessibility to green space. Accessibility by driving among housing groups is nominal, but transit accessibility among them shows significant variation. Based on these findings, our study makes the following suggestions, including 1) improving the presence of neighborhood parks around public rental housing and economic and comfortable housing. 2) prioritizing transit service improvement for low-income residential areas, and 3) changing the planning requirement for green space supply in land development. Our study enriches existing literature by helping readers to understand park green space accessibility from the perspective of social equity in Chinese cities and by establishing a better connection to planning practice with spatially fine-grained data and evaluation indicators.
收缩情境下城市用地结构时空格局演变及动力机制: 以中国东北地区为例
DOI:10.11821/dlyj020200410
[本文引用: 1]
构建城市用地结构时空格局演变分析框架,引入信息熵和偏移份额模型定量剖析2000—2017年中国东北地区城市用地结构时空格局演变特征,通过计量经济模型分阶段对比分析收缩情境下东北地区城市用地结构演变的动力机制。结果表明:东北地区城市用地总面积持续增长,用地结构信息熵整体呈现先上升、后下降的趋势。2011年以后,城市用地结构有序性、多样性不断提升,单一优势地类主导作用显著下降。公共设施用地、道路交通用地及绿地与广场用地为增长型地类,是东北地区城市用地规模扩张和结构演变的主要动因。用地结构竞争性偏移量具有显著的空间非均衡性,总体与辽中南和哈长两大城市群空间格局基本吻合,新增城市用地的集聚效应不断凸显。城市人口规模变迁、城市经济发展水平提升、产业结构升级与城市居住条件改善对城市用地结构演变具有显著的正向驱动作用。收缩情境下,各因素的拉动作用逐渐减弱,国家宏观政策的约束力不断增强,城市公共服务水平改善的强需求成为驱动用地结构演变的外在动力。
Spatio-temporal evolution and driving mechanism of urban land use structure with the context of urban shrinkage: Evidence from Northeast China
DOI:10.11821/dlyj020200410
[本文引用: 1]
Based on the analysis framework of spatio-temporal evolution of urban land use structure with the context of shrinkage, this study introduced the Information Entropy Model and the Shift-Share Model to examine the spatio-temporal evolution characteristics of urban land use structure in Northeast China, using panel data from 2000 to 2017. The dynamic mechanism of structural evolution of urban land use in Northeast China was analyzed by econometric model. The results demonstrated that: (1) the total area of urban land in Northeast China increased continuously since 2000, while the information entropy of urban land use structure increased firstly and then decreased. After 2011, with the improvement of diversity and equilibrium degree of urban land use structure, the order of urban land use structure has been enhanced and the leading role of single dominant land type has been significantly reduced. (2) The three types of urban land, i.e., land for public facilities, land for road, street and transportation and land for green space and square were growing, which is the main reason for the rapid increase of the total urban land area in the study region. (3) There exists significant spatial imbalance of competitiveness of different urban land types, which evolve constantly in different regions, and the overall spatial pattern is basically consistent with the distribution pattern of the two major urban agglomerations of central and southern Liaoning city groups and Harbin-Changchun megalopolis. Meanwhile the agglomeration effect of new-added urban land area is increasingly prominent. (4) The dynamic change of urban population, urban economic development, the upgrading and adjustment of industrial structure, and the improvement of urban living conditions all have significant positive impact on the dynamic evolution of urban land use structure in Northeast China. In the context of urban shrinkage, the effect of various factors is gradually weakened, and the binding force of national macro policies is increasing. Meanwhile, the demand for the improvement of urban public services has become the external driving force for the evolution of urban land use structure. To realize the overall revitalization of Northeast China, differentiated measures should be taken to reverse the trend of population loss, and boost the vitality of regional economic development.
城市绿地系统的生态服务功能评价、规划与预测研究: 以扬州市为例
Evaluation, planning and prediction of ecosystem services of urban green space: A case study of Yangzhou city
武汉市多维度城市公园绿地空间公平性分析
DOI:10.13249/j.cnki.sgs.2021.12.007
[本文引用: 1]
以武汉市中心城区为研究区域,居民建筑为研究单元,基于步行、骑行及公共交通3种出行方式,从城市公园绿地数量、质量及可达性3个维度衡量每个建筑单元的公园绿地空间公平性水平。结果表明:① 3种交通方式下建筑单元的公园绿地公平性分布相差较大,但整体呈现由城中心沿江区域向外围辐射递减的分布特征;② 随着居民出行方式的升级,极限出行时间内居民的活动范围不断扩大,因此所享有公园绿地公平性水平逐步提升;③ 城市公园绿地资源与人口分布存在空间失配现象,多数公园绿地分布于城市中部,而南北部城郊区域分布较少,西北和西南部多数区域居民享有公园绿地公平性水平整体较差。
Spatial equity of urban park green based on multiple dimensions in central district of Wuhan
DOI:10.13249/j.cnki.sgs.2021.12.007
[本文引用: 1]
Urban park green is a public service resource which integrates economic, ecological and leisure functions. The fairness of urban park green spatial layout and resource allocation are significant to the quality of routine life and environmental optimization. The central district of Wuhan is taken as the study area and residential buildings as the research unit. Based on the three travel modes of walking, bicycle and public transportation, this article measured the equity of park green in residential building from the three dimensions of quantity, quality and accessibility. The results showed that: 1) The equity distribution of urban park green in residential building varies greatly under the three modes of transportation, but the overall layout features are decreasing from the area along the river of the city center to the periphery. 2) With the upgrading of residents’ travel mode, the range of residents’ activities in the limit travel time is expanding, so the equity level of the park green space enjoyed by residents are gradually improved. 3) There is spatial mismatch between urban park green resources and population distribution. Most parks are distributed in the middle of the city, and a few are located in the north and south of the suburbs. The equity levels of park green enjoyed by residents in the northwest and southwest is poor as a whole. In the future, cities should further optimize the spatial layout and quality of urban park green, and improve the convenience of suburban traffic to promote the construction of urban ecological environment.
中国旅游业绿色发展效率时空演变特征及影响机理
DOI:10.31497/zrzyxb.20220309
[本文引用: 1]
绿色发展是旅游业可持续发展理念的重要组成部分,是旅游业奉行以人为本、生态至上和全面发展的新价值观。在梳理旅游业绿色发展概念及内涵基础上,构建旅游业绿色发展效率评价体系,运用SBM-Undersirable模型、核密度估计、空间马尔科夫链等方法,探讨2008—2018年中国31个省(市、自治区)旅游业绿色发展效率(TGDE)时空演化特征及影响机理。研究发现:(1)时间和空间变化方面,TGDE总体处于中等偏下水平,时间上呈“W”型变化形态,“下降—上升—调整”阶段特征显著;空间呈“东—中—西”递减分布,内部差异为西部地区>东部地区>中部地区,低、中、高效率由“金字塔”向“菱形”结构转变,高效率地区集中于东部沿海,中等效率多分布于中西部地区,低效率位于胡焕庸线两侧。(2)动态演进方面,TGDE始终存在两极分化现象,但区域协调性逐步增强,具有较强平稳性,难以实现跨越式发展,空间向上转移省份比较集中,以中西部为主,向下调整省份较少,且存在明显的空间溢出效应,溢出影响具有不对称性。(3)影响机理方面,总体上,经济水平、产业结构、政府规制、教育水平和旅游资源影响因子与TGDE间存在显著的正向关系,对外开放程度的作用不显著,但各因子的影响程度、作用机理及条件具有较强地域性。
Spatio-temporal evolution characteristics and influencing mechanism of green development efficiency of tourism industry in China
DOI:10.31497/zrzyxb.20220309 URL [本文引用: 1]
中部地区乡村生产要素协同转型的时空格局及影响因素: 以湖南岳阳为例
DOI:10.31497/zrzyxb.20211212
[本文引用: 1]
乡村生产要素(人—地—资本)协同转型,即劳动力转移、农地流转、资本循环协同演进,对乡村发展至关重要。本文构建了要素协同转型的理论框架,探讨影响因素的作用机制;以湖南岳阳市为例,揭示了要素转型发展水平,探究了要素协同的时空演化;从内生和外源两个维度,探讨了协同水平空间异质性的影响因素。基于要素转型会由“失配”转向“协同”的理论假说,实证发现:劳动力转移水平远高于农地流转和资本循环,三者空间分异显著;要素协同程度不高但在增强,空间集聚明显;坡度、耕地资源禀赋、距县城的距离、政府农业农村投入分别是关键的内生与外源解释因素,除距县城距离仅有正向影响外,其余因素正、负向影响并存。政策举措应因地制宜。
Spatio-temporal patterns and influencing factors of the collaborative transformation of rural production factors in Central China: A case study of Yueyang, Hunan province
DOI:10.31497/zrzyxb.20211212 URL [本文引用: 1]
长江经济带乡村性的时空分异格局及驱动机制
DOI:10.31497/zrzyxb.20220208
[本文引用: 1]
乡村性是描述乡村地域特征的重要指标,其时空分异可以有效反映乡村发展及转型的基本面。聚焦我国重大国家战略发展区域“长江经济带”,采用乡村性指数测度模型及探索性空间数据分析探究2000年、2005年、2010年及2017年长江经济带县域乡村性的时空分异格局,并运用GWR模型重点分析影响因素的空间异质性。结果表明:(1)2000—2017年,长江经济带县域乡村性总体有所减弱,空间上呈现“东部低、中西部高”的特点;县域乡村性在城市群(圈)、省会及大城市附近呈现较低水平,向外围逐渐升高。(2)乡村性高高集聚主要分布在中西部的传统农区,随时间推移明显缩减;低低集聚则集中在长三角、武汉、长株潭等城市群(圈)地区,且整体格局较为稳定。(3)农业技术、政府支持、资本投入、市场调节因素能促进乡村发展及转型,其中,农业技术的作用最强。自然环境和区位条件则兼具促进和限制作用。这些影响因素对不同地区乡村发展及转型的影响存在差异性,未来制定区域乡村发展策略应针对不同地区分类精准施策。
Spatio-temporal differentiation and driving mechanism of rurality in the Yangtze River Economic Belt
DOI:10.31497/zrzyxb.20220208 URL [本文引用: 1]
差别定价的产业用地供应策略对产业结构升级的影响: 基于中国277个城市的实证分析
DOI:10.18402/resci.2020.03.13
[本文引用: 1]
“以地谋发展”模式下,地方政府主导土地配置,采取“低工业、高商住”的产业用地出让策略,实现了产业结构升级和经济增长的目标。然而,中国经济转型期,曾经推动产业结构升级的供地策略可能不再适应新时期发展要求。本文从理论出发,剖析地方政府供地逻辑,分析差别定价的产业用地供应策略在不同经济发展水平下对产业结构升级的影响差异,提出相应假说,基于门槛回归模型,并利用2011—2016年中国277个城市产业用地供应数据进行实证检验。结果表明,产业用地价格差异对产业结构升级的影响会随经济发展水平不同呈非线性关系,随着经济发展水平的提高,差别定价的产业用地供应策略对产业结构升级的影响效应将由正转负;产业用地供应向商住用地倾斜而产生的产业用地结构错配会显著抑制产业结构升级;提高土地出让市场化程度,降低土地财政依赖则有利于提升产业结构。据此本文建议,地方政府在制定产业用地供应策略时,要充分考虑所处的社会经济环境,而在参与土地市场活动时,要明确自身干预经济的局限性,更多地培育有效市场,注重提高土地市场化程度,避免过度依赖土地财政。
Impact of differential pricing strategy of land supply on the upgrading of industrial structure: A study based on the empirical analysis of 277 cities in China
