

联合国政府间气候变化专门委员会(Intergovernmental Panel on Climate Change,IPCC)最新发布的评估报告显示,未来全球气候变化都将加剧,具体表现为海陆表面温度上升速度持续加快、海平面上升、多年冻土和季节性积雪融化、冰川消融以及极端天气事件频发等[1]。其中,1901—2020年亚洲和中国的陆地表面平均温度均呈现较为明显的上升趋势,分别为0.14 ℃/10 a和0.15 ℃/10 a[2]。由于地理位置、经济发展水平和社会保障体系等因素的限制,气候变化的影响呈现出明显的地域性特征,因此认识气候变化背景下不同自然要素的响应规律及其对人类生产生活的潜在影响成为亟待解决的科学问题。
青藏高原具有“世界屋脊”之称,其面积约254.22×10⁴ km2,平均海拔在4000 m以上,发育着数量众多的冰川和湖泊,被誉为“第三极”和“亚洲水塔”[10,11]。据统计,青藏高原共有冰川36800条,面积和冰储量分别为49873 km2和4561 km3[12];面积≥1 km2的湖泊数量和面积分别为1091个和4.50×10⁴ km2,其面积约占全国湖泊总面积的51.4%[13]。1961—2020年青藏高原的升温速率高达0.36 ℃/10 a,约为全球升温速率的2倍[2],其气候背景和生态环境均发生显著变化[14]。气候变化引起的冰川和湖泊变化不但直接影响了周边地区人口的生存和发展,而且具有导致区域性乃至北半球大气环流变迁的可能性[15,16]。青海省位于青藏高原东北部,属大陆性干旱半干旱高原气候,境内冰川和湖泊资源丰富。在全球气候变暖背景下,尤其受气候暖湿化作用的影响,青海省大多冰川呈现减薄退缩态势,冰川融水径流增加引发的反馈作用日益凸显;湖泊水位上升和湖面扩张直接对湖区周围草场及基础设施构成威胁[17⇓⇓-20]。2021年6月7-9日,习近平总书记赴青海考察并发表重要讲话,7月30日通过并开始实施的《加快把青藏高原打造成为全国乃至国际生态文明高地的行动方案》均突显出青海省在中国生态文明建设中的重要地位。由于不同学者使用的数据源、研究时段和地理范围均存在差异,冰川和湖泊的变化研究主要集中在山系[21⇓⇓⇓-25]、流域[26]和青藏高原[27⇓-29]等空间尺度,而对于青海省的冰川和湖泊变化及其区域分异规律尚缺乏认识。本文基于Landsat TM/ETM+/OLI和Sentinel 2A/2B MSI遥感影像,构建2000年和2020年青海省冰川和湖泊数据集,并对其分布规律及时空变化特征进行分析,以期为全面认识青海省在气候变暖背景下冰川和湖泊的响应规律、区域水资源的合理利用和防灾减灾提供科学依据。
1 研究方法与数据来源
1.1 研究区概况
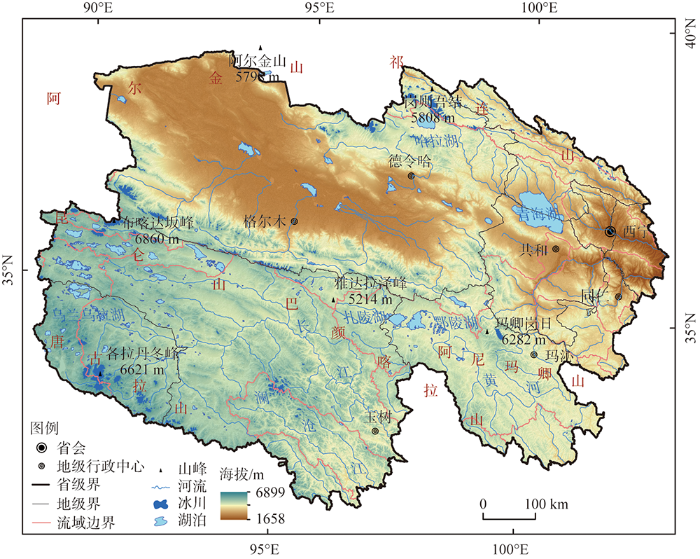
青海省(31°39′~39°19′N,89°35′~103°04′E)地处中国西北部和青藏高原东北部,北部和东部与甘肃省相接,西北部与新疆维吾尔自治区相邻,南部和东南部与四川省毗连,西南部与西藏自治区接壤(图1)。东西长约1200 km,南北宽约800 km,面积为72.23×10⁴ km2。青海省地处中国地势第一阶梯,平均海拔在3000 m以上,总体呈现由东北和西北向西南逐渐升高趋势,祁连山—阿尔金山、昆仑山—阿尼玛卿山和唐古拉山三大近东西走向的山系构成了青海省地形的基本骨架,河谷和盆地相间分布。因深居高原内陆,青海省属典型大陆性高原气候,具有日照时间长、辐射强烈、雨热同期以及年温差较小而日温差较大等特征。受地形和海陆位置影响,柴达木盆地和东部地区年均温较高,年降水量基本呈现从东南向西北递减趋势。
图1
1.2 数据来源
遥感数据源包括Landsat TM/ETM+/OLI影像和Sentinel 2A/2B MSI影像,用于解译青海省冰川和湖泊轮廓,前者共104景,其中,2000年的Landsat TM和ETM+影像分别为68景和10景,2020年的Landsat OLI影像26景,多集中在6-8月;后者共84景,其中,2020年Sentinel 2A MSI影像32景,2020年Sentinel 2B MSI影像52景,多集中在9-10月。所选用的Landsat TM/ETM+/OLI影像从美国地质调查局网站(
为提取研究区冰川和湖泊地形信息,选用的数字高程模型(Digital Elevation Model, DEM)为SRTM DEM数据,从地理空间数据云(
1.3 研究方法
1.3.1 冰川信息提取及精度验证
图2
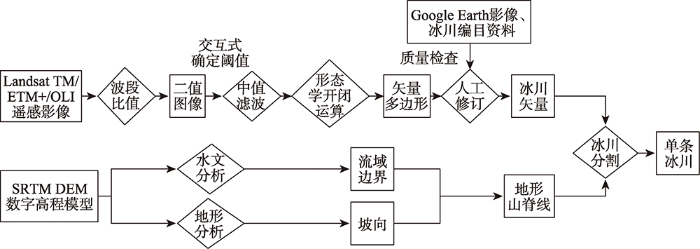
图2
基于Landsat影像的冰川边界提取过程
Fig. 2
The process of glacier boundary extraction based on Landsat imagery
式中:ε为影像空间分辨率造成的冰川面积误差(m2);N为冰川轮廓的周长(m);A为半个像元的边长(m)。其中,由Landsat TM/ETM+/OLI遥感影像空间分辨率造成的冰川面积误差在2000年和2020年分别为221.63 km2和101.70 km2,各占该期冰川面积的5.40%和2.79%。
1.3.2 湖泊信息提取及变化状态分析
本文采用水体指数和人工修订相结合的方式对湖泊边界进行提取。首先采用归一化差异水体指数(Normalized Difference Water Index,NDWI)[38]对2000年Landsat TM和2020年Sentinel 2A/2B MSI影像进行水体预提取,然后结合人工目视解译方法检查因NDWI阈值造成的湖泊水体漏判(水体边界不一致)或误判(将冰川识别为湖泊)。参考式(1),由Landsat TM和Sentinel 2A/2B MSI遥感影像空间分辨率造成的湖泊面积误差在2000年和2020年分别为98.06 km2和48.65 km2,各占该期湖泊面积的0.81%和0.34%。
鉴于人工目视解译自身存在误差(受混合像元的影响),为更加科学地评判湖泊变化状况,本文采用下式计算各湖泊的面积变化状态[39]:
式中:ΔS为两期湖泊面积的差值(m2),i和j分别为年份;ΔE为两期湖泊的面积误差(m2);Pi和Pj分别为i和j时刻的湖泊多边形周长(m);Hc为Landsat TM和Sentinel MSI影像像元边长的一半,分别为15 m和5 m。
2 结果分析
2.1 2000—2020年青海省冰川变化
表1列出了2000年和2020年青海省的冰川数量、面积、冰储量及其变化。显然,近20年间青海省冰川整体呈退缩态势,其中冰川数量减少128条(-3.33%),280条冰川消失(面积为23.43 km2),131条冰川分裂为269条(面积从445.31 km2减少为280.42 km2);冰川面积和冰储量分别减少了464.63 km2(-11.30%)和29.58 km3(-10.23%),二者相对变化速率分别为-0.60%/a和-0.54%/a。从冰川规模来看(图3),2000— 2020年除面积<0.1 km2的冰川数量和面积增加、面积>50 km2的冰川面积增加外,其余等级的冰川数量和面积均呈减少的趋势。其中,面积介于0.2~0.5 km2的冰川数量减少最多(-183条),面积介于2~5 km2的冰川面积减少最多(-108.97 km2);面积介于0.2~0.5 km2 (-59.20 km2)、0.5~1 km2 (-52.41 km2)、1~2 km2 (-85.17 km2)和5~10 km2(-83.65 km2)的冰川面积减少均大于50 km2。从各规模等级的冰川面积相对变化速率来看,冰川规模越小其退缩率越快。面积介于0.2~0.5 km2的小冰川退缩最快(-1.00%/a),面积介于10~20 km2(-0.34%/a)和20~50 km2(-0.43%/a)的冰川退缩速率最小。
表1 2000—2020年青海省冰川数量、面积及冰储量变化
Table 1
| 年份及变化 | 数量/条 | 面积/km2 | 冰储量/km3 |
|---|---|---|---|
| 2000年 | 3841 | 4108.03 | 289.21 |
| 2020年 | 3713 | 3643.40 | 259.63 |
| 绝对变化 | -128 | -464.63 | -29.58 |
| 相对变化/(%/a) | -0.17 | -0.60 | -0.54 |
图3
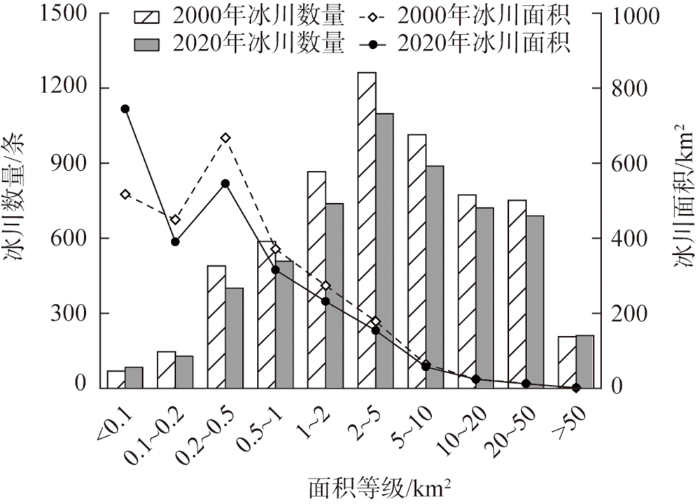
图3
2000—2020年青海省不同规模的冰川数量与面积变化
Fig. 3
The change of the number and area of glaciers in different sizes in Qinghai province from 2000 to 2020
山脉或山峰的绝对海拔高度及平衡线以上的相对高差,是决定山地冰川数量及规模的主要地形要素[40]。冰川物质平衡是指单位面积冰川上分别以固态降水和冰川消融为主的物质收入和支出的代数和,冰川物质平衡线综合反映了区域气候和地形等多种因素对冰川发育的影响,是冰川的气候—地貌指标。以200 m高差为间隔对冰川覆盖区海拔进行统计,结果表明青海省冰川面积随海拔呈正态分布(图4a)。2000年和2020年青海省冰川均发育在海拔4000~7000 m之间,面积集中分布于4600~6200 m之间,所占比例分别为97.26%和97.68%;除海拔6200~6800 m的冰川面积增加外,其余各海拔区间的冰川面积均呈现减少趋势,其冰川中值海拔相应由5450 m上升到5472 m。对比各海拔区间的冰川面积相对变化速率可知,随海拔梯度上升,冰川面积相对变化速率基本呈现递减趋势(图4b)。青海省境内各山系冰川发育规模差异较大(表2),其中昆仑山的冰川数量和面积最多(大),祁连山的冰川数量虽多于唐古拉山,但其冰川面积小于唐古拉山,可可西里地区的冰川数量和面积最少(小)。近20年间各山系的冰川数量和面积均呈现减少趋势,其中昆仑山的冰川面积减少最多(-183.78 km2),其次是唐古拉山(-152.76 km2)和祁连山(-118.44 km2),可可西里地区最少(-9.65 km2)。从冰川面积变化速率来看,祁连山的冰川退缩最快(-0.71%/a),昆仑山和唐古拉山基本相当,分别为-0.58%/a和 -0.56%/a;可可西里地区最慢(-0.41%/a)。
图4
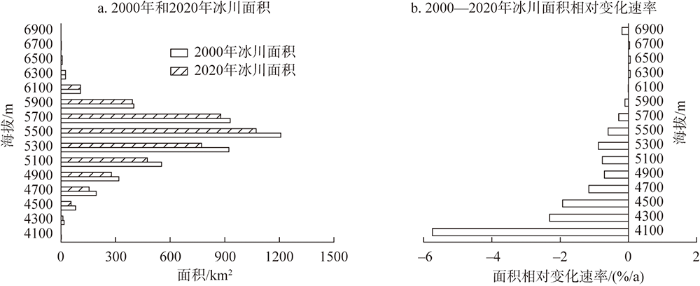
图4
2000—2020年青海省各海拔冰川面积变化
Fig. 4
The altitudinal characteristics of glacier area changes in Qinghai province from 2000 to 2020
表2 2000—2020年青海省各山系/地区冰川数量及面积变化
Table 2
| 山系/地区 | 冰川数量/条 | 冰川面积/km2 | ||||||
|---|---|---|---|---|---|---|---|---|
| 2000年 | 2020年 | 变化 | 2000年 | 2020年 | 绝对变化 | 相对变化/(%/a) | ||
| 昆仑山 | 1803 | 1718 | -85 | 1662.12 | 1478.34 | -183.78 | -0.58 | |
| 祁连山 | 1189 | 1149 | -40 | 887.24 | 768.80 | -118.44 | -0.71 | |
| 唐古拉山 | 789 | 787 | -2 | 1435.48 | 1282.72 | -152.76 | -0.56 | |
| 可可西里 | 60 | 59 | -1 | 123.19 | 113.54 | -9.65 | -0.41 | |
朝向是影响冰川热量收支的关键地形要素。受山脉走向影响,青海省境内北朝向的冰川数量和面积最多(大),其次是东北和西北朝向,其余各朝向的冰川数量和面积较小(图5)。2000—2020年间,除朝向为南(2条)、西南(3条)、西(4条)和东(7条)的冰川数量略有增加外,其余各朝向冰川数量均呈减少趋势;而各朝向冰川面积均呈减少趋势,其中北朝向冰川退缩面积最大(-184.13 km2),其次是东北朝向(-109.24 km2)和西南朝向(-50.17 km2),其余朝向的冰川退缩面积均小于30 km2。统计各朝向的冰川面积相对变化速率发现,朝向为北(-0.81%/a)、东北(-0.74%/a)、西北(-0.64%/a)和西南(-0.62%/a)的冰川退缩最快,朝向为东(-0.20%/a)的冰川退缩最慢。
图5
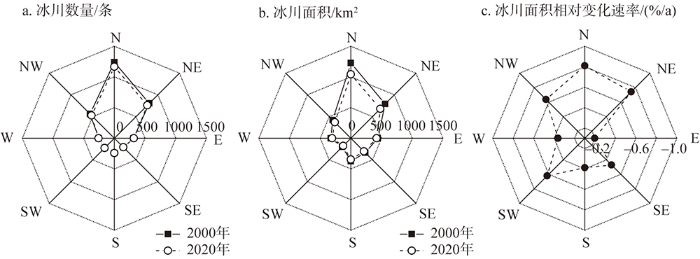
图5
2000—2020年青海省各朝向冰川数量和面积变化
Fig. 5
The orientational characteristics of glacier number and area changes in Qinghai province from 2000 to 2020
为明确青海省冰川变化的区域分异规律,以经度1°为间隔统计青海省2000—2020年的冰川面积,并计算各区域冰川的面积变化及相对变化速率(图6a),结果显示各区域的冰川面积均呈现减少趋势。其中,91°~92°E之间冰川面积退缩最多(-87.67 km2),其次是94°~95°E之间(-68.23 km2),102°~103°E之间最少(-0.46 km2)。从不同经度带的冰川面积变化相对速率对比分析,青海省冰川自西向东基本呈现加快退缩趋势,其中95°~96°E之间退缩最快(-1.60%/a),90°~91°E之间退缩最慢(-0.28%/a)。青海省冰川中值面积海拔呈现自西向东逐渐降低趋势(图6b),冰川面积相对变化速率基本与中值面积海拔呈负相关关系,即中值面积海拔越高,冰川面积相对变化速率越小,这主要是因为高海拔地区冰川依靠低温条件存在,退缩较慢;海拔较低区域冰川面积较小且退缩主要发生在消融区。
图6
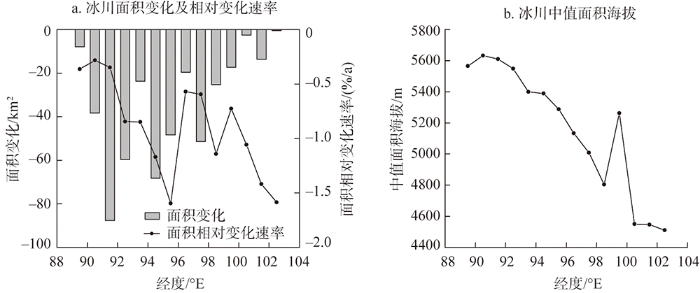
图6
2000—2020年青海省不同经度带的冰川面积变化
Fig. 6
Area changes of glaciers in different longitude zones in Qinghai province from 2000 to 2020
2.2 2000—2020年青海省湖泊变化
2000—2020年,青海省面积≥1 km2的湖泊数量从204个增加为231个,湖泊面积从12153.57 km2增长至14374.56 km2,湖泊面积绝对变化和相对变化分别为2220.99 km2和0.84%/a,青海省湖泊整体呈扩张趋势。根据2000—2020年青海省不同规模湖泊的数量与面积变化(图7)可知,近20年青海省除面积介于1~2 km2的湖泊数量有所减少、面积介于10~20 km2的湖泊数量和面积有所减少、面积介于20~ 50 km2的湖泊面积有所减少外,其余面积等级的湖泊数量和面积均呈现不变或增加趋势;面积介于2~5 km2的湖泊数量增加最多(22个),面积介于500~1000 km2的湖泊面积增加最大(928.56 km2),且面积≥50 km2的各等级湖泊面积增加均大于100 km2。
图7
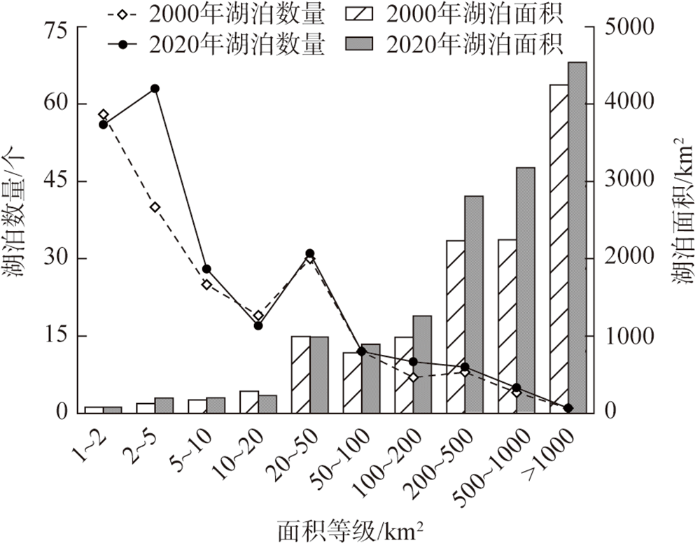
图7
2000—2020年青海省不同规模的湖泊数量与面积变化
Fig. 7
The change of the number and area of lakes in different sizes in Qinghai province from 2000 to 2020
按照中国冰川编目,青海省可划分黄河(5J)、长江(5K)、澜沧江(5L)、东亚内流区(5Y)和青藏高原内流区(5Z)5个一级流域。由表3可知,2020年长江流域的湖泊数量最多(89个),澜沧江流域最少(1个);东亚内流区的湖泊面积最大(7779.01 km2),其次为青藏高原内流区(3966.55 km2),澜沧江流域湖泊面积最小(20.70 km2)。在二级流域中,金沙江(5K4,青海省境内为通天河)流域湖泊数量最多(87个),大通河(5J4)、雅砻江(5K5,青海省境内为清水河)、岷江(5K6,青海省境内为马可河)、扎曲(5L4)和多格错仁湖(5Z5)流域的湖泊数量均为1个;柴达木内流区(5Y5)湖泊面积最大(7737.78 km2),马可河流域湖泊面积最小(1.50 km2)。2000—2020年间,除马可河流域湖泊面积有所减少外,其余各流域均呈现增加趋势,其中多格错仁湖流域的湖泊面积增加最快(5.43%/a),扎曲流域的湖泊面积增长最慢(0.10%/a)。从湖泊面积变化空间分布(图8)来看,2000—2020年青海省大部分地区的湖泊(71.36%)面积呈现增加态势,面积减少的湖泊(24.12%)主要分布在柴达木盆地中部和北部、唐古拉山北侧及青海省东南部年保玉则峰东侧,面积变化较小的湖泊(4.52%)分布则较为零散。其中,青海湖和东台吉乃尔湖的面积变化最大,分别为289.54 km2和-130.15 km2;盐湖扩张速率和北霍布逊湖萎缩速率最快,分别为9.15%/a和-8.94%/a。
表3 2000—2020年青海省各流域的湖泊数量与面积变化
Table 3
| 一级流域 (编码) | 二级流域 (编码) | 湖泊数量/个 | 湖泊面积/km2 | |||||
|---|---|---|---|---|---|---|---|---|
| 2000年 | 2020年 | 变化 | 2000年 | 2020年 | 绝对变化 | 相对变化/(%/a) | ||
| 黄河(5J) | 黄河上游段(5J3) | 34 | 38 | 4 | 1425.36 | 1518.56 | 93.20 | 0.32 |
| 大通河(5J4) | 1 | 1 | 0 | 2.82 | 3.19 | 0.37 | 0.62 | |
| 合计 | 35 | 39 | 4 | 1428.18 | 1521.76 | 93.58 | 0.32 | |
| 长江(5K) | 通天河(5K4) | 77 | 87 | 10 | 875.19 | 1083.32 | 208.13 | 1.07 |
| 清水河(5K5) | 1 | 1 | 0 | 1.09 | 1.72 | 0.63 | 2.30 | |
| 马可河(5K6) | 1 | 1 | 0 | 1.52 | 1.50 | -0.02 | -0.07 | |
| 合计 | 79 | 89 | 10 | 877.80 | 1086.54 | 208.74 | 1.07 | |
| 澜沧江(5L) | 扎曲(5L4) | 1 | 1 | 0 | 20.30 | 20.70 | 0.40 | 0.10 |
| 东亚内流区(5Y) | 河西内流区(5Y4) | 3 | 4 | 1 | 31.62 | 41.23 | 9.61 | 1.34 |
| 柴达木内流区(5Y5) | 51 | 53 | 2 | 6812.36 | 7737.78 | 925.42 | 0.64 | |
| 合计 | 54 | 57 | 3 | 6843.98 | 7779.01 | 935.03 | 0.64 | |
| 青藏高原内流区(5Z) | 楚玛尔河(5Z1) | 11 | 12 | 1 | 1337.50 | 1752.85 | 415.35 | 1.36 |
| 沱沱河(5Z2) | 24 | 32 | 8 | 1638.46 | 2192.50 | 554.04 | 1.47 | |
| 多格错仁湖(5Z5) | 1 | 1 | 0 | 7.36 | 21.20 | 13.84 | 5.43 | |
| 合计 | 36 | 45 | 9 | 2983.31 | 3966.55 | 983.24 | 1.43 | |
图8
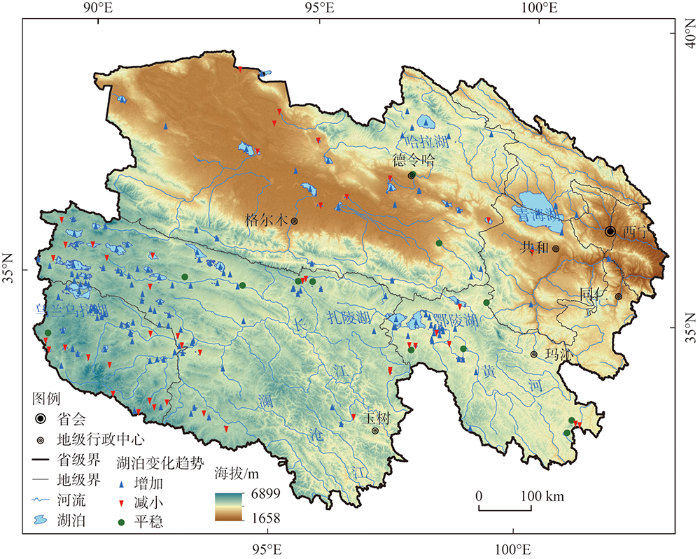
图8
2000—2020年青海省湖泊面积变化空间分异
Fig. 8
Spatial variation in area changes of lakes in Qinghai province from 2000 to 2020
3 结论与讨论
3.1 结论
(1)2020年青海省冰川数量、面积和冰储量分别为3713条、3643.40 km2和 259.63 km3,冰川数量以<0.1 km2的冰川为主,面积则以介于2~5 km2的冰川为主,其中北朝向的冰川数量(1167条)和面积(1042.27 km2)最多(大);面积≥1 km2的湖泊数量和面积分别为231个和14374.56 km2,湖泊数量以介于2~5 km2的湖泊为主,面积则以>1000 km2的湖泊为主,其中长江流域的湖泊数量最多(89个),东亚内流区的湖泊面积最大(7779.01 km2)。
(2)2000—2020年青海省冰川呈萎缩态势。受西北地区气候暖湿化影响,近20年青海省冰川数量、面积和冰储量分别减少128条(-3.33%)、464.63 km2(-11.31%)和29.58 km3(-10.23%)。青海省冰川变化呈现一定的空间异质性,中东部地区冰川退缩速率快于西部地区,其中祁连山冰川面积退缩最快(-0.71%/a),昆仑山和唐古拉山基本相当(分别为-0.58%/a和-0.56%/a),可可西里地区最慢(-0.41%/a)。由于冰川末端退缩,其中值海拔从5450 m上升到5472 m。
(3)2000—2020年青海省湖泊呈快速扩张趋势,面积≥1 km2的湖泊数量和面积分别增加27个和2220.09 km2,近20年湖泊面积增加比例高达18.27%。除柴达木盆地中部和北部、唐古拉山北侧及年保玉则峰东侧等区域外,青海省大部分区域的湖泊水域面积都呈增加趋势。青海省境内湖泊变化主要受降水和冰川融水变化等自然因素影响,但个别湖泊变化与人类活动增强密切相关。湖泊扩张已经或即将对湖周草场和道路、居民点等基础设施构成直接威胁,未来应加强对潜在危险性湖泊的监测,并及时制订相应的防灾减灾措施。
3.2 讨论
3.2.1 青海省冰川和湖泊对气候变化的响应
冰川和湖泊演变与气候变化存在密切联系,在较长的时间尺度和较大的空间范围上,影响冰川和湖泊变化的主要气象因子分别是气温和降水。基于中国地面气温与降水月值0.5°×0.5°格点数据集,2000—2020年青海省大部分区域的夏季气温变化率大于0.15 ℃/10 a,且由西北向东南呈递增趋势(图9a);年降水量变化率空间差异极大,降水增多主要出现在青海省东部和昆仑山等地区,而唐古拉山降水则呈减少趋势(图9b)。已有研究表明,夏季平均气温升高1 ℃会导致冰川平衡线升高100~160 m,造成的物质损失需要降水增加40%~50%的补给才能保持物质平衡[41,42],显然气温上升给冰川物质平衡带来的影响仅靠年降水量的增加远不能弥补,从而导致青海省境内冰川整体呈现退缩趋势,且中东部的退缩较西部更为明显。冰川融化使得冰川融水增加,结合大气降水增加,直接导致湖泊补给水源增加,这与本文中青海省大部分地区湖泊呈现面积增加态势的结论基本一致。湖泊面积减少区域的年降水量增加趋势不明显,气温升高造成蒸发量增加,导致柴达木盆地中部和北部、唐古拉山北侧及青海省东南部年保玉则峰东侧的湖泊逐渐萎缩。
图9
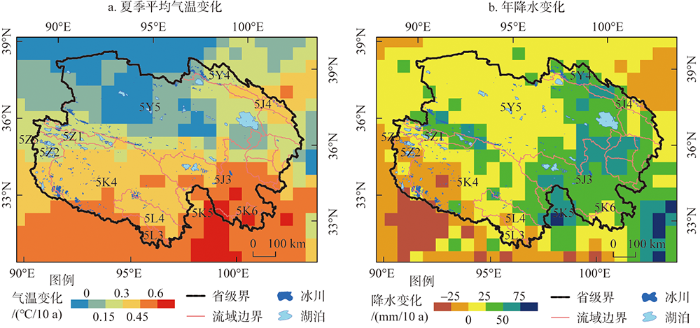
图9
2000—2020年青海省夏季平均气温和年降水变化
Fig. 9
The change of average temperature in summer and annual precipitation in Qinghai province from 2000 to 2020
从流域尺度来看(图10),2000—2020年青海省各一级流域的冰川均呈现退缩趋势,湖泊均呈现扩张趋势,但其变化趋势存在空间异质性。其中,澜沧江流域冰川退缩最快(-1.79%/a),青藏高原内流区湖泊扩张最快(1.43%/a)。从二级流域来看,分布在青海省南部地区的各流域冰川退缩率普遍大于北部,与各流域夏季平均气温变化趋势基本一致;而湖泊面积变化速率与流域的性质有关,内流区的湖泊面积变化速率明显大于外流区。此外,湖泊自身特征差异对湖泊面积的变化影响较大。以哈拉湖和太阳湖为例(图11),二者均为冰川融水补给湖,但哈拉湖属于典型的封闭式咸水湖,水系呈向心状,入湖河流多为季节性河流,在冰川退缩、融水增多背景下,湖泊面积呈现较为显著的增加趋势;而太阳湖地处布喀达坂峰和马兰山的山间盆地,属硫酸钠亚型淡水湖,南部的冰川融水汇入太阳湖后,出流从东部注入布南湖并经洪水河汇入那棱格勒河,此类“吞吐型”冰川湖泊可以保证增加的冰川融水通过出水口及时排除,使其处于相对稳定的水量平衡状态,面积变化不显著。因此,辨析冰川融水径流和大气降水对湖泊水量的补给差异及贡献大小不仅依赖于长期气象水文观测资料,而且取决于湖泊自身特征(如有无出水口、是否与冰川末端相连等)及入湖径流构成等诸多要素。
图10
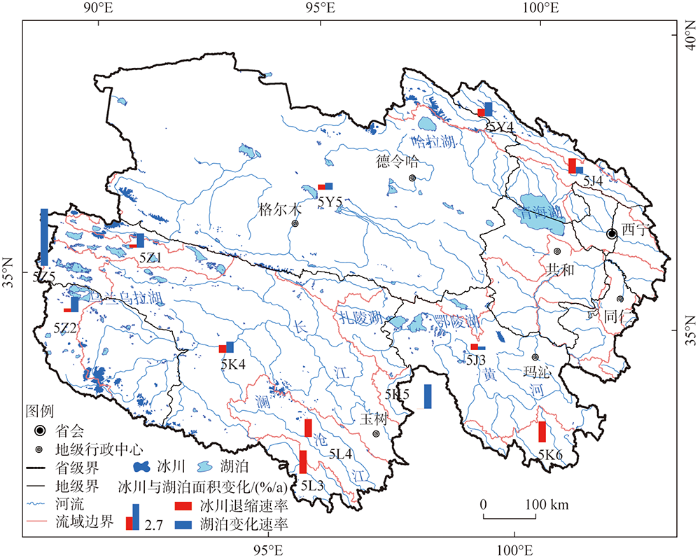
图10
2000—2020年青海省各流域冰川与湖泊面积变化对比
Fig. 10
The characteristics of glacier and lake area changes in different basins of Qinghai province from 2000 to 2020
图11
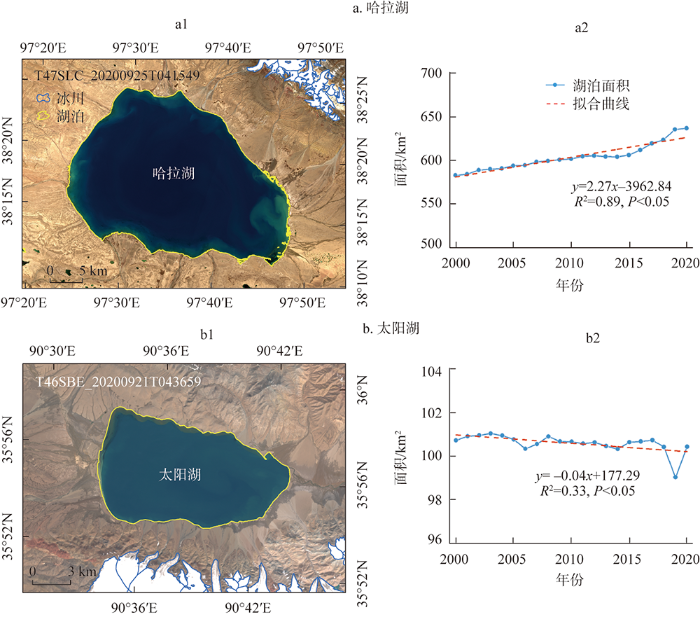
图11
2000—2020年哈拉湖和太阳湖的面积变化对比
Fig. 11
The comparison of the area changes of Hala Lake and Taiyang Lake from 2000 to 2020
3.2.2 人类活动对湖泊的影响
青海省境内的湖泊大多受人类活动直接影响较小[43],且以咸水湖和盐湖为主要类型,如柴达木盆地湖泊以盐湖为主,湖盆大多地势平坦,主要以大气降水和冰川融水作为补给源[44]。为有效开发利用盐湖资源,人类在湖区建坝阻隔河湖连通,直接导致盆地内盐湖的空间格局、面积和功能发生变化。以东台吉乃尔湖为例,2009年湖泊西北面的人工修筑堤坝和对其源头台吉乃尔河的改道截流,致使东台吉乃尔湖渐趋干盐化,遥感影像解译结果显示2020年湖泊面积仅为2000年的31.29%。位于可可西里地区的盐湖因2011年上游卓乃湖溃决导致其面积快速扩张[45],并对青藏铁路和青藏公路的安全运行构成直接威胁[46]。为此,2019年青海省水利厅建成可可西里盐湖引流疏导应急工程,在湖区东南侧开挖一条宽约50 m的排水通道,经清水河注入楚玛尔河,从根本上消除了盐湖自然漫溢的风险,这也使盐湖由内流湖转为外流湖。
青海省南部分布着一些淡水湖,如位于黄河源头的扎陵湖和鄂陵湖。鄂陵湖是青藏高原第一大淡水湖,湖水补给主要依靠大气降水和地表径流,属重碳酸盐类、镁Ⅰ型淡水湖[47]。为解决玛多县的用电问题,1998年修建黄河源水电站,2005年上游来水猛增造成水库回水直达鄂陵湖,直接导致2006—2008年鄂陵湖面积的快速扩张,2012年达峰值。水电站的修建抬高了湖区水位,提升了湖区的调节能力,降低了黄河冬季断流的可能性;而为了消除黄河下游的防洪安全隐患,2017年对水电站进行拆除,2018—2020年鄂陵湖扩张速率变缓,湖泊面积趋于稳定化。
3.2.3 冰川湖泊变化造成的影响
湖泊面积增加和水位上升使其周围房屋和公路等基础设施被淹没,严重时会发生湖泊溃决并引发溃决洪水和泥石流等一系列次生灾害[20]。以青海湖为例,1973—2004年湖区面积和水位均呈现下降趋势,使得湖岸线发生变迁,沙岛湖渐趋萎缩,沙质荒漠化程度加剧,加上人类的不合理开发利用活动,青海湖周围的草地出现较为严重的退化现象[19]。青海湖的萎缩和生态环境的恶化引起了人们的高度关注,通过转变发展模式进行生态管理。2004—2020年青海湖面积呈现波动增加趋势(15.37 km2/a),2020年青海湖面积达近20年来最大值(4439.65 km2),湖泊扩张导致铁布卡湾、泉湾和鸟岛等地区的道路、码头、草场和居民点被淹没[19],对当地牧民的生存造成一定程度的威胁,并导致刚毛藻水华范围有所扩大[65]。未来为了能够及时应对因冰川退缩和湖泊扩张引发的次生灾害,应加强对山区、地势低洼地段和湖水可能溢出危险区的监测,结合地形、水文和植被等诸多自然环境因素,从流域层面加快完善防灾减灾体系建设。
参考文献
青藏高原各拉丹东地区冰川变化的遥感监测
Glacier change in the Geladandong area of the Tibetan Plateau monitored by remote sensing
西北地区近年来内陆湖泊变化反映的气候问题
Climate change indicated by the recent change of inland lakes in Northwest China
湖泊遥感研究进展
A review of monitoring lake environment change by means of remote sensing
青藏高原环境变化对全球变化的响应及其适应对策
DOI:10.11867/j.issn.1001-8166.2006.05.0459
[本文引用: 1]

青藏高原的环境变化对全球变化具有敏感响应和强烈影响。青藏高原的现代环境与地表过程相互作用,引起包括冰冻圈和水资源以及生态系统等方面的一系列变化,对高原本身以及周边地区的人类生存环境和经济社会发展产生重大影响。作为国际研究的热点地区,青藏高原环境变化研究目前出现三个新的科学动向:关注关键地区的关键科学问题的系统研究;关注以现代地表过程为核心的监测研究;关注全球变化影响下的圈层相互作用研究。本项目的研究对青藏高原环境变化科学的发展、国际科学前沿的贡献以及服务于社会经济发展,都具有十分重要的意义。通过项目的研究将揭示青藏高原隆升到现代地貌与环境格局过程中所出现的重大构造事件和环境事件;重建不同区域、不同时间尺度的气候环境变化序列并揭示其时空分布特征;阐明青藏高原冰冻圈、湖泊和主要生态系统与土地覆被在不同气候条件下的变化特征;揭示青藏高原环境变化与地表过程对全球变化的响应特点和高原热力与动力过程对不同气候系统变化的影响。本项目将在高原南北典型区域利用地貌学与沉积学手段,研究青藏高原现代地貌与环境格局的形成过程;利用湖芯、冰芯、树木年轮等手段,研究青藏高原过去环境变化的特征事件、区域分异及其与全球变化的联系;利用冰川、冻土、积雪的时空变化,结合对高原特殊大气边界层的观测,研究青藏高原冰冻圈变化与能量水分循环过程;从冰川、湖泊、大气的监测入手,结合模式方法,研究青藏高原环境变化的机制;利用生态系统碳的源—汇变化,研究青藏高原生态系统对环境变化的响应;综合研究全球变化背景下青藏高原环境变化与水资源变化所产生的区域效应和适应对策。
The response of environmental changes on Tibetan Plateau to global changes and adaptation strategy
青藏高原冰川退缩对河水径流的影响
青藏高原发育着36 793条现代冰川,冰川面积49 873.44 km2,冰储量4 561 km3,分别占中国冰川总条数的79.5%,冰川总面积的84%和冰储量的81.6%。进入20世纪以来,随着全球气候的波动变暖,特别是进入20世纪80年代以来的快速增温,使得大多数冰川处于退缩趋势。20世纪上半叶是冰川前进期或由前进期转为后退的时期;50年代至60年代冰川出现大规模退缩,但并未形成冰川全面退缩;60年代末至70年代,许多冰川曾出现前进或前进迹象,前进冰川的比例增大,退缩冰川的退缩幅度减小; 80年代以来,冰川后退重新加剧;90年代以来冰川退缩强烈。现在虽仍有个别冰川在前进,但高原冰川基本上转入全面退缩状态,这是20世纪90年代以来冰川变化的一个重要特征。青藏高原哺育了亚洲的十多条河流,包括长江、黄河、恒河、印度河、雅鲁藏布江、怒江和澜沧江等七条最重要的河流。近数十年来,在全球变暖和冰川退缩加快的大背景下,青藏高原七大江河径流量亦呈现出不稳定的变化。从趋势上看,短期内冰川退缩将使河流水量呈增加态势,但亦会加大以冰川融水补给为主的河流或河段的不稳定性;而随着冰川的持续退缩,冰川融水将锐减,以冰川融水补给为主的河流,特别中小支流将面临逐渐干涸的威胁。
Impacts of glacial retreat on runoff on Tibetan Plateau
20世纪以来西藏冰湖溃决灾害事件梳理
Study on the glacial lake outburst flood events in Tibet since the 20th century
青藏高原冰川变化遥感监测研究综述
在全球变暖影响下,青藏高原冰川消融造成的冰川径流增大、冰湖溃决等问题威胁着山区及其周边居民的生命财产安全,对青藏高原冰川变化的研究日益紧迫。本文综述了国内外山地冰川变化遥感监测手段的发展、冰川面积及冰面高程变化的遥感监测研究现状、存在问题与发展趋势,并总结了中国青藏高原冰川变化遥感监测研究的主要成果。此外,本文基于2003-2009年ICESat/GLAS数据,计算了青藏高原各山区冰面高程变化及其冰川消融量。结果显示:青藏高原冰川面积持续减少,青藏高原冰面高程的平均变化为-0.24±0.03 m/a,冰川融水量为-14.86±11.88 km<sup>3</sup>/a,冰川变化呈现从青藏高原东、南外缘山区往内陆与西、北部山区减慢的时空特征。
A review on the research of glacier changes on the Tibetan Plateau by remote sensing technologies
再论青藏高原范围
DOI:10.11821/dlyj020210138
[本文引用: 1]
伴随青藏高原研究的深入,高原内外多学科研究程度和认识的提高,及地理大数据、地球观测科学和技术的进步,对青藏高原范围提出了新的要求。本研究系统论述了确定青藏高原范围的原则、依据和方法,分析探讨了高原地貌宏观结构(高原面、高原内低盆地与高原边缘河谷低地等)和周围边界各自然地段构成的基本特征。采用ArcMap软件,通过遥感影像和DEM数据及新资料对高原地貌比较研究,实现了1:100万比例尺地图精度的青藏高原范围的界定。研究表明,青藏高原北起西昆仑山-祁连山山脉北麓,南抵喜马拉雅山等山脉南麓,南北最宽达1560 km;西自兴都库什山脉和帕米尔高原西缘,东抵横断山等山脉东缘,东西最长约3360 km;范围为25°59′26″N~40°1′6″N、67°40′37″E~104°40′43″E,总面积为308.34万km<sup>2</sup>,平均海拔约4320 m。在行政区域上,青藏高原分布于中国、印度、巴基斯坦、塔吉克斯坦、阿富汗、尼泊尔、不丹、缅甸、吉尔吉斯斯坦等9个国家。其中中国境内的青藏高原面积约258.09万km<sup>2</sup>(占高原总面积的83.7%),平均海拔约4400 m,分布在西藏、青海、甘肃、四川、云南和新疆等6省区,西藏和青海两省区主体分布在高原范围内(约占高原总面积的60.6%)。
Redetermine the region and boundaries of Tibetan Plateau
DOI:10.11821/dlyj020210138
[本文引用: 1]
With the advances in research of the Tibetan Plateau (TP) and the deep understanding of multi-disciplinary research, coupled with the progress of geographic big-data, earth observation science and technology, this research systematically discussed the principles, methods and basis for determining the boundaries of the TP. It analyzed the macro landform structures (plateau surface, low basin and deep-cut valley lowland on the edge of the TP) within the TP and the fundamental characteristics of the geographic units' composition in TP's surrounding areas. Based on the high resolution remote sensing images, DEM data and geomorphologic maps etc., the boundary of TP with a 1:1000000 scale is defined through a comparative study of geomorphological features with the support of Arcmap 10.5. The results show that the Tibetan Plateau stretches from the foot of the Himalayas in the south to the foot of the Kunlun Mountains and the Qilian Mountains in the north, with a total length of 1560 km. While it spans about 3360 km from the Hindu Kush Mountains and the Pamir Plateau in the west, to the eastern foot of Hengduan Mountains in the east. The TP, lying between 25°59′26″N-40°1′6″N and 67°40′37″E-104°40′43″E, covers a total area of 3083.44 × 103 km2, with an average altitude of 4320 m. Geographically, the TP is located in Southwest China and eight other countries including India, Pakistan, Tajikistan, Afghanistan, Nepal, Bhutan, Myanmar and Kyrgyzstan. The TP in Chinese section has an area of 2580.90 × 10 3 km2, accounting for around 83.7% of the total area, with an average altitude of 4400 m. In China's part, the TP spans in six provincial-level regions: Tibet Autonomous Region (TAR), Qinghai province, Gansu province, Sichuan province, Yunnan province and Xinjiang Uygur Autonomous Region. Among them, the main parts of TAR and Qinghai are the major section of the TP, which accounted for 60.6% of the total area of the plateau.
青藏高原界线2021年版数据集
Boundary data of the Tibetan Plateau (2021 Version)
Recent glacial retreat and its impact on hydrological processes on the Tibetan Plateau, China, and surrounding regions
DOI:10.1657/1523-0430(07-510)[YAO]2.0.CO;2 URL [本文引用: 1]
中国湖泊的数量、面积与空间分布
China's lakes at present: Number, area and spatial distribution
The impacts of climate change on water resources and agriculture in China
DOI:10.1038/nature09364 URL [本文引用: 1]
Glacial fluctuations and its impacts on lakes in the Southern Tibetan Plateau
DOI:10.1007/s11434-010-4327-5 URL [本文引用: 1]
Contrasting evolution patterns between glacier-fed and non-glacier-fed lakes in the Tanggula Mountains and climate cause analysis
DOI:10.1007/s10584-015-1578-9 URL [本文引用: 1]
Hydrological trend of Qinghai Lake over the last 60 years: Driven by climate variations or human activities?
DOI:10.2166/wcc.2018.033 URL [本文引用: 1]
1973—2018年青海湖岸线动态变化
Dynamic change of Lake Qinghai shoreline from 1973 to 2018
DOI:10.18307/2020.0225 URL [本文引用: 3]
2004年以来青海湖快速扩张对人居设施与草地的潜在影响
Potential impact of the dramatical expansion of Lake Qinghai on the habitat facilities and grassland since 2004
DOI:10.18307/2021.0325 URL [本文引用: 2]
Glacier changes in the Qilian Mountains in the past half-century: Based on the revised First and Second Chinese Glacier Inventory
DOI:10.1007/s11442-018-1468-y
[本文引用: 1]
<p>Glaciers are the most important fresh-water resources in arid and semi-arid regions of western China. According to the Second Chinese Glacier Inventory (SCGI), primarily compiled from Landsat TM/ETM+ images, the Qilian Mountains had 2684 glaciers covering an area of 1597.81±70.30 km<sup>2</sup> and an ice volume of ~84.48 km<sup>3</sup> from 2005 to 2010. While most glaciers are small (85.66% are <1.0 km<sup>2</sup>), some larger ones (12.74% in the range 1.0-5.0 km<sup>2</sup>) cover 42.44% of the total glacier area. The Laohugou Glacier No.12 (20.42 km<sup>2</sup>) located on the north slope of the Daxue Range is the only glacier >20 km<sup>2</sup> in the Qilian Mountains. Median glacier elevation was 4972.7 m and gradually increased from east to west. Glaciers in the Qilian Mountains are distributed in Gansu and Qinghai provinces, which have 1492 glaciers (760.96 km<sup>2</sup>) and 1192 glaciers (836.85 km<sup>2</sup>), respectively. The Shule River basin contains the most glaciers in both area and volume. However, the Heihe River, the second largest inland river in China, has the minimum average glacier area. A comparison of glaciers from the SCGI and revised glacier inventory based on topographic maps and aerial photos taken from 1956 to 1983 indicate that all glaciers have receded, which is consistent with other mountain and plateau areas in western China. In the past half-century, the area and volume of glaciers decreased by 420.81 km<sup>2</sup> (-20.88%) and 21.63 km<sup>3</sup> (-20.26%), respectively. Glaciers with areas <1.0 km<sup>2</sup> decreased the most in number and area recession. Due to glacier shrinkage, glaciers below 4000 m completely disappeared. Glacier changes in the Qilian Mountains presented a clear longitudinal zonality, i.e., the glaciers rapidly shrank in the east but slowly in the central-west. The primary cause of glacier recession was warming temperatures, which was slightly mitigated with increased precipitation.</p>
黄河源区阿尼玛卿山典型冰川表面高程近期变化
Recent surface elevation changes of three representative glaciers in Anyêmaqên Mountains, source region of Yellow River
2000—2010年祁连山冰川冰储量变化
Change of ice volume in the Qilian Mountains during the period from 2000 to 2010
1987—2018年祁连山冰川变化遥感监测及影响因子分析
DOI:10.7522/j.issn.1000-0240.2019.0080
[本文引用: 1]
祁连山冰川融水是维系我国西北地区生态平衡的重要因素。为评估祁连山冰川在全球气候变暖背景下的状态, 利用Landsat-TM、 ETM+、 OLI等遥感影像, 基于波段比值阈值法提取1987 - 2018年共计7期冰川边界进行时序变化分析。结果显示: 近31年来祁连山冰川面积从2 080.39 km<sup>2</sup>退缩到1 442.09 km<sup>2</sup>, 年均退缩率达0.99%, 相比1956 - 1990年间的退缩率(0.58%)大幅增加; 近31年来冰川物质平衡线高度稳步上升; 冰川主要分布在海拔4 700 ~ 5 100 m之间, 冰川退缩随海拔降低而增加; 约93%的冰川的面积小于2.0 km<sup>2</sup>, 小于0.1 km<sup>2</sup>的冰川的总数和总面积呈增加态势; 0.5 ~ 1.0 km<sup>2</sup>的冰川退缩最快, 年均退缩率达1.53%, 而大于10.0 km<sup>2</sup>的冰川退缩最慢, 年均退缩率为0.59%; 祁连山冰川退缩主要由夏季均温升高引起, 且最近十年间冰川呈现出加速退缩的态势。
Using remote sensing images to monitor the glacier changes in Qilian Mountains during 1987-2018 and analysing the impact factors
祁连山七一冰川物质平衡的时空变化特征
Spatial and temporal variations in mass balance of Qiyi Glacier in Qilian Mountains
DOI:10.31497/zrzyxb.20200212 URL [本文引用: 1]
1956—2017年河西内流区冰川资源时空变化特征
Spatial-temporal variation of glacier resources in the Hexi interior from 1956 to 2017
2000年以来青藏高原湖泊面积变化与气候要素的响应关系
Changes of lake areas and its response to the climatic factors in Tibetan Plateau since 2000
DOI:10.18307/2019.0225 URL [本文引用: 1]
青藏高原河川径流变化及其影响研究进展
Streamflow change on the Qinghai-Tibet Plateau and its impacts
全球变化背景下青藏高原及周边地区冰川变化的时空格局与趋势及影响
Spatiotemporal pattern, trend, and influence of glacier change in Tibetan Plateau and surroundings under global warming
基于第二次编目的中国冰川现状
DOI:10.11821/dlxb201501001
[本文引用: 1]
以2004年之后的Landsat TM/ETM+和ASTER遥感影像为基础,参考第一次中国冰川目录及其他文献资料,经过影像校正、自动解译、野外考察、人工修订、交互检查和成果审定等技术环节,完成占全国冰川总面积85.5%的现状冰川编目,确定中国目前共有冰川48571条,总面积约5.18×10<sup>4</sup>βkm<sup>2</sup>,约占全国国土面积的0.54%,冰川储量约4.3~4.7×10<sup>3</sup>βkm<sup>3</sup>。中国冰川数量和面积分别以面积<0.5βkm<sup>2</sup>的冰川和面积介于1.0~50.0βkm<sup>2</sup>的冰川为主,面积最大的冰川是音苏盖提冰川(359.05βkm<sup>2</sup>)。中国西部14座山系(高原)均有冰川分布,其中昆仑山冰川数量最多,其次是天山、念青唐古拉山、喜马拉雅山和喀喇昆仑山,这5座山系冰川数量占全国冰川总数量的72.3%;冰川面积和冰储量位列前3位的山系分别为昆仑山、念青唐古拉山和天山,尽管喀喇昆仑山冰川数量和面积均小于喜马拉雅山,但前者冰储量高于后者。从冰川海拔分布来看,海拔4500~6500βm之间是冰川集中发育区域,约占全国冰川总面积的4/5以上。冰川资源在各流域分布差异显著,东亚内流区(5Y)是中国冰川分布数量最多、面积最大的一级流域,约占全国冰川总量的2/5以上;黄河流域(5J)是冰川数量最少、规模最小的一级流域,仅有冰川164条,面积126.72βkm<sup>2</sup>。新疆和西藏的冰川面积和冰储量约占全国冰川总面积的9/10。
The contemporary glaciers in China based on the Second Chinese Glacier Inventory
DOI:10.11821/dlxb201501001
[本文引用: 1]
The Second Chinese Glacier Inventory (SCGI) was compiled based on remote sensing images after 2004 including Landsat TM/ETM+ and ASTER images, and the digital elevation models (DEMs) from SRTM. The SCGI shows that there are 48,571 glaciers with a total area of 5.18×10⁴ km2 and ice volume of 4.3×10³-4.7×10³ km3 in China (including glaciers measured from 1:50,000 or 1:100,000 topographic maps made from the 1960s to the 1980s because of no high quality remote sensing images for the contemporary glacier inventories). The number of glaciers with the area below 0.5 km2 reaches 33,061 and accounts for the majority part (66.07%) of glaciers in China. Glaciers with areas between 1.0 km2 and 50.0 km2 are totaled as ~3.40×10⁴ km2 (~2.65×10³ km3 in ice volume) and constitute the main part of glaciers in China. The Yengisogat Glacier (359.05 km2), located in the Shaksgam Valley, north slope of the Karakoram Mountain, is the largest glacier in China. The glaciers are spatially distributed in 14 mountains and plateaus in western China. The Kunlun Mountains has the largest number of glaciers in China, followed by Tianshan Mountains, Nyainqêntanglha Range, the Himalayas and Karakoram. Glaciers in the above five mountains account for 72.26% of the total glacier number in China, however, over 55% of the total area of glaciers and 59% of the total ice storage in China are concentrated in the Kunlun Mountains, Nyainqêntanglha Range and Tianshan Mountains. The number and area of glaciers in Karakoram Mountains are less than those in the Himalayas, but the volume of the former is more than that of the latter because the glaciers in the Karakoram are generally larger. Some 4/5 of the total area of glaciers in China is mainly distributed in an altitudinal band between 4500-6500 m a.s.l. with regional differences depending on the general elevations of various mountains. Analogously, there is an obvious difference of glaciers in basins. The first level basin having the most glaciers is the East Asia interior drainage area (5Y) which occupies ~40% of glaciers in China. The Yellow River basin (5J) has the fewest glaciers where only 164 with an area of 126.72 km2 are distributed. Xinjiang and Xizang autonomous regions are the two provincial units rich in glaciers, with ~9/10 of the total area and ice storage of glaciers in China.
The Shuttle Radar Topography Mission (SRTM): A breakthrough in remote sensing of topography
DOI:10.1016/S0094-5765(01)00020-0 URL [本文引用: 1]
Recommendations for the compilation of glacier inventory data from digital sources
1964—2010年青藏高原长江源各拉丹冬地区冰川变化及不确定性分析
Variation and uncertainty analysis of the glaciers in the past 50 years in Geladandong of Tibetan Plateau
The second Chinese glacier inventory: Data, methods and results
DOI:10.3189/2015JoG14J209 URL [本文引用: 1]
利用流域边界和坡向差自动提取山脊线
Automatic extraction of ridgelines using on drainage boundaries and aspect difference
Comparison of satellite- derived with ground-based measurements of the fluctuations of the margins of Vatnajökull, Iceland, 1973-1992
DOI:10.3189/S0260305500011964 URL [本文引用: 1]
Consideration of the errors inherent in mapping historical glacier positions in Austria from ground and space (1893-2001)
DOI:10.1016/S0034-4257(03)00134-2 URL [本文引用: 1]
The use of the Normalized Difference Water Index (NDWI) in the delineation of open water features
DOI:10.1080/01431169608948714 URL [本文引用: 1]
2000—2014 年中国西北地区湖泊面积的时空变化
Spatial-temporal variations in lakes in Northwest China from 2000 to 2014
DOI:10.1016/j.chnaes.2017.06.001 URL [本文引用: 1]
A database of worldwide glacier thickness observations
A geometric glacier model for sea level change calculations
DOI:10.3189/172756500781833034 URL [本文引用: 1]
Linear modelling of glacier length fluctuations
青藏高原内陆湖泊变化的遥感制图
Remotely sensed mapping of inland lake area changes in the Tibetan Plateau
DOI:10.18307/2011.0301 URL [本文引用: 1]
可可西里地区库赛湖变化及湖水外溢成因
DOI:10.11821/xb201205011
[本文引用: 1]
以库赛湖研究区地形图、Landsat TM/ETM+和中国环境与灾害监测预报卫星HJ1A/BCCD影像为基础,结合五道梁气象站气温降水资料,利用地理信息技术和数理统计方法,对2011 年9 月可可西里地区库赛湖湖水外溢成因进行分析。结果表明,库赛湖湖水外溢发生在2011 年9 月20 日至30 日期间,卓乃湖湖水进入库赛湖是后者发生变化的直接原因,而库赛湖规模近20 年来的持续增长,尤其是2006 年之后湖泊面积快速增加是其湖水外溢的基础。卓乃湖湖水外泄的主要诱因是区域持续降水,其中8 月17 日和21 日强降水使卓乃湖于8 月22 日出现漫顶溢流,8 月31 日至9 月5 日、9 月16 日至17 日期间两次持续降水导致卓乃湖水量剧增,并在9 月14 日至21 日期间形成洪水。由于水量外泄,卓乃湖面积骤降,截至11 月29 日,湖泊面积168.07 km<sup>2</sup>,仅为8 月22 日湖泊面积的62%,共减少104.88 km<sup>2</sup>。库赛湖外溢湖水流入海丁诺尔后又进入盐湖,其中海丁诺尔湖水进入盐湖时间介于10 月6 日至20 日期间。外来湖水大量进入导致海丁诺尔和盐湖在10-11月份快速扩大。
Changes of Kusai Lake in Hoh Xil region and causes of its water overflowing
DOI:10.11821/xb201205011
[本文引用: 1]
Based on topographic maps, Landsat TM/ETM+ images, China Environment and Hazards Monitoring and Prediction Satellite (HJ1A/B) CCD images and meteorological materials observed at Wudaoliang meteorological station, we explore the change causes of Kusai Lake using geographical information techniques and mathematical statistics method. The results show that water overflowing Kusai Lake occurred in September 20-30 in 2011, and the direct reason was the flood from Zhuonai Lake flowing into Kusai Lake. In addition, Kusai Lake has been growing in recent decades; especially after 2006 it experienced a quick increase that formed the foundation of lake water overflow. The main factor resulting in the flood from Zhuonai Lake was the steady precipitation. Specifically, the heavy precipitation on August 17 and 21 made Zhuonai Lake water outflow on August 22, 2011; then continuous precipitation during August 31 to September 9, 16 and 17 subsequently formed a serious flood from September 14 to 21. Accordingly, there was a sudden drop in area of Zhuonai Lake. As of November 29, the lake decreased to 168.07 km<sup>2</sup> (a reduction of by 104.88 km<sup>2</sup>), accounting for 62% of the area on August 22. The outflow water from Kusai Lake flowed into Haidingnuoer Lake, then into Yanhu Lake. The latter occurred during October 6-20. Due to sudden rapid flow, both Haidingnuoer and Yanhu lakes suffered a quick expansion from October to November, 2011.
Overflow probability of the Salt Lake in Hoh Xil Region
DOI:10.1007/s11442-018-1496-7
[本文引用: 1]
After the bursting of Huiten Nor in Hoh Xil Region in September, 2011, the topic on whether the water overflowed from the Salt Lake would enter into the Chumaer River and become the northernmost source of the Yangtze River has aroused wide concern from public and academic field. Based on Landsat TM/ETM+/OLI remote sensing images during 2010-2015, SRTM 1 arc-second data, Google Earth elevation data and the observation data from the Wudaoliang meteorological station, the study initially analyzed the variations of the Salt Lake and its overflowing condition and probability. The results showed that the area of the Salt Lake expanded sharply from October 2011 to April 2013, and then it stepped into a stable expansion period. On October 27, 2015, the area of the Salt Lake had arrived at 151.38 km2, which was about 3.35 times the area of the lake on March 3, 2010. The Salt Lake will overflow when its area reaches the range from 218.90 km2 to 220.63 km2. Due to the differences between SRTM DEM and Google Earth elevation data, the water level of the Salt Lake simulated would be 12 m or 9.6 m higher than the current level when the lake overflowed, and its reservoir capacity would increase by 23.71 km3 or 17.27 km3, respectively. Meanwhile, the overflowed water of the Salt Lake would run into the Qingshui River basin from its eastern part. Although the Salt Lake does not overflow in the coming decade, with watershed expansion of the Salt Lake and the projected precipitation increase in Hoh Xil region, the probability of water overflow from the Salt Lake and becoming a tributary of the Yangtze River will exist in the long term.
Ngoring Lake, Qinghai-Tibet Plateau, China
青藏高原及周边地区近期冰川状态失常与灾变风险
Glacier anomalies and relevant disaster risks on the Tibetan Plateau and surroundings
青藏高原最近40年湖泊变化的主要表现与发展趋势
Lake variations on Tibetan Plateau of recent 40 years and future changing tendency
青藏高原及周边地区的冰川灾害
Glacial hazards on Tibetan Plateau and surrounding alpines
2008—2018年中国冰川变化分析
DOI:10.7522/j.issn.1000-0240.2021.0055
[本文引用: 1]
调查冰川资源的分布与变化,对区域乃至全球的自然环境与经济社会发展都具有十分重要的意义。基于315景Landsat 8 OLI遥感影像,结合中国第二次冰川编目数据与Google Earth软件,通过人工目视解译等方法调查了2018年中国冰川的分布与变化。结果表明:中国现存冰川53 238条,总面积为(47 174.21±19.93) km<sup>2</sup>,72%的冰川面积<0.5 km<sup>2</sup>,规模在1~32 km<sup>2</sup>的冰川的面积占中国冰川总面积的60%。2008—2018年,中国冰川总面积减少1 393.97 km<sup>2</sup>,面积变化率为-0.43%?a<sup>-1</sup>。冰川面积变化率表现出明显的空间差异,面积退缩最快的是冈底斯山,达-1.07%?a<sup>-1</sup>;最慢的是羌塘高原,为-0.05%?a<sup>-1</sup>。坡度上,各山系之间的冰川面积变化率差异较为明显。超过70%的山系位于正东和东南方向的冰川面积退缩快,2008—2018年退缩率为-5.0%;正北方向的冰川面积退缩相对缓慢,同时期退缩率为-3.8%。气温和降水变化率差异以及海拔、坡度、坡向等地形差异,共同影响中国冰川的变化。
Analysis of glacier changes in China from 2008 to 2018
DOI:10.7522/j.issn.1000-0240.2021.0055
[本文引用: 1]
For the regional and global natural environment and economic and social development,it is of great significance to investigate the distribution and changes of glacier. In this paper, the boundary of the existing glaciers in China was achieved by manually visual interpretation guided by the methodology of the Second Chinese Glacier Inventory based on 315 Landsat 8 OLI remote sensing images, global watershed data and Google Earth in 2018. The state and area changes of glacier were examined during 2008—2018 compared to glacier boundary from the Second Chinese Glacier Inventory. The results show that there are 53 238 glaciers with a total area of (47 174.21±19.93) km2 in China currently, 72% of the glaciers in China are less than 0.5 km2, and the area of glaciers with a scale of 1 to 32 km2 accounts for 60% of the total area of Chinese glaciers. From 2008 to 2018, the total area of glaciers in China has decreased by 1 393.97 km2, and the area change rate was -0.43%?a-1. The area change rate of glacier shows obvious spatial heterogeneity. The fastest rate of glacier area retreat is the Gangdisê Mountains, reaching -1.07%?a-1; the slowest is the Qiangtang Plateau, with -0.05%?a-1. In terms of slope, the difference in change rate of glacier area between various mountains is relatively obvious. During 2008—2018, more than 70% of the mountains are located in the east and southeast with a fast average retreat ratio, which is -5.0%, and the retreat of glaciers in the north direction is relatively slow, with a retreat ratio of -3.8% during the same period. Differences in temperature and precipitation change rates, as well as differences in altitude, slope and aspect, affect glacier changes in China together.
1986—2015年青藏高原哈拉湖湖泊动态对气候变化的响应
Response of lake dynamics to climate change in the Hala Lake basin of Tibetan Plateau from 1986 to 2015
DOI:10.31497/zrzyxb.20210218 URL [本文引用: 1]
高亚洲地区冰崩灾害的研究进展
Advances in the study of glacier avalanches in High Asia
青藏高原铁路沿线雪崩危险度评价方法
Method for avalanche risk evaluation along Qinghai-Tibet Plateau railway
简要介绍了3条进藏铁路的主要雪害,指出雪崩危险度评价对铁路选线和配置防护雪害设施有重要意义.青藏铁路的雪害主要是风吹雪,滇藏、川藏铁路的雪害主要是雪崩.雪崩的形成和发生的必要条件是一定深度的积雪和一定范围的坡度.笔者通过理论计算得出积雪的临界厚度和山坡的临界安全角度.在分析影响雪崩的主要因素的基础上,利用模糊归一化方法来评价雪崩的发生危险度,并引用国外方法来计算雪崩达到某点的概率.最后,指出雪崩评价方法需要改进之处和铁路选线时应注意的问题.
藏东南帕隆藏布流域雪崩关键影响因素与易发性区划研究
Key predisposing factors and susceptibility mapping of snow avalanche in Parlung-Tsangpo catchment, Southeast Tibetan Plateau
1973—2018年布喀达坂峰地区前进冰川遥感监测
Remote sensing monitoring of advancing glaciers in the Bukatage Mountains from 1973 to 2018
DOI:10.31497/zrzyxb.20190808 URL [本文引用: 1]
Risk assessment of glacial debris flow on alpine highway under climate change: A case study of Aierkuran Gully along Karakoram Highway
DOI:10.1007/s11629-021-6689-3 URL [本文引用: 1]
“一带一路”区域冰冻圈变化及其对水资源的影响
DOI:10.11867/j.issn.1001-8166.2020.002
[本文引用: 1]
“一带一路”区域横跨亚洲、欧洲和非洲东部、北部,空间范围大。在全球气候变暖背景下,“一带一路”区域的冰冻圈正在发生快速变化,将对区域水资源、生态系统、北极航道等带来深刻影响。综述了近几十年来“一带一路”沿线和周边区域(包括亚洲、欧洲、北极和非洲等)冰冻圈要素(包括冰川、多年冻土、积雪、海冰、河冰和湖冰)的变化及其对水资源的影响,主要认知为:①绝大部分冰川面积萎缩、冰川物质平衡处于亏损状态,但存在区域差异;②多年冻土温度升高,冻土分布下限上升,活动层厚度增大,多年冻土整体处于退化状态;③积雪范围明显缩减、积雪深度总体呈增加趋势,积雪期缩短,即积雪首日延后、消融期提前,但变化存在显著区域差异;④北极夏季海冰范围快速减少、厚度减薄,多年冰减少,反映了海冰的快速萎缩,河/湖冰初冰日延后、消融日提前、冰封期缩短;⑤中国冰川融水径流显著增加,积雪融水和多年冻土退化也在不同程度上增加了流域径流,反映出冰冻圈变化对径流的重要影响。“一带一路”区域冰冻圈萎缩的现状及其对水资源的影响分析,将为应对气候变化和区域可持续发展提供重要科学支撑。
Cryospheric changes and their impacts on water resources in the Belt and Road regions
The 2020 glacial lake outburst flood at Jinwuco, Tibet: Causes, impacts, and implications for hazard and risk assessment
DOI:10.5194/tc-15-3159-2021 URL [本文引用: 1]
Increasing glacial lake outburst flood hazard in response to surge glaciers in the Karakoram
“亚洲水塔”变化的灾害效应与减灾对策
Disaster effect induced by Asian water tower change and mitigation strategies
Ice-dams, outburst floods, and movements heterogeneity of glaciers, Karakoram
DOI:10.1016/j.gloplacha.2019.05.004 URL [本文引用: 1]
1959—2008年乌鲁木齐河源1号冰川融水径流变化及其原因
Analysis of runoff variation of Glacier No.1 at the headwaters of the Urumqi River from 1959 to 2008
多模式预测气候变化及其对雪冰流域径流的影响
Predicting climate change and its impact on runoff in snow-ice basin with multi-climate models
Long-term temporal and spatial monitoring of Cladophora blooms in Qinghai Lake based on multi-source remote sensing images
DOI:10.3390/rs14040853 URL [本文引用: 1]
