

水资源是人类社会可持续发展的重要物质[1]。然而,随着经济社会不断发展,水资源短缺问题已成为中国可持续发展的严重制约因素[2,3]。尤其是在人口和经济集中的城市地区,城市空间的扩张和经济规模的增长等都在持续驱动水资源需求的增加[4],诱发区域水安全危机。此外,由于地理位置、水资源禀赋以及发展状况的差异性,不同城市在水资源的开发利用过程中,所面临抑或是暴露的问题并不相同,危机根源具有多元性。城市发展的阶段不同,其面临的水资源短缺问题也会发生变化,其发展轨迹会随着城市发展阶段的改变,呈现出不同的危机转化或发展过程。因此,探索城市水资源短缺的类型及其发展轨迹,认识城市水资源短缺与城市发展过程之间的协同关系尤为重要。
目前,水资源短缺研究主要涉及三个方面:一是水资源短缺程度的评价。人均水资源占有量[5,6]是最早也是最广泛的用以衡量区域水资源短缺程度的评判指标。其后,随着学界对水资源短缺问题的认识不断深入,基于不同视域的评价方法与体系被陆续应用到水资源短缺的评价研究中。OhIsson[7]将人类社会发展状况纳入水资源短缺评价系统,提出了社会水资源短缺指数(Social Water Scarcity Index,SWSI)的概念。赵勇等[8]在分析城市供、需水状况的基础上,借助缺水率来衡量中国城市的水资源短缺程度,发现缺水最严重的是华北地区城市,东北地区紧随其后。为了应对不同评价方法间评价结果的差异性问题,梁媛等[9]提出了基于循环修正的水资源短缺评价模型,有效地改善了评价结果的不一致性。王崴等[10]从压力—状态—响应的评价角度出发,结合DCE(Dynamic Comprehensive Evaluation)理论,研究了北京市各区县水资源短缺程度与动态变化趋势。此外,刘俊国等[11]从水量—水质—生态三个重要的水资源要素入手,构建了三维(“质—量—生”)水资源短缺评价体系,进一步扩充了水资源短缺评价方法系统。二是水资源短缺类型的识别。相关研究主要从天然水资源禀赋、供水水平、水资源利用效率和水质状况四个方面将水资源短缺类型划分为资源型、工程型、管理(效率)型和水质型缺水[12]。部分学者还将由于区域水资源数量与当地人口和经济规模不相匹配引起的缺水归类为过载型缺水[13],也有学者通过测算社会系统对水资源短缺的响应能力,提出了适应型缺水的概念[14]。此外,多种因素同时作用造成的水资源短缺问题被称作混合型或综合型缺水[15]。三是水资源短缺的归因分析。大量研究表明,天然水资源量的匮乏[16]与不断膨胀的人口[17]是造成区域水资源短缺的主要归因,而随着人类经济社会的发展,频繁出现的水污染现象使水资源短缺问题愈发严峻和复杂[18]。与此同时,全球气候变化[19]、极端天气事件增加[20]、用水效率低下[21]以及不合理的经济结构[22]等也是限制水资源可持续利用的重要因素。
梳理已有研究成果可知,有关区域水资源短缺的研究已取得长足的进展,既有国家[23]和流域[24]尺度的,也有省份[25]与城市[26]尺度的,且采用的研究方法或手段也都不尽相同[27,28]。但现有研究大多聚焦于水资源短缺程度评价和短缺类型及归因分析,受限于技术手段,目前对水资源短缺问题的发展轨迹、类型转化以及与城市发展之间的关联研究尚不深入,没有很好地探明城市在不同发展阶段可能遇到的水资源短缺问题。而近年来提出的组基轨迹模型(Group-Based Trajectory Model,GBTM)为水资源短缺的发展轨迹研究提供了可能。GBTM是研究变量随时间变化的发展轨迹的一种方法,其最早起源于犯罪学领域[29],随着模型的改进与应用范围的扩展,还出现了可分析多维度纵向变量间关系的组基多轨迹模型(Group-Based Mult-Trajectory Model,GBMTM),并在医学[30]和社会学[31]等领域得到了广泛的应用。GBTM在纵向数据的处理中具有独特的优势[32],它能充分利用时序变量信息,且模型结果可呈现为简洁清晰的图像[33],这样的模型特点可为本领域的研究提供极大的便利。
鉴于此,本文拟将GBTM引入水文学及水资源领域,在区域水资源短缺程度评价的基础上,进一步利用其开展水资源短缺驱动因素、类型转换以及发展轨迹的识别与分析。具体而言,选取中国32个主要城市为评估对象,基于构建的城市水资源短缺程度评价体系,应用主成分分析法(PCA)对32个城市2011—2020年的水资源短缺程度进行综合评价与空间展布,并透过各主成分释义,划定32个城市的水资源短缺类型,进一步通过GBMTM模型对城市水资源短缺类型的演化特征与发展轨迹进行识别及分析,以图探明不同类型城市在不同阶段水资源短缺的诱因,梳理城市发展与水资源短缺的伴生关系,进而为城市发展过程中的水安全与高质量发展提供科学参考。
1 研究方法与数据来源
1.1 研究方法
1.1.1 主成分分析法
作为一种客观评价方法,主成分分析法在高维数据的分析处理中具有显著的优势[34],其首先将原本相互关联的多维指标重组为少数相互独立的主成分,并通过主成分进行统计分析,避免了多维指标的信息重叠与冗余。重组得到的主成分包含了原多维指标的绝大部分信息,使评价更加清晰简便的同时又不失其有效性。因此,本文拟应用主成分分析法构建城市水资源短缺程度评价模型,具体步骤如下:
(1)原始数据的预处理。数据标准化和负向指标的正向化是综合评价的必要步骤,目的是消除评价指标间量纲和数量级的差异,使各指标具有一致性和可比性[35]。
使用Z-Score公式将原始数据标准化,对于正向指标:
对于负向指标:
式中:i为评价对象序列;j为评价指标序列;Iij为第i个评价对象的第j个评价指标的标准化数值;Xij为第i个评价对象的第j个评价指标的原始值;
(2)主成分筛选。根据标准化数据计算相关系数矩阵R,并得到相关系数矩阵的特征值和特征向量,选取特征值大于1且方差累计贡献率超过80%的最小成分数p为主成分个数,方差累计贡献率按下式计算:
式中:α为方差累计贡献率;p为主成分个数(个);αj为第j个指标的方差贡献率;n为指标总个数(个)。
(3)根据特征值和特征向量计算主成分荷载值:
式中:bkj为第k个主成分中第j个指标的荷载值;ukj为第k个主成分中第j个指标的特征向量值;λk为第k个主成分的特征值。
(4)计算各主成分评价值,对于第i个评价对象有:
式中:Fik为第i个评价对象的第k个主成分评价值。
(5)建立缺水程度主成分评价模型,第i个评价对象的综合评分计算如下:
式中:Fi为第i个评价对象的综合评分;Mik为第i个评价对象的第k个主成分加权值;αk为第k个主成分的方差贡献率;α为p个主成分的方差累计贡献率。
1.1.2 组基多轨迹建模
组基轨迹模型(Group-Based Trajectory Model,GBTM)是有限混合建模的一种应用,能够识别总体中遵循相似发展轨迹的个体群组,并给出相应的拟合轨迹[36]。因其半参数性质,当轨迹未知时,GBTM可用于近似轨迹的总体分布,模型分组越多,分组结果就越接近原始数据的分布情况,对实际情况的刻画也就更加精确。目前主流的统计软件SAS和Stata均可实现GBTM的应用,建模插件来源于
组基多轨迹建模(Group-based Multi-trajectory Modeling,GBMTM)是GBTM的应用扩展。不同于GBTM只能根据单一变量进行相似群组的识别与描述,GBMTM可同时根据多个变量进行建模分组,并对比不同变量的轨迹形态,探索各变量间的关系。假设总体由J个轨迹组构成,用Yi=(yi1, yi2, …, yiT)表示个体i在T时间内指标的纵向观测值,则Yi的概率P(Yi) 可表示如下:
式中:πj为随机选择的个体属于组j的概率,即总体中组j的占比;Pj(Yi) 为Yi的概率分布函数,表示个体i在组j中观测值为Yi的概率。
对于给定的轨迹组j,假定其组成员变量值在时间线上具有条件独立性,即Yi中的yit独立于t时间之前的值yit-1, yit-2, …,因此:
式中:pj(yit)为给定轨迹组j中yit的概率分布函数。
模型的参数一般由极大似然估计法(Maximum Likehood Estimate,MLE)估计得到,pj(yit) 可以服从正态分布(Normal Distribution)、删失正态分布(Censored Normal Distribution)以及泊松分布(Poisson Distribution)等,其区别在于似然函数的具体形式不同,关于GBMTM更详细的介绍可参考Nagin等[37]的研究,此处不再赘述。
根据Nagin等[37]总结的模型准确度检验方法,本文选取以下两种方法作为衡量标准:
(1)组成员平均后验分配概率(Average Posterior Probability,AvePP)不小于0.7,其中,个体i属于组j的后验概率按下式计算:
式中:
(2)组成员概率与
1.2 研究对象、指标选取及数据来源
1.2.1 研究对象
选取中国不同省份和自治区的32个主要城市作为评估对象,包括4个直辖市(北京、上海、天津、重庆),23个省会城市(太原、呼和浩特、沈阳、长春、南京、杭州、合肥、福州、南昌、济南、郑州、武汉、长沙、广州、南宁、成都、贵阳、昆明、西安、兰州、西宁、银川、乌鲁木齐),以及5个计划单列市(大连、青岛、宁波、厦门、深圳)。选取的研究城市为中国发展水平较高的大中城市群体,且在空间分布上覆盖广泛,涵盖了中国27个省级行政区,能够暴露出更多的城市水资源短缺问题,以便为广大的中小城市群体的水安全与高质量发展提供经验和参考。
1.2.2 指标选取与数据来源
表1 城市水资源短缺程度评价指标体系
Table 1
| 目标层A | 准则层B | 指标层C | 计算公式 | 量纲 | 指标来源 |
|---|---|---|---|---|---|
| 城市水资源短缺程度评价/A | 水资源量/B1 | 降水量/C1(-) | 查阅资料 | m3/人 | [39] |
| 产水模数/C2(-) | 水资源总量/土地面积 | 万m3/km2 | [39] | ||
| 径流系数/C3(-) | 径流量/降水量 | — | [40] | ||
| 产水系数/C4(-) | 水资源总量/降水总量 | — | [40] | ||
| 社会经济状况/B2 | 人口密度/C5(+) | 总人口/土地面积 | 人/km2 | [40] | |
| GDP模数/C6(+) | GDP/土地面积 | 万元/km2 | [41] | ||
| 城镇化率/C7(+) | 城镇人口/总人口 | % | [10] | ||
| 供用水情况/B3 | 人均供水量/C8(-) | 供水总量/总人口 | m3/人 | [41] | |
| 供水模数/C9(-) | 供水总量/土地面积 | 万m3/km2 | [41] | ||
| 地下水供水比重/C10(+) | 地下水供水量/供水总量 | % | [40] | ||
| 万元GDP用水量/C11(+) | 用水总量/GDP | m3/万元 | [39] | ||
| 万元工业增加值用水量/C12(+) | 工业用水量/工业增加值 | m3/万元 | [10] | ||
| 水环境状况/B4 | 污水处理能力/C13(-) | 查阅资料 | m3/天 | [10] | |
| 人均工业废水排放量/C14(+) | 工业废水排放总量/总人口 | t/人 | [42] |
注:表中牵涉到的人口指标均为常住人口;指标层中,(+)表示正向指标,(-)表示负向指标。
各指标的基础数据来源于各省市水资源公报(2011—2020年)、统计年鉴(2012—2021年)以及中国城市建设统计年鉴(2011—2020年)。为了保证基础数据的完整性与可靠性,在梳理各城市水资源相关数据时,重点以市级单位发布的水资源公报与统计年鉴为主要数据来源,并通过省统计局发布的数据来填补部分数据缺失值,对仍有缺漏的按其前后年份的变化趋势进行插补。
2 结果分析
2.1 主要城市水资源短缺程度评价与时空分布特征
2.1.1 水资源短缺程度评价
表2 2011年主成分提取分析表
Table 2
| 成分 | 初始特征值 | 提取平方和载入 | |||||
|---|---|---|---|---|---|---|---|
| 特征值 | 贡献率/% | 累计贡献率/% | 特征值 | 贡献率/% | 累计贡献率/% | ||
| 1 | 5.649 | 40.349 | 40.349 | 5.649 | 40.349 | 40.349 | |
| 2 | 3.354 | 23.959 | 64.307 | 3.354 | 23.959 | 64.307 | |
| 3 | 1.948 | 13.917 | 78.224 | 1.948 | 13.917 | 78.224 | |
| 4 | 1.113 | 7.950 | 86.174 | 1.113 | 7.950 | 86.174 | |
| 5 | 0.538 | 3.843 | 90.017 | ||||
| 6 | 0.418 | 2.985 | 93.003 | ||||
| 7 | 0.374 | 2.672 | 95.674 | ||||
| … | … | … | … | ||||
| 12 | 0.026 | 0.186 | 99.842 | ||||
| 13 | 0.014 | 0.098 | 99.940 | ||||
| 14 | 0.008 | 0.060 | 100.000 | ||||
对32个主要城市2011—2020年的水资源短缺状况进行综合评价,计算各城市水资源短缺指数均值并进行排名(表3)。结果显示,呼和浩特市缺水最为严重,而广州市水资源状况相对最为丰裕。
表3 32个主要城市2011—2020年水资源短缺程度评分均值
Table 3
| 城市 | F | 排名 | 城市 | F | 排名 | 城市 | F | 排名 |
|---|---|---|---|---|---|---|---|---|
| 呼和浩特 | 1.79 | 1 | 长春 | 1.10 | 12 | 成都 | -1.13 | 23 |
| 太原 | 1.62 | 2 | 西安 | 0.86 | 13 | 长沙 | -1.14 | 24 |
| 银川 | 1.56 | 3 | 西宁 | 0.74 | 14 | 重庆 | -1.18 | 25 |
| 兰州 | 1.42 | 4 | 大连 | 0.63 | 15 | 宁波 | -1.25 | 26 |
| 沈阳 | 1.38 | 5 | 昆明 | 0.39 | 16 | 福州 | -1.41 | 27 |
| 青岛 | 1.33 | 6 | 合肥 | -0.15 | 17 | 杭州 | -1.48 | 28 |
| 郑州 | 1.31 | 7 | 南京 | -0.60 | 18 | 上海 | -1.54 | 29 |
| 乌鲁木齐 | 1.20 | 8 | 厦门 | -0.60 | 19 | 南昌 | -1.80 | 30 |
| 北京 | 1.17 | 9 | 贵阳 | -0.72 | 20 | 深圳 | -2.04 | 31 |
| 济南 | 1.11 | 10 | 南宁 | -0.73 | 21 | 广州 | -2.20 | 32 |
| 天津 | 1.10 | 11 | 武汉 | -0.73 | 22 |
注:F表示各市10年的评分均值,F值越大,表示城市缺水程度越高。
2.1.2 水资源短缺程度分级与时空分布特征
根据2011—2020年的评分均值,将32个城市的缺水状况划分为四个等级,即严重缺水(F>1.2)、缺水(0<F<1.2)、脆弱(-1.1<F<0)及相对富水(F<-1.1),具体划分结果及其空间分布如图1所示。
图1
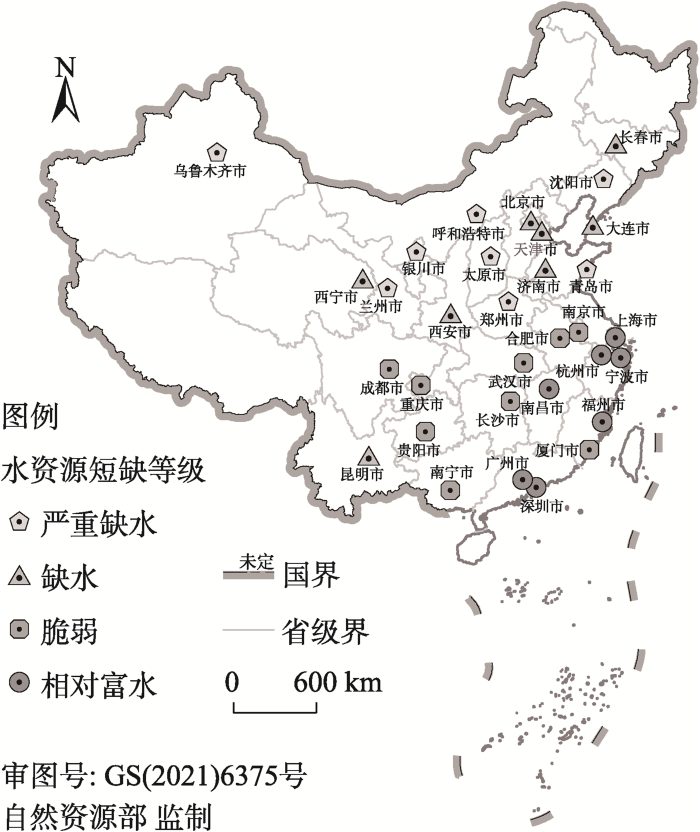
图1
32个主要城市缺水程度分级
注:本图基于自然资源部标准地图服务系统下载的标准地图制作,底图无修改,下同。
Fig. 1
Zoning of water scarcity degree in 32 major cities
从空间分布来看,缺水和富水城市的南北分布差异明显,缺水程度较低的城市均位于中国南方地区,而缺水和严重缺水城市大多位于中国北方地区。其中比较例外的是昆明市,虽然其位于中国水能资源最丰富的西南地区,但仍属于缺水城市。由此可见,天然的水资源禀赋状况对城市缺水状况具有十分重要的影响,但并不能保证水资源丰富的地区就一定不缺水,城市缺水与否还受到当地社会经济发展水平、用水效率水平以及水环境状况等多种因素的影响。
图2
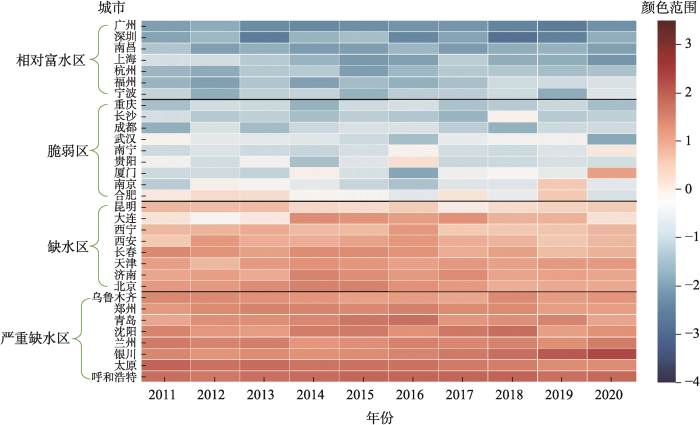
图2
32个主要城市水资源短缺程度热力图
Fig. 2
Heat map of water scarcity degree in 32 major cities
为了更直观地对比同一水资源短缺等级内各城市的水资源短缺状况及其演化趋势,绘制不同缺水等级主要城市的簇状柱形图,如图3所示。其中,子图a、b、c、d分别对应相对富水、脆弱、缺水和严重缺水四个城市水资源短缺等级。由图3a可知,7个水资源状况相对富水的城市中,杭州、福州和宁波3市的水资源短缺程度有逐年增大的趋势,水资源状况逐渐向脆弱区靠近,而成都和贵阳,水资源短缺程度评分已处于相对富水区的边缘,随时有可能跌入脆弱区。广州、深圳、南昌和上海4市的水资源短缺状况总体向好的方向发展,其中,变化最为明显的是上海市,2011年时水资源短缺程度评分已接近脆弱区,而在2020年几乎赶上了整体用水状况最优的广州市。
图3
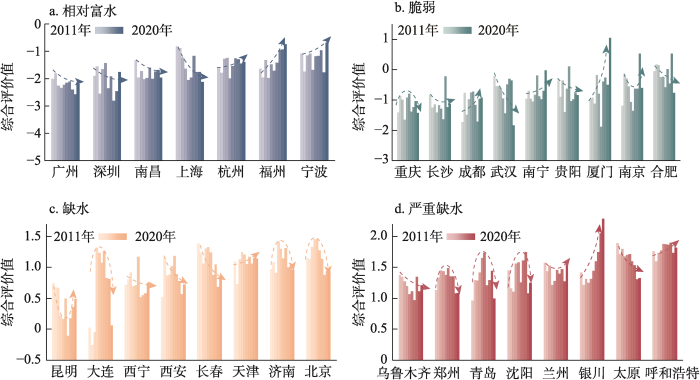
图3
32个主要城市缺水程度分组对比
Fig. 3
Comparison of water scarcity degree in 32 major cities
2.2 主要城市水资源短缺类型划分与发展轨迹
2.2.1 主成分释义
为了有效识别主要城市的水资源短缺的归因,从综合评价中所提取的主成分入手,通过解释各主成分的含义,建立城市水资源短缺状况与具体的评价指标的联系,并进一步解析不同主要城市水资源短缺的物理根源。图4为水资源短缺程度评价指标各主成分荷载分布图,由主成分中各评价指标2011—2020年荷载绝对值的均值绘制而成。
图4
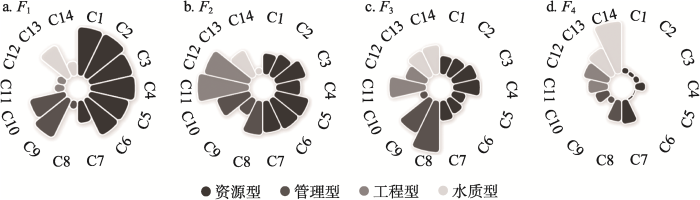
通过统计各指标对应花瓣的大小,可大致归纳出各主成分的含义:F1主要与天然水资源禀赋情况和社会经济状况有关,表现为城市水资源短缺的资源型因素;F2主要与用水效率水平有关,表现为城市水资源短缺的管理型因素;F3主要与城市供水水平有关,表现为城市水资源短缺的工程型因素;F4主要与城市水环境状况有关,表现为城市水资源短缺的水质型因素。
2.2.2 城市水资源短缺类型识别与轨迹解析
应用GBMTM法对32个主要城市进行城市水资源短缺类型的识别。以32个主要城市2011—2020年的各主成分加权得分Mi作为原始变量,借助Stata/MP 17软件与Jones等[43]开发的Traj插件进行建模。其中,Mi是按照式(7)由主成分得分Fi乘以其对应权重得到,在数值上更具有可比性。M1、M2、M3和M4分别对应资源型、管理型、工程型和水质型的城市水资源短缺。依据BIC准则(越接近0越好)对分组结果进行筛选,发现当模型分组为9时,整体表现最好,各组的主成分加权得分差异明显,不管是在数值还是整体变化趋势上都不尽相同。图5展示了32个城市的具体分组情况,其中,组8包含城市最多,占城市总数的四分之一,而组9城市最少,仅有银川一个城市。
图5
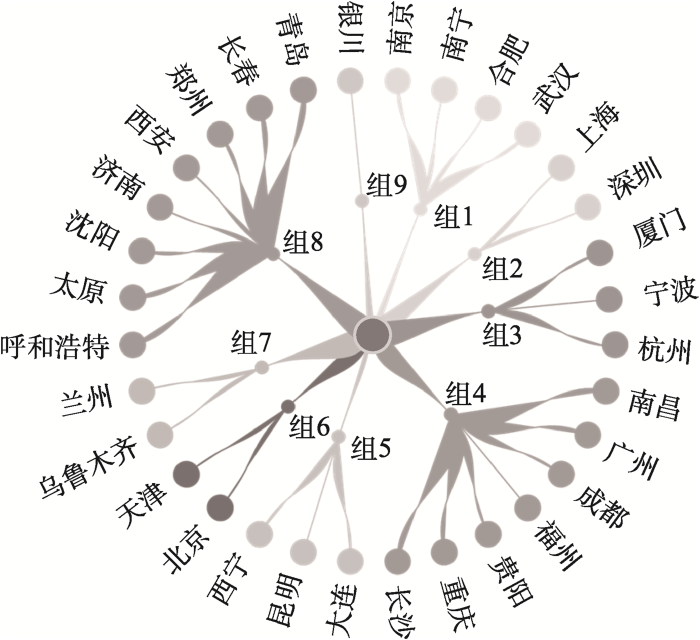
表4为模型分组结果的准确度校验结果。由表可知,每组的平均后验分配概率(AvePP)值为0.998或更大,远高于检验标准值0.7,且每组的估计概率与实际成员比例间误差微小,这表明该模型具有良好的分配准确性。由此可见,GBMTM确实对多维度纵向数据的筛选处理具有明显优势,能够区分多变量下不同发展轨迹的个体集群,且准确度较高。
表4 模型分组结果准确度检验
Table 4
| 组别 | AvePP | Pj/% | 相对误差/% | |
|---|---|---|---|---|
| 组1 | 1 | 12.500 | 12.494 | -0.048 |
| 组2 | 0.999 | 6.250 | 6.247 | -0.048 |
| 组3 | 0.999 | 9.375 | 9.375 | 0.000 |
| 组4 | 1 | 21.875 | 21.863 | -0.055 |
| 组5 | 0.999 | 9.375 | 9.379 | 0.043 |
| 组6 | 1 | 6.250 | 6.253 | 0.048 |
| 组7 | 1 | 6.250 | 6.253 | 0.048 |
| 组8 | 0.998 | 25.000 | 25.011 | 0.044 |
| 组9 | 1 | 3.125 | 3.125 | 0.000 |
图6展示了各组主成分加权得分情况,图中散点为组成员主成分加权得分均值。从图中各组的主成分加权值变化情况来看,组1城市的M3和M4得分为正,而M1和M2得分在横轴以下波动。特别是M1,年际变化比较剧烈,结合各主成分的物理释义,认为M1的变化可能与降水量的丰枯变化有关。综合划定组1应属于以工程型为主、水质型为辅的工程—水质复合型水资源短缺。对组2而言,代表资源型得分的M1远小于0,表明其天然水资源禀赋条件较好,不存在资源型缺水威胁,而M2和M3的表现则说明其会面临管理—工程复合型水资源短缺问题,但M2和M3都呈现出了减小的趋势,这表明组2城市的水资源短缺问题正在得到缓解。组3中,只有代表水质型得分的M4是大于0的,表明其只存在水质型缺水。组4是9个分组中表现最佳的,目前尚不存在水资源短缺现象,但代表其工程型和水质型得分的M3和M4与0值十分接近,说明组4有向组1发展的潜在趋势。因此,认为组4存在一定的工程—水质复合型缺水风险,应加强供水保障和水环境保护,避免工程—水质型水资源短缺风险转变为实质性的缺水问题。
图6
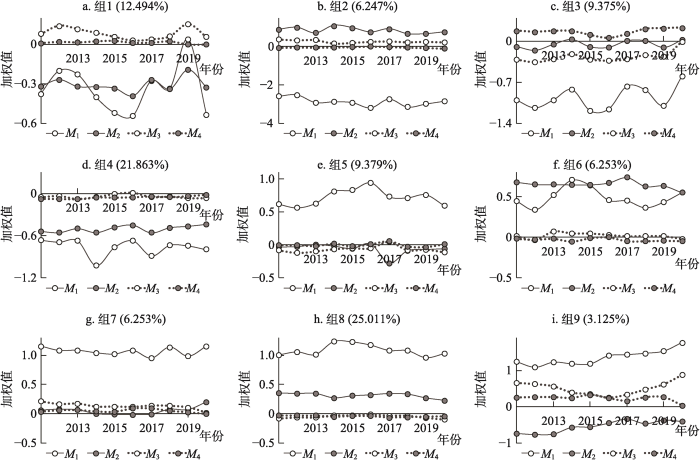
其余5组中,除组5属于单一的资源型缺水外,其余4组都属于复合型水资源短缺。其中,组6和组8兼具资源型和管理型缺水,根据得分情况,将组6划定为以管理型为主、资源型为辅的管理—资源复合型水资源短缺,而组8则划定为以资源型为主、管理型为辅的资源—管理复合型水资源短缺。组7中的城市群除资源型缺水外,主要还受到工程型缺水的影响,故将其划入资源—工程复合型水资源短缺。组9与上述组别有一定差异,同时面临有资源型、工程型和水质型三种水资源短缺,故划定为综合型水资源短缺。
2.2.3 城市水资源短缺类型空间异质性分析
图7
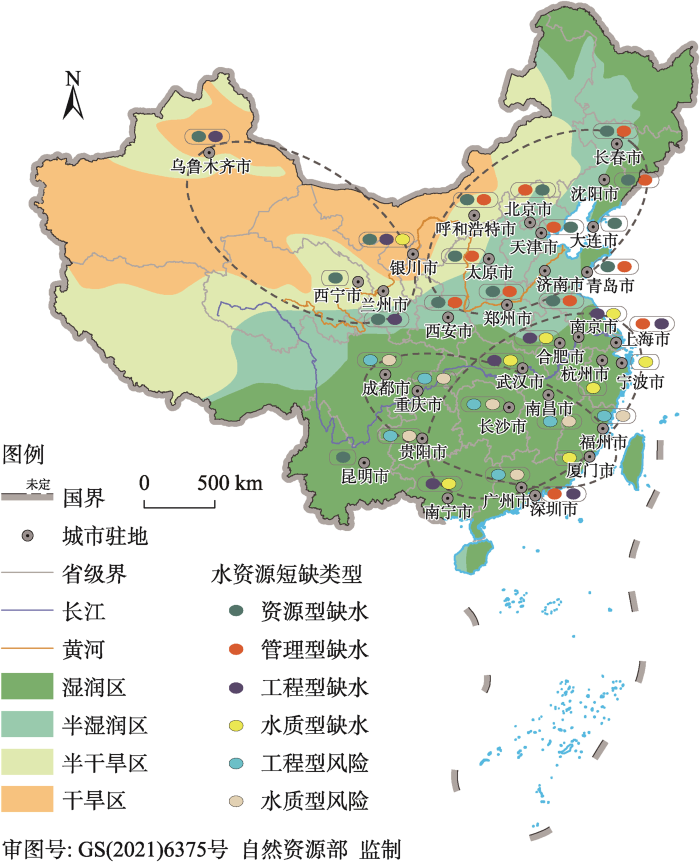
由图7可知,中国城市水资源短缺类型存在明显的空间差异性,北方城市大多存在资源型缺水,以干旱半干旱气候为主的西北地区城市主要面临资源—工程复合型缺水问题,而以半湿润与半干旱气候为主的华北与东北地区城市则以资源型和管理型缺水为主。气候湿润的南方城市中,工程型和水质型水资源短缺是威胁城市水安全的主导因素,且主要集中于中国长江中下游地区。与之相反,在靠近中国长江上游的西南地区和东南腹地城市中,这两种水资源短缺问题并不十分突出,更多地表现为工程—水质复合型风险。需要指出的是,昆明、上海和深圳三市的水资源短缺特点与上述规律并不十分相符。如昆明市位于中国水能资源最为丰富的西南地区,多年平均降水量在800 mm以上[44],但其仍存在资源型水资源短缺问题,目前该市正在通过引水工程来改变其缺水现状[45]。而位于沿海地区的上海和深圳则主要表现出了管理—工程复合型水资源短缺,这可能与两市远高于其他地区城市的发展规模和经济体量有很大关联。
2.2.4 不同缺水等级城市缺水驱动因素分析
图8展示了不同水资源短缺等级城市群所面临的差异性缺水类型分布。由图可知,相对富水区和脆弱区的主要城市主要存在工程型与水质型水资源短缺问题或风险,且相对富水区还存在用水效率低所引发的管理型水资源短缺。对缺水和严重缺水城市而言,造成它们水资源短缺的主要原因是水资源数量匮乏和用水效率低下。此外,部分工程型和水质型因素也在困扰缺水城市的发展。整体而言,缺水程度较高的城市的水资源短缺问题主要受制于天然水资源量稀少和不科学的用水方式,而降水相对丰富地区的城市用水安全更容易受到供水水平不足和水环境恶化的威胁。
图8
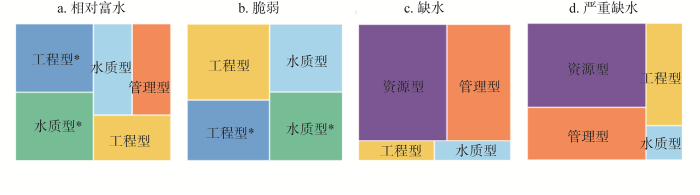
图8
不同缺水等级的城市缺水驱动因素
注:图中*表示潜在水资源短缺风险,如工程型*表示有工程型水资源短缺风险。
Fig. 8
Driving factors of urban water scarcity with different water scarcity levels
2.3 城市水资源短缺与降水量及城市发展过程的协同关系
图9
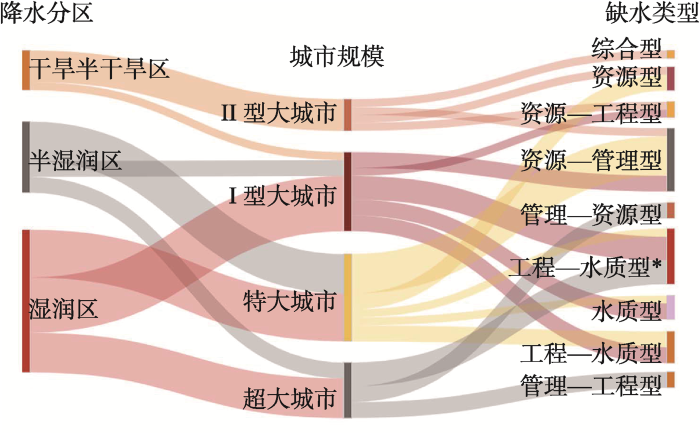
图9
降水+城市规模对城市水资源短缺类型的影响
注:图中工程—水质型*表示工程—水质复合型水资源短缺风险,下同。
Fig. 9
Impact of precipitation and city size on urban water scarcity type
图10
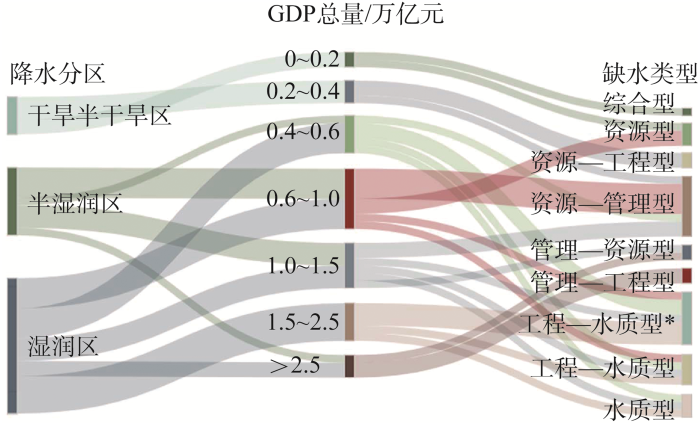
图10
降水+GDP对城市水资源短缺类型的影响
Fig. 10
Impact of precipitation and GDP on urban water scarcity type
图11
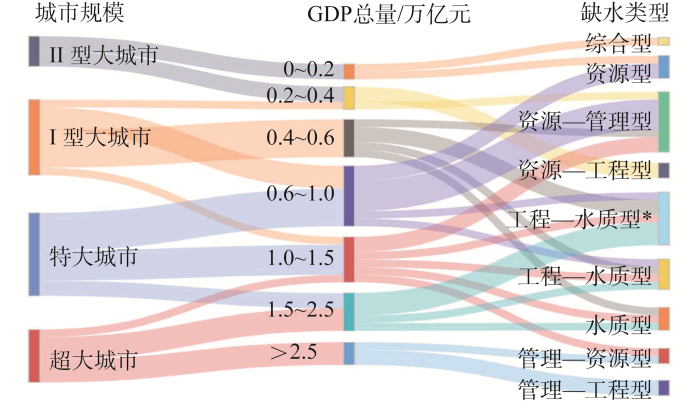
图11
城市规模+GDP对城市水资源短缺类型的影响
Fig. 11
Impact of city size and GDP on urban water scarcity type
表5 城市规模分类标准及涵盖城市
Table 5
| 城市规模 | 城区常住人口/万人 | GDP总量/万亿元 | 涵盖城市 | 计数/个 |
|---|---|---|---|---|
| Ⅱ型大城市 | 100~300 | 0~0.2 | 西宁、银川 | 2 |
| 0.2~0.4 | 兰州、呼和浩特 | 2 | ||
| Ⅰ型大城市 | 300~500 | 0.2~0.4 | 乌鲁木齐 | 1 |
| 0.4~0.6 | 贵阳、南宁、南昌、厦门、太原 | 5 | ||
| 0.6~1.0 | 长春、福州、合肥 | 3 | ||
| 1.0~1.5 | 宁波 | 1 | ||
| 特大城市 | 500~1000 | 0.6~1.0 | 西安、济南、沈阳、昆明、大连 | 5 |
| 1.0~1.5 | 郑州、青岛、南京、长沙 | 4 | ||
| 1.5~2.5 | 杭州、武汉 | 2 | ||
| 超大城市 | >1000 | 1.0~1.5 | 天津 | 1 |
| 1.5~2.5 | 广州、重庆、成都 | 3 | ||
| >2.5 | 北京、上海、深圳 | 3 |
对半湿润区城市而言,当城市规模维持在大城市和特大城市(图9)时,其主要面临资源型为主、管理型为辅的水资源短缺问题,而当城市规模发展到超大城市时,管理型因素会超越资源型因素成为困扰城市水安全和高质量发展的主要驱动源。结合GDP的影响来看,GDP总量在1.5万亿元以下的半湿润区城市主要会面临资源型为主、管理型为辅的水资源短缺问题,而当GDP总量达到2.5万亿元以上时,管理型因素会超越资源型因素成为主要驱动源(图10)。而从图11可以看到,随着城市规模等级的提升,其相应的GDP总量水平也会升高,二者存在紧密的秩序对应关系。因此,对于半湿润区城市而言,其主导水资源短缺类型的转变不是由城市规模或GDP总量单独控制的,而是二者交织影响的结果。
综上所述,可发现以下规律:
(1)城市水资源短缺与其所处的降水分区息息相关。湿润区(降水量800 mm以上)城市主要面临工程型和水质型缺水或风险,而半湿润区、干旱区半干旱区城市(降水量 800 mm以下),则大多存在资源型缺水问题。
(2)城市水资源短缺类型迁移转化特征与其发展过程联系紧密。同一降水分区内,城市扩张和GDP增长的交织影响会诱发城市水资源短缺主导类型的转换,亦可能会引发潜在水资源短缺风险向实质缺水问题的转变。
(3)随着城市的扩张与发展,管理型水资源短缺问题极易出现,尤其当城市规模发展到超大城市级别且GDP总量达到2.5万亿元以上时,管理型水资源短缺还会成为主导驱动。
3 结论与讨论
3.1 结论
本文透过主成分分析法评价了32个主要城市的水资源短缺程度,应用组基多轨迹建模识别了不同城市群组的水资源短缺类型,并进一步剖析了降水量、城市规模和GDP与城市水资源短缺类型及发展轨迹的协同关系,所得结论主要如下:
(1)水资源短缺具有显著空间异质性。受水资源禀赋影响,中国缺水和富水城市的南北分布差异明显,水资源短缺程度呈现由东南向西北逐渐加深之趋势。
(2)水资源短缺类型具有多元性。西北地区城市主要面临资源—工程复合型水资源短缺问题,而华北与东北地区城市的水资源短缺问题则以资源型和管理型为主,南方地区城市主要受工程型和水质型水资源短缺的危害。
(3)水资源短缺诱因具有复杂性和时变性。天然水资源量的匮乏以及一系列人为性驱动因素使干旱半干旱地区城市面临更加恶劣且复杂的水资源短缺问题。且城市扩张和GDP增长的交织影响会持续诱发城市水资源短缺主导类型的转换,也会引起潜在的工程型和水质型水资源短缺风险实质化。
(4)水资源短缺发展具有一定的同向性。不同地区、不同类型的城市,当其规模与GDP增长到一定水平时,极易出现管理型水资源短缺问题,不科学或不合理的取用水行为及管理措施极易危害大型和超大型城市的水安全与高质量发展。
(5)研究表明,组基多轨迹模型能够从数理统计角度准确识别多变量下不同发展轨迹的个体集群,形成具有相似水资源短缺类型的城市群组,可作为水文水资源领域动态数据发展轨迹研究的重要工具。
3.2 讨论
本文提出通过主成分分析法与组基多轨迹模型相结合的手段来识别区域水资源短缺类型及其发展轨迹,并以中国32个主要城市为例展开研究。所得到的水资源短缺程度评价结果与童绍玉等[14]得到的结果基本一致,但由于上述研究并未考虑水质型缺水问题,因此在缺水类型的识别结果上与本文存在差异。此外,从水资源短缺程度的空间分布来看,北方地区的缺水问题比南方地区更加恶劣与复杂,这在范琳琳等[24]和丁竹英等[41]的研究中也有所体现。但与本文不同的是,丁竹英等[41]的研究是在省域尺度上开展的,并通过人均水资源量与全国均值的对比划定了过载型缺水,而本文还关注了管理型和水质型缺水。西南地区的昆明市存在资源型水资源短缺问题,这与梁媛等[9]的评价结果是吻合的,但梁媛等[9]还发现昆明市存在较为严重的水环境问题,这可能与本文研究时段和评价指标的差异有关。进一步地,本文还探讨了降水分区、城市发展程度与水资源短缺类型及发展轨迹的协同关系,发现水资源短缺类型会随着城市发展阶段的改变而变化,城市应对水资源短缺问题的对策也应根据其具体情况进行调整[46]。研究结果显示,组基多轨迹模型在与主成分分析结合的城市水资源短缺类型识别中效果良好,但仍有一些问题需进一步探讨:
(1)本文所选取的32个城市多为中国省会、直辖市或自治区首府城市,城市规模与发展水平都较高,研究结果具有一定的典型性。但正因为此,研究的范畴相对局限,在后续研究中,可将更为广泛的中小型城市纳入研究对象,或是选取某一地区、类型及规模等级的城市进行研究,以提高针对性和可参考性。同时,亦可聚焦更大尺度范围,开展省份及流域面域的研究,以进一步验证该方法在不同层面的适用性与可靠性。
(2)水资源短缺评价体系的构建是本文研究的关键,对研究结果和发展规律的识别至关重要。因此,在参考本文所提出的方法开展更大或更小尺度的水资源短缺评价与发展轨迹识别研究时,务必结合所研究对象或研究群体的具体情况,合理选取评价指标体系,以确保所得结果的有效性。
(3)组基多轨迹模型(GBMTM)凭借其在数理统计方面的独特优势,在水资源短缺类型及发展轨迹识别研究中发挥了重要作用,并取得了较好的效果。然而,GBMTM在水文水资源领域的应用不局限于此,更广泛和更丰富的应用仍有待进一步探索。
参考文献
干旱区水—能源—粮食纽带系统协同演化: 以中国西北地区为例
DOI:10.31497/zrzyxb.20220204
[本文引用: 1]

水、能源、粮食是人类社会发展的基本保障,三者之间的紧密联系成为近年来国内外学者关注的重点。通过对水—能源—粮食纽带系统协同演化机制的探究,能更好地厘清三者之间的相互关系,对实现社会高质量发展具有重要意义。基于自组织理论,从水、能源、粮食三个角度构建理论模型,运用哈肯模型分阶段地对中国西北地区水—能源—粮食纽带系统协同发展的演化机制进行探究,并在此基础上分析水—能源—粮食纽带系统协同得分的时空分异规律。结果表明:(1)2000—2010年间,中国西北地区水—能源—粮食纽带系统协同演化的序参量是水资源子系统,其主导着整个系统的演化方向,而能源子系统、粮食子系统处于从属地位。在协同得分的时空变化规律上,西北五省区协同得分整体呈上升趋势,但各地区得分差距较大。(2)2011—2018年间,中国西北地区水—能源—粮食纽带系统协同演化的序参量是水资源子系统和能源子系统,两者共同主导着水—能源—粮食纽带系统的协同演化,粮食子系统则处于从属地位。在协同得分的时空变化规律上,西北五省区协同得分仍保持平稳上升趋势,省际间得分差距明显缩小。
Co-evolution of water-energy-food nexus in arid areas: Take Northwest China as an example
DOI:10.31497/zrzyxb.20220204 URL [本文引用: 1]
水资源与社会经济发展要素时空匹配特征: 以张家口为例
DOI:10.31497/zrzyxb.20200612
[本文引用: 1]
水资源短缺已成为制约区域经济社会发展的重要因素,协调水资源与社会经济关系是水资源可持续利用的关键。以张家口为例,采用洛伦兹基尼系数和不均衡指数模型对水资源与社会经济发展要素的时空匹配特征进行研究,结果表明:2004—2015年张家口水资源与人口、耕地面积分布处于“匹配比较合理”和“相对匹配”状态,水资源与经济布局匹配呈现出由“完全不匹配”状态逐渐转变为“相对不匹配”状态。在空间匹配演化方面,水资源与人口、耕地面积的匹配度变化不大。水资源与经济匹配结果表明在水资源禀赋越差的地区,经济增速越快,水资源与经济的空间匹配状况越差。张家口水资源与社会经济发展要素时空匹配特征研究,对于指导区域水资源合理开发利用具有重要的现实意义。
Spatiotemporal matching between water resources and social economy: A case study in Zhangjiakou
DOI:10.31497/zrzyxb.20200612
[本文引用: 1]
Water shortage has been become a vital restricted factor for developing of regional socio-economy. It is critical to harmonize the relationship between water exploitation and socio-economic development so as to achieve sustainable utilization of water resources. In this paper, we take Zhangjiakou as a case study, and adopt the Lorenz Gini coefficient method and imbalance index model to examine the spatiotemporal matching between water resources and socio-economy. The results indicate that the match status between water resources and population, and between water resources and farmland, were reasonable and relatively reasonable respectively from 2004 to 2015. The match status between water resources and economy was changing from complete to relative mismatch. In terms of spatial matching, there was little change of matching between water and population, and between water and farmland. The less water resources there are in a region, the faster economic development is, and the worse the matching between water and economy. This study is important for the development and utilization of water resources in the study area.
虚拟水社会循环视域下的水资源承载力评价
Assessment of water resources carrying capacity from the perspective of virtual water social cycle
DOI:10.31497/zrzyxb.20210207
[本文引用: 1]
The shortage and uneven distribution of water resources in China are very serious. The contradiction of water utilization has changed from insufficient supply to overload of Water Resources Carrying Capacity (WRCC). Based on the concept of sustainability, this study, combined with the society cycle process of virtual water, improves the evaluation method of WRCC and analyzes the WRCC of Northwest China. The method can be helpful to maintain the integrity of water ecology and the stability of water supply. The results show that: (1) The WRCC of Shaanxi is generally good. However, it has a downward trend in the past ten years, in which the environmental pressure is the largest. The WRCC of Gansu shows a downward trend on the whole, especially in terms of environmental and social pressure. The WRCC of Ningxia has been on the verge of overloading or slight overloading, and alleviated by virtual water trade. The WRCC of Xinjiang is greatly affected by virtual water outflow and has been on the verge of overloading or slight overloading. The WRCC of Qinghai is basically in a surplus state of carrying capacity. (2) Virtual water trade has a significant influence on the comprehensive pressure index of WRCC. The evaluation method of WRCC, combined with the society cycle process of virtual water, has a practical significance. (3) The regions of different endowments of water resources and the efficiency of using water can be appropriately different in development modes. We suggest that the regions with high and low use efficiency of water take the "radical development mode" and the "radical environmental protection mode", respectively.
21世纪中国的城市化特点及其生态环境挑战
DOI:10.11867/j.issn.1001-8166.2019.06.0640
[本文引用: 1]
城市化是世界范围的历史进程。中国的城市化虽然起步较晚,但是由于速度快、规模大、资源能源消耗高,从而带来一系列水环境和热环境问题。系统梳理了在全球气候变化和城市化的双重压力下,中国城市面临的水资源短缺与水污染、日益严重的城市热岛和生态水文灾害等生态环境挑战,提出要以城市生态水文学的理论和手段,解决城市生态环境问题,提升中国的城市化质量,实现宜居城市。
China's urbanization and its ecological environment challenges in the 21st century
区域水资源压力分析评价方法综述
DOI:10.11849/zrzyxb.20151240
[本文引用: 1]
区域水资源压力分析是区域水资源评价的重要环节和内容。明确水资源压力的概念、梳理水资源压力评价方法,是水资源压力研究及可持续水资源管理的重要前提。论文基于国内外水资源压力理论研究与实践进展,分析了水资源压力的内涵,介绍了水资源压力评价的常用方法,从计算原理、过程以及应用等方面对水资源压力评价方法进行了概述和对比分析。同时,基于国内外相关研究和应用需求,展望了未来水资源压力研究的方向和重点问题,提出应当增加对地表水与地下水耦合、水质与水量耦合以及季节性因素的衡量等。
Approaches for regional water resources stress assessment: A review
Water conflicts and social resource scarcity. Physics and Chemistry of the Earth, Part B: Hydrology
我国城市缺水研究
Study on city water shortage of China
基于循环修正模式的云南省水资源短缺程度分析
DOI:10.11849/zrzyxb.2013.07.007
[本文引用: 3]
区域水资源短缺评价是水资源风险研究的基础。前期的研究多采用单一评价方法进行,致使评价结果存在差异。论文提出采用循环修正模式对单一评价方法得出的不同评价结果进行组合修正。通过构建云南省水资源短缺综合评价指标体系,利用模糊物元、模糊识别等多种单一评价方法进行评价,最后运用平均值法、Boarda法和Compeland法三种组合评价方法对单一评价方法得到的不同结果进行组合评价,建立了基于循环修正模式的水资源短缺程度评价模型并加以应用,给出了云南省16个地、市、州的水资源短缺程度的排序及其缺水类型的划分。
Research on the degree of water shortage in Yunnan province based on circulating correction mode
DOI:10.11849/zrzyxb.2013.07.007
[本文引用: 3]
With continuing population growth and rapid economic development,coupled with increasingly serious water pollution,growing shortage of available water resources,water crisis shows up in many regions.Evaluation of the regional water shortage is the basis for the study of water resources risk. Previous studies, with the use of a single evaluation method, resulting in differences in evaluation results. In this paper, the circulating correction model derived from a single evaluation method generated a combination correction of the evaluation results. Comprehensive evaluation index system constructed indicates water shortage in Yunnan Province as well as aspects of water economics,construction control,water supply,water usage and water environment. The use of fuzzy matter-element, fuzzy pattern recognition, and other single evaluation method, finally, gains a combination of three evaluation methods, namely, average method, Boarda method and Compeland method for the different evaluation results.The Kendall test and Spearman test methods were carried out for pre-and post-conformance tests to ensure reliability of the model cycle correction in this paper. The establishment of the degree of shortage of water resources evaluation model based on the circulating correction mode and application, gives the present status of Yunnan Province including 16 cities in terms of degree of water shortage as well as the lack of water type in 2010, and corresponding countermeasures are put forward.
基于PSR与DCE综合模型的水资源短缺程度及变化趋势分析: 以北京市为例
Water shortage and its trend analysis in Beijing based on PSR and DCE model
DOI:10.11849/zrzyxb.2015.10.011
[本文引用: 5]
The water resources in China are limited in terms of capacity, supply and demand. How to address the problem of development, utilization, protection and management of water resources has become an important research area. To ensure the rigorous management of water resources and facilitate the pressure of water resources utilization, it is necessary to investigate the status of water resources shortage. However, there is a lack of study on the trend and changing speed of water resources shortage during the dynamic evaluation. To address this knowledge gap, this paper proposes a model of dynamic evaluation of water resources shortage based on the theory of acceleration for analyzing the trend and changing speed of water resources shortage. This paper concerns the issue of water shortage in Beijing from 2003 to 2010 based on PSR and DCE model. The results show a fluctuant change of water shortage degree in Beijing. The water shortage degree in Beijing firstly increased then after a decline it increased again. This change is not severe in most administrative districts except four districts (the district under city administration, Changping District, Miyun County and Yanqing County). The water shortage shows aggravating tendency in six administrative districts including Fangshan District, Shunyi District, Changping District, Huairou Pinggu District and Yanqing County, while shows alleviated tendency in four districts including the district under city administration, Tongzhou District, Daxing District and Miyun County.
“量—质—生” 三维水资源短缺评价: 评述及展望
Three-dimensional water scarcity assessment by considering water quantity, water quality, and environmental flow requirements: Review and prospect
水资源紧缺类型及其对策分析研究
Classification and counter measure research on water scarcity in China
中国水资源短缺地域差异研究
A study on regional difference of fresh water resources shortage in China
DOI:10.11849/zrzyxb.2001.06.005
[本文引用: 1]
The classification of water shortage degree and shortage types of various provinces,re-gions and municipalities(excluding Taiwan)throughout China was carried out in the study by using comprehensive evaluation method and taking per capita available amount of water re-sources,per unit area available amount of water resources,per capita amount of water supplied and per unit GDP available water resources as indicators.According to the water shortage com-posite index number,water sufficient district,fragile district,water deficit district and serious deficit district are identified.In light with differential value of per capita available amount of wa-ter resources,per unit area available amount of water resources,per capita amount of water sup-plied with national mean value,resources type,engineering type and overloading type are catego-rized.
中国水资源短缺的空间格局及缺水类型
Spatial pattern of scarcity of water and it's shortage types in China
京津冀协同发展背景下的县域水资源安全诊断
Assessing water resource security in the Beijing-Tianjin-Hebei region at county level in the context of regional synergistic development
Some characteristics and impacts of the drought and water crisis in Southeastern Brazil during 2014 and 2015
DOI:10.4236/jwarp.2016.82022 URL [本文引用: 1]
Water scarcity-challenging the future
Environmental sustainability of water footprint in mainland China
DOI:10.1016/j.geosus.2020.02.002 URL [本文引用: 1]
Widespread shift from ecosystem energy to water limitation with climate change
DOI:10.1038/s41558-022-01403-8
[本文引用: 1]
Terrestrial ecosystems are essential for food and water security and CO2 uptake. Ecosystem function is dependent on the availability of soil moisture, yet it is unclear how climate change will alter soil moisture limitation on vegetation. Here we use an ecosystem index that distinguishes energy and water limitations in Earth system model simulations to show a widespread regime shift from energy to water limitation between 1980 and 2100. This shift is found in both space and time. While this is mainly related to a reduction in energy-limited regions associated with increasing incoming shortwave radiation, the largest shift towards water limitation is found in regions where incoming shortwave radiation increases are accompanied by soil moisture decreases. We therefore demonstrate a widespread regime shift in ecosystem function that is stronger than implied by individual trends in incoming shortwave radiation, soil moisture and terrestrial evaporation, with important implications for future ecosystem services.
Implementing sustainable irrigation in water-scarce regions under the impact of climate change
DOI:10.3390/agronomy10081120
URL
[本文引用: 1]
The sustainability of irrigated agriculture is threatening due to adverse climate change, given future projections that every one in four people on Earth might be suffering from extreme water scarcity by the year 2025. Pressurized irrigation systems and appropriate irrigation schedules can increase water productivity (i.e., product yield per unit volume of water consumed by the crop) and reduce the evaporative or system loss of water as opposed to traditional surface irrigation methods. However, in water-scarce countries, irrigation management frequently becomes a complex task. Deficit irrigation and the use of non-conventional water resources (e.g., wastewater, brackish groundwater) has been adopted in many cases as part of a climate change mitigation measures to tackle the water poverty issue. Protected cultivation systems such as greenhouses or screenhouses equipped with artificial intelligence systems present another sustainable option for improving water productivity and may help to alleviate water scarcity in these countries. This article presents a comprehensive review of the literature, which deals with sustainable irrigation for open-field and protected cultivation systems under the impact of climatic change in vulnerable areas, including the Mediterranean region.
Is there a relationship between water scarcity and water use efficiency in China? A national decadal assessment across spatial scales
DOI:10.1016/j.landusepol.2017.09.055 URL [本文引用: 1]
中国用水结构优化研究
The research on the optimization of water usage structure of China
Salinity impacts on irrigation water-scarcity in food bowl regions of the US and Australia
基于WEI+的流域水资源短缺分析
DOI:10.11988/ckyyb.20160023
[本文引用: 2]
为了分析我国各流域的水资源短缺现状,引入欧盟开发改进的水资源开发利用系数(Water Exploitation Index Plus,简称WEI+),以全国10个水资源一级区作为研究对象,计算2003—2012年各水资源一级区的水资源短缺情况。结果表明①WEI+指数最小的是西南诸河区,其均值为1.9%;WEI+指数最大的是海河区,其均值为130%;且南方4区的WEI+指数均小于北方6区,说明我国北方比南方面临更为严重的水资源短缺问题。②南方4区的WEI+指数在2003—2012年间波动不大,而北方6区的WEI+指数波动剧烈;大部分地区的WEI+指数均呈现出下降趋势,这说明区域的水资源短缺情况有所缓解。③WEI+指数与流域水利水电开发利用程度在空间上的分布规律基本类似,这说明WEI+指数能够有效反映区域的水资源短缺情况。
Water scarcity analysis of river basins in China based on water exploitation index plus
多尺度视角下的青藏高原水资源短缺估算及空间格局
DOI:10.12082/dqxxkx.2019.180510
[本文引用: 1]
青藏高原水资源总量丰富,但由于水资源量与用水量在空间上分布不均衡,部分人口、城镇密集地区水资源短缺严重。本研究在多源数据的基础上,通过空间分析、降尺度处理等,建立了青藏高原省区、市域、县域空间尺度的水资源与用水量数据集。通过比较5、10、20、30年重现期多空间尺度的水资源短缺程度,分析水资源短缺在青藏高原的尺度效应,揭示青藏高原水资源短缺格局与特征,识别面临水资源短缺的人口与面积。结果表明,青藏高原在省区尺度无水资源短缺;在15个市域单元中,有3个市域出现水资源短缺;在115个县域单元中,有29个县域呈现出不同程度的水资源短缺,水资源短缺县域主要集中在青海省的河湟谷地、柴达木盆地与西藏自治区的一江两河流域等人口、城镇密集区域。总体而言,由于较大空间尺度地理单元内部各县域用水强度差异,在县域尺度面临水资源短缺的人口与面积大于市域与省区尺度面临水资源短缺的人口与面积。以县域为基本单元,发现青海省与西藏自治区30年重现期面临水资源短缺的人口占总人口的56.4%,出现水资源短缺的面积占总面积的10.4%。县域之间水资源短缺指数秩相关系数计算结果显示,省区内部各县域同时出现水资源短缺的可能性较大,而省区之间各县域同时出现水资源短缺的可能性相对随机。研究结果为制定青藏高原水资源短缺管理对策、促进区域城镇化与资源环境协调发展提供科学依据。
A multi-scale perspective on water scarcity assessment in the Tibetan Plateau
昆明市水资源短缺空间格局综合分析
DOI:10.11988/ckyyb.20160518
[本文引用: 1]
水资源短缺是影响昆明市区域经济高速、稳定发展的核心问题之一。依据2001—2012年《昆明市水资源公报》数据,采用基尼系数、人均水资源量、水资源开发利用率、水资源负载指数等方法分别对昆明市的水资源变化趋势、时空分布特征、匹配性、短缺格局进行分析。研究结果表明:昆明市人均水资源量不及云南省及全国平均水平,且内部差异明显,多年平均人均水资源量极值比高达10.78,最少的地区为主城四区(299 m<sup>3</sup>/人);水资源量与GDP、人口匹配性较差,与耕地匹配性相对较好;昆明市水资源主要呈现出“南缺北丰”格局,且缺水地区数量不断增多,多数地区缺水等级逐渐加重。雨洪利用、多方面节水、跨区域调水、产业结构调整等是缓解昆明市水资源短缺的有效措施。
Comprehensive analysis on spatial pattern of water resources shortage in Kunming city
水足迹分析中国耕地水资源短缺时空格局及驱动机制
Temporal-spatial distribution and driving mechanism of arable land water scarcity index in China from water footprint perspective
基于地理探测器的内蒙古耕地水资源短缺时空变化特征及驱动力分析
Spatio-temporal change characteristics and driving factors of cultivated land water shortage in inner Mongolia based on the geographic detector model
Age, criminal careers, and population heterogeneity: Specification and estimation of a nonparametric, mixed poisson model
DOI:10.1111/crim.1993.31.issue-3 URL [本文引用: 1]
Longitudinal patterns and predictors of healthcare utilization among cancer patients on home-based palliative care in Singapore: A group-based multi-trajectory analysis
DOI:10.1186/s12916-021-02182-3
[本文引用: 1]
Previous studies have shown an association between experience of intimate partner violence and abuse (IPVA) and depression. Whether this is a causal relationship or explained by prior vulnerability that influences the risk of both IPVA and depression is not known.
Trajectories of health-related quality of life by change pattern of objective and subjective social status
基于组轨迹模型及其研究进展
Group-based trajectory model and its research progress
线性无量纲化方法对比及反向指标正向化方法
DOI:10.12005/orms.2021.0319
[本文引用: 1]
线性无量纲化方法的对比及反向指标的正向化方法都是综合评价的重要研究内容。从指标差异信息的角度,以TOPSIS、基于街区距离的TOPSIS和线性加权综合法为例,基于理论推导和实证分析对比了常用的线性无量纲化方法,并提出了两种反向指标正向化方法。研究发现,对于线性加权综合法和TOPSIS,不同线性无量纲化方法下同一指标归一化极差的不同是导致排序结果存在差异的关键因素;本文提出的反向指标正向化方法,不仅可以保证正向化前后TOPSIS、基于街区距离的TOPSIS的评价值不变,也可以实现反向指标正向化后线性加权综合法与基于街区距离的TOPSIS在排序目的上的等效性。最后,本文提出了线性无量纲化方法和反向指标正向化方法的应用建议。
Comparison of linear normalization methods and the conversion method of reverse indicators
Group-based trajectory modeling:An overview
Group-based multi-trajectory modeling
DOI:10.1177/0962280216673085
PMID:29846144
[本文引用: 2]
Identifying and monitoring multiple disease biomarkers and other clinically important factors affecting the course of a disease, behavior or health status is of great clinical relevance. Yet conventional statistical practice generally falls far short of taking full advantage of the information available in multivariate longitudinal data for tracking the course of the outcome of interest. We demonstrate a method called multi-trajectory modeling that is designed to overcome this limitation. The method is a generalization of group-based trajectory modeling. Group-based trajectory modeling is designed to identify clusters of individuals who are following similar trajectories of a single indicator of interest such as post-operative fever or body mass index. Multi-trajectory modeling identifies latent clusters of individuals following similar trajectories across multiple indicators of an outcome of interest (e.g., the health status of chronic kidney disease patients as measured by their eGFR, hemoglobin, blood CO levels). Multi-trajectory modeling is an application of finite mixture modeling. We lay out the underlying likelihood function of the multi-trajectory model and demonstrate its use with two examples.
综合评价指标体系的设计原则与构建流程
Designing principles and constructing progress of the comprehensive evaluation indicator system
基于“三生”功能的西藏自治区水资源承载力系统耦合关系
DOI:10.31497/zrzyxb.20230615
[本文引用: 4]
基于PSR模型,从“三生”功能出发,实证评价西藏自治区水资源承载力,并采用耦合协调模型进一步探析水资源承载力“三生”子系统间的耦合协调关系。结果表明:(1)研究期内,西藏的水资源承载力偏低,总体呈现出波动上升的演化态势,但存在显著的空间异质性。(2)水资源“三生”子系统承载力差异显著,生产、生活和生态子系统的承载力均呈现提升态势;生产和生态子系统的承载力在空间上表现出“东高西低”的分布特征,生活子系统承载力则呈现“中部强于四周”的交替式分布规律。(3)西藏水资源承载力子系统处于较高水平耦合状态,水资源承载力子系统耦合协调度呈现出“藏东南高于藏西北,林芝市显著优于其他地市”的空间分布特征。
Coupling relationship of water resources carrying capacity system in Tibet Autonomous Region based on "production-living-ecological" function
DOI:10.31497/zrzyxb.20230615 URL [本文引用: 4]
山东省三大流域水资源紧缺程度研究
Study on water resources shortage degree of three river basins in Shandong province
中国水资源短缺程度及缺水类型研究
Water shortage and water shortage types in China
基于DPSIR模型的芜湖市水生态承载力研究与建议
Study and suggestions on water ecological carrying capacity of Wuhu city based on DPSIR model
A note on a stata plugin for estimating group-based Trajectory Models
昆明市近50 a降水变化特征分析
Analysis of precipitation change characteristics of Kunming in recent 50 years
滇中引水工程将改写昆明缺水史
Central Yunnan Water Diversion Project will rewrite the history of water shortage in Kunming
Future global urban water scarcity and potential solutions
DOI:10.1038/s41467-021-25026-3
URL
PMID:34344898
[本文引用: 1]
Urbanization and climate change are together exacerbating water scarcity-where water demand exceeds availability-for the world's cities. We quantify global urban water scarcity in 2016 and 2050 under four socioeconomic and climate change scenarios, and explored potential solutions. Here we show the global urban population facing water scarcity is projected to increase from 933 million (one third of global urban population) in 2016 to 1.693-2.373 billion people (one third to nearly half of global urban population) in 2050, with India projected to be most severely affected in terms of growth in water-scarce urban population (increase of 153-422 million people). The number of large cities exposed to water scarcity is projected to increase from 193 to 193-284, including 10-20 megacities. More than two thirds of water-scarce cities can relieve water scarcity by infrastructure investment, but the potentially significant environmental trade-offs associated with large-scale water scarcity solutions must be guarded against.© 2021. The Author(s).
