

旱区是指多年平均降水量与多年平均潜在蒸散量之比小于0.65的地区[1]。全球有38%的人口生活在旱区,该地区具有生态环境脆弱、城市化迅速以及对气候变化敏感等特点,是全球可持续发展的关键区域之一[1]。城市扩展过程是指城市化进程中城市土地的增长过程[2],它在提升人类福祉的同时,也为区域环境带来严重的影响[3,4,5]。交通、地形和位置等区位因素能够通过影响城市扩展的空间格局,进而改变城市扩展对区域环境的影响[6,7,8]。近年来,伴随着快速的社会经济发展,旱区经历了快速的城市扩展过程[9,10],这一过程对区域的自然生境[11]、生物多样性[12]以及环境可持续性[3]等产生了严重影响。因此,充分认识城市扩展过程的区位因素特征,对于缓解旱区的环境压力以及实现区域城市的可持续发展具有重要意义。
目前,已有研究通过定性或定量方法来揭示旱区城市扩展过程的区位因素特征。定性分析方面,潮洛濛等[13]分析了区位因素对呼和浩特市1987—2006年城市扩展过程的影响。李骞国等[14]分析了影响张掖市1977—2010年城市扩展过程的区位因素。定量分析方面,黄庆旭等[15]利用Logistic回归方法分析了坡度、高程和交通等区位因素对北京市1991—2004年城市扩展的影响。Shafizadeh-Moghadam等[16]使用地理加权Logistic回归方法分析了印度孟买1973—2010年城市扩展的区位因素。Wu等[17]通过Logistic回归方法探索区位因素对京津冀城市群1980—2010年城市扩展的影响。可以看出,现有研究主要通过Logistic回归方法定量分析旱区城市扩展过程的区位因素特征。然而由于Logistic回归方法不能很好拟合非线性问题并且结果会受到多元共线性的影响,从而导致对旱区城市扩展过程区位因素特征的认识不够准确。
鉴于此,本文的目的是利用随机森林方法分析旱区城市扩展过程的区位因素特征。首先,以中国呼包鄂榆城市群为例,量化区域1980—2017年城市扩展过程的时空格局。然后,利用随机森林方法分析影响区域城市扩展过程的区位因素。最后,根据区位因素的特征,为区域未来城市扩展提出相应的政策建议,以期为区域可持续发展提供帮助。
1 研究方法与数据来源
1.1 研究区概况
图1
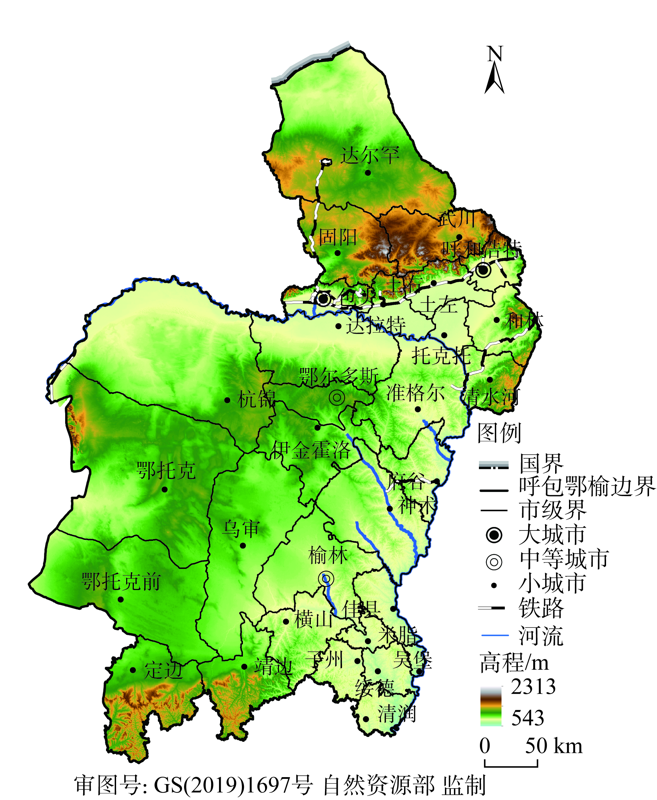
图1
研究区概况
注:本图基于自然资源部标准地图服务系统下载的标准地图制作,底图无修改,下同。
Fig. 1
The study area (Huhhot-Baotou-Ordos-Yulin, HBOY for short)
20世纪80年代以来,呼包鄂榆城市群经历了快速的城市扩展过程。区域生产总值从1980年的25.32亿元增长到2017年的13722.25亿元,年均增长370.19亿元,年均增长率为14.62%。其中,第二产业和第三产业分别由12.62亿元和6.07亿元增长到6635.86亿元和6600.76亿元,年均增长率分别为14.18%和29.36%[23,24,25]。该地区非农人口从1990年的239.87万人增加到2010年的462.13万人,增长了92.66%[26]。城市土地面积从1990年的151.29 km²增加到了2017年的1230.86 km²,增长了8.14倍[27]。途经研究区的高速公路主要有北京—拉萨高速公路、荣成—乌海高速公路和包头—茂名高速公路,国道主要包括109和110国道,铁路主要有包头—兰州、包头—西安和北京—包头等铁路线,还包括呼和浩特—包头高铁和呼和浩特—鄂尔多斯动车等。未来,区域将建设呼和浩特—准格尔—鄂尔多斯、准格尔—朔州、蒙西—华中和神木—瓦塘等铁路,建设保德—榆林、呼和浩特—朔州、赛罕塔拉—二连浩特等高速公路[23]。
1.2 数据来源
本文使用的数据主要包括Landsat遥感影像、数字高程模型(Digital Elevation Model,DEM)、气象数据和地理信息辅助数据。Landsat遥感影像来源于美国地质调查局(
1.3 研究方法
1.3.1 提取区域1980—2017年城市土地信息
基于Google Earth Engine平台在线获取Landsat MSS/TM/OLI 影像,并通过目视解译提取呼包鄂榆城市群1980—2017年城市土地信息(图2)。主要包括以下三个步骤:首先,提取潜在的城市土地信息。参考Liu等[28]的研究,基于预处理后的Landsat影像分别计算归一化植被指数(Normalized Difference Vegetation Index,NDVI)、归一化建筑指数(Normalized Difference Built-up Index,NDBI)和归一化水体指数(Normalized Difference Water Index,NDWI)指数,然后采用阈值法提取该区域潜在的城市土地信息。具体公式如下:
图2
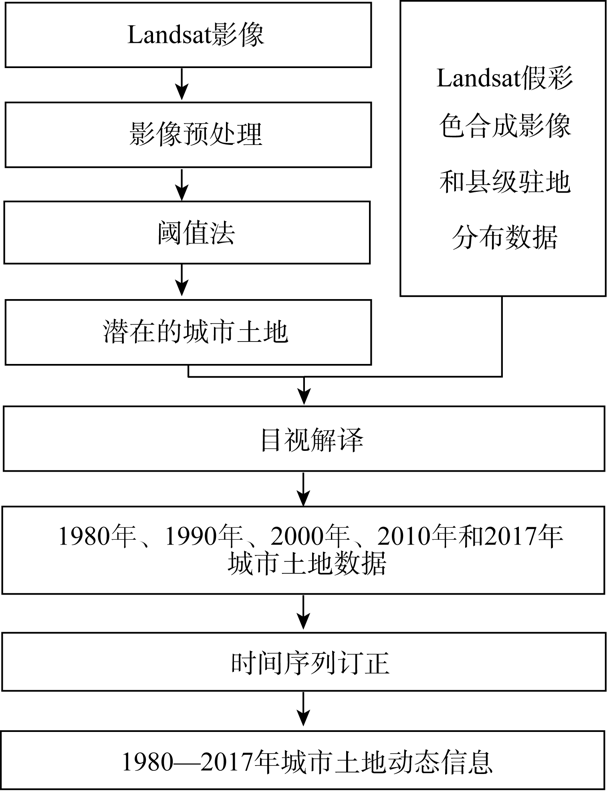
图2
区域近四十年城市土地提取流程
Fig. 2
The flow chart for extracting urban land of the HBOY from 1980 to 2017
式中:
式中:
1.3.2 分析区域1980—2017年城市扩展过程
参照董宁等[29]的研究,选择斑块密度(Patch density,PD)、景观形状指数(Landscape shape index,LSI)和景观扩展指数(Landscape expansion index,LEI)等三个指标来表征城市景观的破碎度和形状以及城市扩展模式。其中PD的计算公式如下:
式中:N表示景观中斑块的总数(个);A为景观总面积(hm2)。PD值越大,表示斑块的破碎化程度越高。
LSI的计算公式如下:
式中:E表示景观中斑块边界的总长度(m);A为景观总面积(hm2)。LSI值越大,表示斑块的形状越不规则。
LEI的计算公式如下:
1.3.3 分析区域1980—2017年城市扩展过程的区位因素
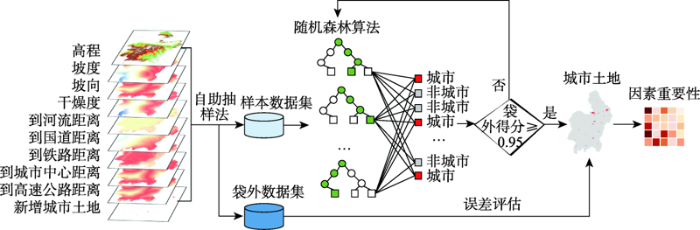
参考相关研究[13,15,31,32]以及数据的可获取性,首先从自然和人文两个方面选择了9个影响区域城市扩展过程的区位因素,分别是高程、坡度、坡向、到河流(主要河流)距离、干燥度、到高速公路距离、到铁路距离、到国道距离和到城市中心距离,并使用ArcGIS 10.6进行空间化(表1)。然后,通过四个步骤构建随机森林模型以分析区位因素对城市扩展过程的影响(图3)。第一,随机选择66%的区位因素数据为样本数据集,34%为袋外数据。第二,构建100个决策树对样本数据集进行训练,并与袋外数据进行对比计算袋外得分,以此评估模型的精度。一般得分越高代表模型精度越好,在本文中,袋外得分大于0.95时认为模型精度符合要求。第三,利用袋外数据与每个决策树计算误差(e1),然后随机调换袋外数据中的某一个因素j的顺序得到新的袋外数据,并再次计算误差(e2)。第四,将每个决策树e1和e2的差值标准化后求均值即可得到因素j的重要性。本文将因素的重要性得分作为判断某一因素对城市扩展过程影响程度的指标,得分越高说明该因素对城市扩展过程的影响越大。
表1 区位因素选取及其空间化方法
Table 1
| 类别 | 指标 | 空间化方法 |
|---|---|---|
| 自然因素 | 高程 | 基于DEM数据,利用ArcGIS的地表分析模型进行计算坡度和坡向;利用ArcGIS的距离分析模型计算到河流距离 |
| 坡度 | ||
| 坡向 | ||
| 到河流距离 | ||
| 干燥度 | 参考相关研究[1],利用多年平均降雨量与多年平均潜在蒸散量之比计算 | |
| 人文因素 | 到城市中心距离 | 利用ArcGIS的距离分析模型计算到城市中心、高速公路、铁路和国道距离 |
| 到高速公路距离 | ||
| 到铁路距离 | ||
| 到国道距离 |
图3
2 结果分析
2.1 区域城市扩展过程
图4
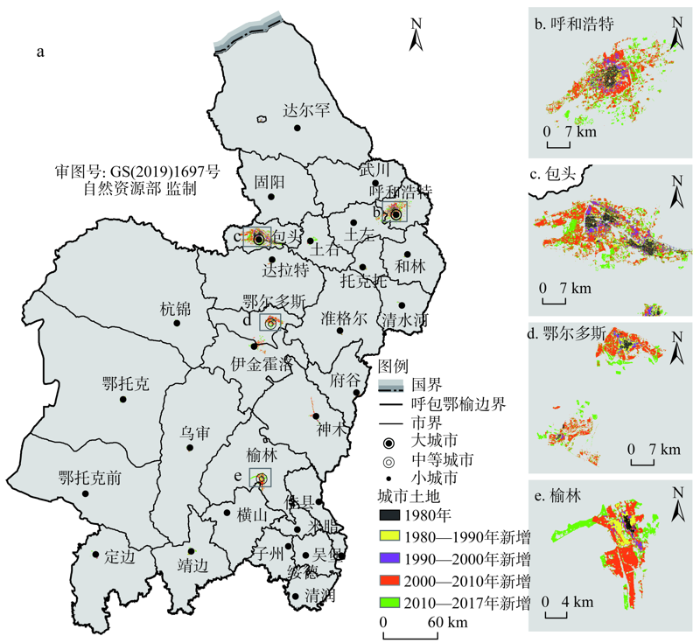
图4
1980—2017年区域城市土地的空间格局
Fig. 4
The spatial patterns of urban land in the HBOY from 1980 to 2017
图5
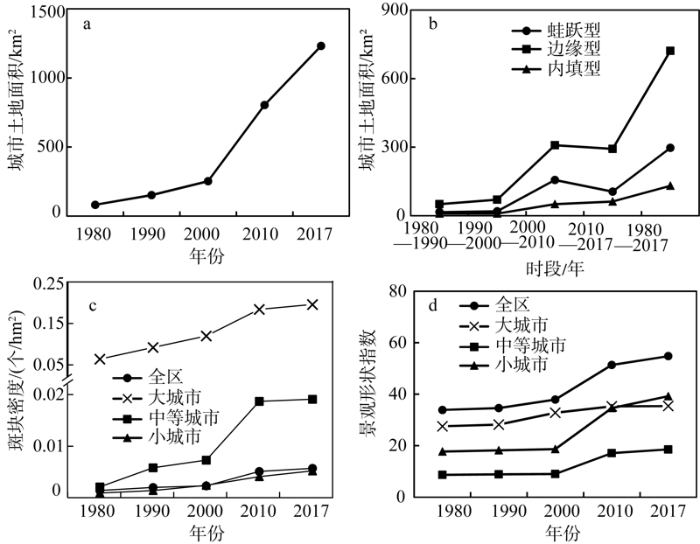
表2 1980—2017年区域城市扩展过程
Table 2
| 地区 | 城市扩展过程 | 城市扩展模式 | |||||||
|---|---|---|---|---|---|---|---|---|---|
| 面积/km2 | 占全区 比例/% | 年均增 长率/% | 边缘型 | 蛙跃型 | 内填型 | ||||
| 面积/km2 | 百分比/% | 面积/km2 | 百分比/% | 面积/km2 | 百分比/% | ||||
| 呼包鄂榆 | 1149.76 | 100 | 7.61 | 721.73 | 62.77 | 296.91 | 25.82 | 131.12 | 11.40 |
| 大城市 | 564.55 | 49.10 | 6.91 | 343.99 | 60.45 | 137.51 | 24.16 | 87.58 | 15.39 |
| 呼和浩特 | 226.12 | 19.67 | 7.39 | 139.60 | 59.00 | 71.35 | 30.15 | 25.67 | 10.85 |
| 包头 | 338.43 | 29.43 | 6.64 | 204.39 | 61.48 | 66.16 | 19.90 | 61.91 | 18.62 |
| 中等城市 | 211.80 | 18.42 | 9.18 | 173.36 | 75.13 | 45.21 | 19.59 | 12.18 | 5.28 |
| 鄂尔多斯 | 120.76 | 10.50 | 8.60 | 96.84 | 72.23 | 32.58 | 24.30 | 4.66 | 3.48 |
| 榆林 | 91.03 | 7.92 | 10.21 | 76.52 | 79.16 | 12.63 | 13.07 | 7.52 | 7.78 |
| 小城市 | 373.41 | 32.48 | 8.25 | 204.38 | 58.41 | 114.19 | 32.63 | 31.36 | 8.96 |
| 土默特左 | 37.93 | 3.30 | 10.31 | 10.98 | 37.30 | 16.01 | 54.38 | 2.45 | 8.32 |
| 托克托 | 15.44 | 1.34 | 11.55 | 10.95 | 70.97 | 3.13 | 20.29 | 1.35 | 8.75 |
| 和林格尔 | 9.63 | 0.84 | 7.22 | 6.04 | 62.59 | 2.80 | 29.02 | 0.81 | 8.39 |
| 清水河 | 3.85 | 0.34 | 8.40 | 2.50 | 63.94 | 1.06 | 27.11 | 0.35 | 8.95 |
| 武川 | 8.73 | 0.76 | 6.36 | 7.14 | 80.50 | 1.17 | 13.19 | 0.56 | 6.31 |
| 土默特右 | 32.21 | 2.80 | 8.06 | 20.63 | 64.09 | 8.38 | 26.03 | 3.18 | 9.88 |
| 固阳 | 8.58 | 0.75 | 6.44 | 6.35 | 72.41 | 1.78 | 20.30 | 0.64 | 7.30 |
| 达茂旗 | 7.92 | 0.69 | 7.61 | 0.98 | 12.36 | 6.67 | 84.11 | 0.28 | 3.53 |
| 达拉特 | 27.83 | 2.42 | 7.20 | 18.81 | 66.94 | 4.38 | 15.59 | 4.91 | 17.47 |
| 准格尔 | 13.86 | 1.21 | 8.60 | 6.00 | 43.01 | 6.80 | 48.75 | 1.15 | 8.24 |
| 鄂托克前 | 7.03 | 0.61 | 6.26 | 4.27 | 60.83 | 1.93 | 27.49 | 0.82 | 11.68 |
| 鄂托克 | 12.30 | 1.07 | 7.60 | 7.09 | 57.83 | 3.60 | 29.36 | 1.57 | 12.81 |
| 杭锦 | 9.86 | 0.86 | 4.05 | 7.32 | 72.69 | 1.43 | 14.20 | 1.32 | 13.11 |
| 乌审 | 11.57 | 1.01 | 6.88 | 6.56 | 56.65 | 4.45 | 38.43 | 0.57 | 4.92 |
| 伊金霍洛 | 35.93 | 3.13 | 10.81 | 11.98 | 49.79 | 11.51 | 47.84 | 0.57 | 2.37 |
| 靖边 | 30.95 | 2.69 | 12.77 | 21.50 | 69.13 | 7.06 | 22.70 | 2.54 | 8.17 |
| 定边 | 20.99 | 1.83 | 8.00 | 14.08 | 67.30 | 5.27 | 25.19 | 1.57 | 7.50 |
| 府谷 | 9.13 | 0.79 | 7.32 | 6.05 | 65.05 | 2.37 | 25.48 | 0.88 | 9.46 |
| 神木 | 36.18 | 3.15 | 11.83 | 15.83 | 42.85 | 17.79 | 48.16 | 3.32 | 8.99 |
| 佳县 | 1.26 | 0.11 | 10.17 | 1.12 | 83.58 | 0.15 | 11.19 | 0.07 | 5.22 |
| 横山 | 11.21 | 0.98 | 10.85 | 3.95 | 64.54 | 1.56 | 25.49 | 0.61 | 9.97 |
| 米脂 | 6.58 | 0.57 | 8.97 | 4.22 | 63.36 | 1.72 | 25.83 | 0.72 | 10.81 |
| 子州 | 3.15 | 0.27 | 6.81 | 2.16 | 69.90 | 0.88 | 28.48 | 0.05 | 1.62 |
| 绥德 | 6.65 | 0.58 | 8.09 | 4.92 | 74.89 | 0.70 | 10.65 | 0.95 | 14.46 |
| 吴堡 | 2.38 | 0.21 | 5.76 | 1.70 | 72.03 | 0.61 | 25.85 | 0.05 | 2.12 |
| 清涧 | 2.27 | 0.20 | 8.41 | 1.25 | 54.35 | 0.98 | 42.61 | 0.07 | 3.04 |
2.2 区域城市扩展的区位因素
在全区尺度上,到城市中心距离的重要性最高,为42.62%。国道、高速公路和铁路等交通因素的重要性也比较高,分别为16.20%、14.15%和11.80%。不同规模等级城市的区位因素重要性存在明显差异。对于大城市,到城市中心距离、高程和干燥度都比较重要,重要性分别为21.27%、20.33和20.23%;其次国道和河流的影响也比较大,分别为8.73%和8.12%。对于中等城市,到城市中心距离影响最大,为46.71%;国道、铁路、高速公路等交通因素和到河流距离都比较重要,重要性分别为18.09%、12.08%、8.13%和8.15%。对于小城市,到城市中心距离重要性最高,为53.37%;国道、高速公路和铁路等交通因素的重要性也比较高,分别为11.34%、10.03%和9.89%(图6a)。总体来看,到城市中心距离在区域1980—2017年城市扩展过程中扮演了最重要的角色。其次,交通因素、高程、干燥度与到河流距离等区位因素的影响也比较大。
图6
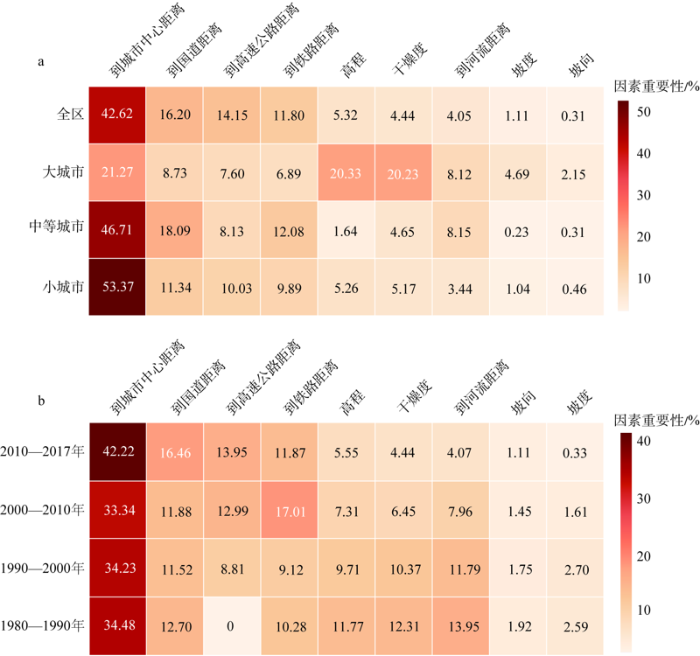
图6
区位因素的重要性
注:a为1980—2017年区位因素的重要性;b为全区不同时间段区位因素的重要性。
Fig. 6
The importance of location factors
区位因素对区域城市扩展过程的影响都存在尺度效应,其中地形、干燥度和到河流距离因素的尺度效应相对比较明显。高程、坡度和坡向等地形因素对大中小城市的扩展过程影响分别为27.17%、2.18%和6.96%,其对大城市的影响是对小城市的4.02倍。干燥度对大中小城市的影响分别为20.23%、4.65%和5.17%,其对大城市的影响是对小城市的3.91倍。到河流距离对大中小城市的影响分别为8.12%、8.15%和3.44%,其对大城市的影响是对小城市的2.36倍。此外,到城市中心距离和交通因素,其对大城市的影响分别是对小城市的0.40倍和0.74倍(图6a)。总体来看,地形因素对不同规模等级城市扩展过程影响的尺度效应最明显,其次是干燥度和到河流距离因素。
图7
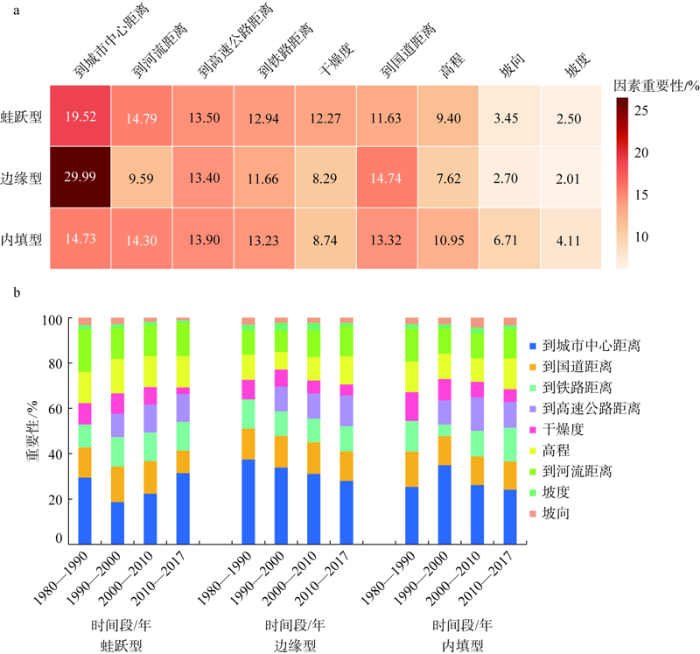
图7
不同城市扩展模式的区位因素重要性
注:a为1980—2017年区位因素的重要性;b为不同时间段区位因素的重要性。
Fig. 7
The importance of location factors on urban growth modes
区位因素对于不同扩展模式的重要性随时间的变化而变化。对于蛙跃型扩展,到城市中心距离的重要性在1990—2017年间呈增长趋势,由18.64%增长到31.43%。干燥度和高程因素的重要性呈减少趋势,分别由8.93%和15.25%下降到3.03%和13.73%(图7b)。对于边缘型扩展,1990—2017年间,到城市中心距离对区域城市扩展的影响呈下降趋势,由33.85%下降到28.07%。高程和到河流距离影响呈现增加趋势,分别由7.77%和9.51%增长到12.42%和13.14%(图7b)。对于内填型扩展,国道、高速公路和铁路等交通因素的重要性程序增长趋势,由29.07%增长到38.70%。到城市中心距离在1990—2017年间呈下降趋势,由35.01%下降到24.13%(图7b)。
3 讨论
3.1 城市土地数据可靠性评价
本文中目视解译获取的城市土地数据能够准确地反映区域城市土地的实际状况。首先,参考相关研究[33,34],分别利用区域GDP年均增长量和城镇人口年均增长量与城市土地年均增长量进行相关分析。结果显示本文提取的城市土地信息与区域GDP和城镇人口数据有显著相关性,相关系数分别为0.85和0.96,都通过了0.001的显著性检验(图8)。其次,采用等量分层随机抽样(Equalized stratified random sampling)的方法选取1000个样本点,结合Google Earth高分辨率(4 m)影像计算误差矩阵。结果显示,1980年、1990年、2000年、2010年和2017年的城市土地数据Kappa系数分别为0.86、0.87、0.87、0.85和0.86,总体精度分别为92.80%、93.30%、93.40%、92.60%和92.80%。此外,以1990—2010年的数据为例,将本文获取的城市土地数据与已有的长时间序列且同分辨率的数据[28]进行对比发现,本文的城市土地数据明显地减少了漏分和错分,更符合区域城市土地的实际状况(图9)。
图8
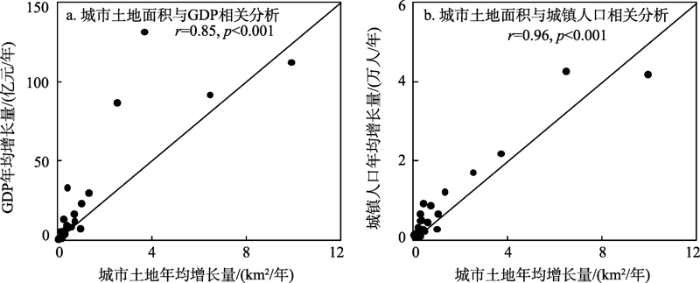
图8
1980—2017年区域城市土地数据的数量精度验证
Fig. 8
The quantitative accuracy assessment of urban land in the HBOY from 1980 to 2017
图9
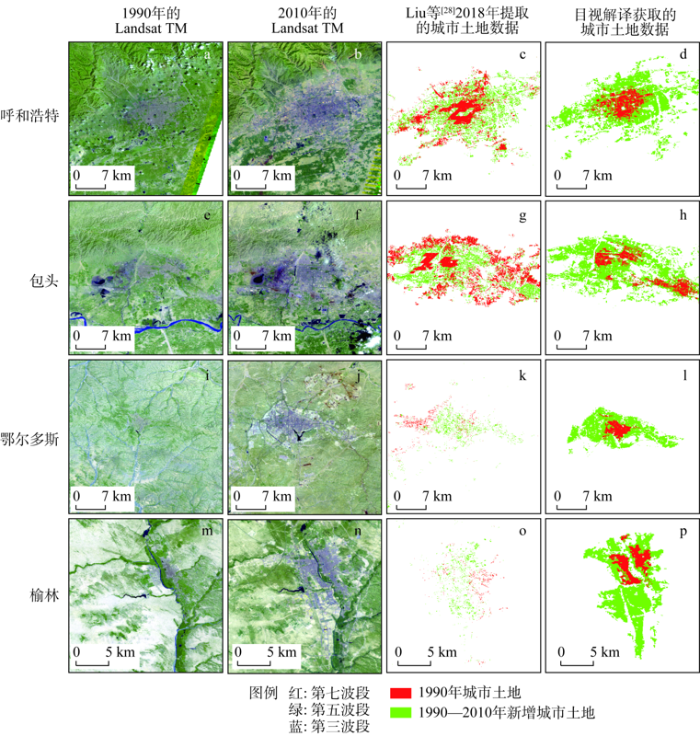
图9
目视解译获取的区域1990—2010年城市土地数据与已有数据对比
Fig. 9
The comparison between the urban land data obtained by visual interpretation and the existing data from 1990 to 2010
3.2 随机森林方法比Logistic回归更有利于揭示区位因素的基本特征
ROC(Receiver operating characteristic)曲线和AUC(Area under curve)指标是判断机器学习二分类预测模型优劣的常用方法,AUC值越大表示该算法精度越高[19,35]。为此,基于相同的区位因素,分别利用随机森林和Logistic回归方法模拟区域1980—2017年的城市扩展过程。通过与实际的城市土地数据对比,随机森林方法的AUC值为0.97,而Logistic回归的AUC值为0.88(图10),表明随机森林方法在呼包鄂榆城市群的实践应用上表现更好,精度更高。这主要是因为随机森林方法更适宜于解决非线性问题。一方面,相较于Logistic回归,随机森林可以处理非线性特征,而且考虑了各特征变量之间的相互作用,能够很好地解决特征变量之间的多重共线性影响[18,35]。另一方面,随机森林模型在数据训练的过程中采用有放回的随机抽样,同时在选取特征变量是也是随机选取,这样保证了决策树之间的独立性,提高了模型的模拟能力[18,36]。
图10
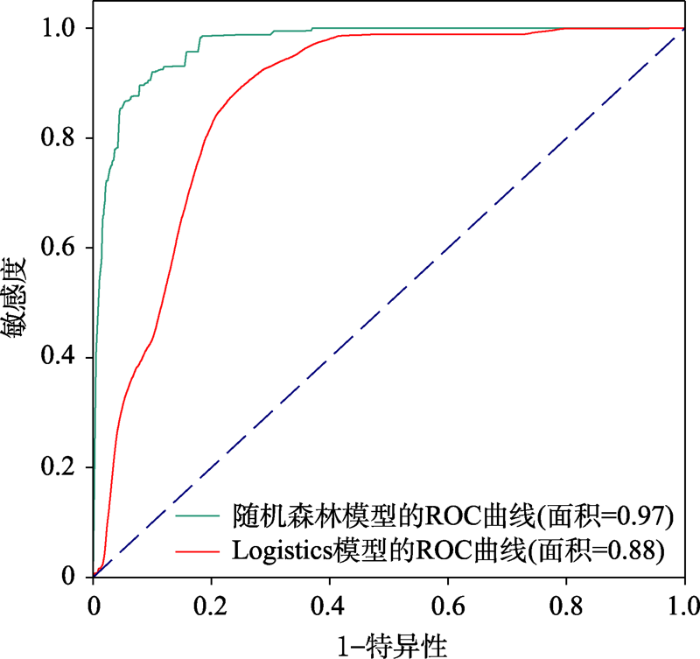
图10
随机森林和Logistic回归的ROC曲线
Fig. 10
The ROC curves of random forest and logistic regression
4 结论
随机森林方法能够更加有效地量化旱区城市扩展过程区位因素的基本特征。在呼包鄂榆城市群案例分析中,随机森林方法的AUC值达到了0.97,明显高于Logistic回归方法的AUC值。其次,到城市中心距离对区域1980—2017年城市扩展过程影响最大,重要性为42.62%。此外,区位因素对区域城市扩展过程的影响都存在尺度效应,其中高程、坡度和坡向等地形因素、气候以及到河流距离的尺度效应最为明显。
为此,建议在未来的城市规划和建设中,区域上应继续高度重视地形、气候和河流等自然要素的制约作用。对于大城市,应结合区域高精度的地形数据制定城市规划,同时应该将气候条件纳入城市规划中,充分考虑气候对新增城市土地的制约影响。此外,也需要考虑河流对新增城市土地的影响。比如,在制定包头市国土空间总体规划(2021—2035年)的过程中,应将地形、干燥度和到河流距离作为优先考虑的限制条件,引导城市向地形条件相对较好、水资源丰富以及相对湿润的南部扩展。对于中等城市,应主要依托交通网络制定城市规划,充分发挥交通因素对城市的带动作用。比如,鄂尔多斯市未来城市建设应充分考虑呼包鄂榆城市群规划“三纵三横”交通网络中“鄂—准—乌交通运输大通道”和“包茂综合运输大通道”的影响,借助城市群综合交通运输网带动区域城市发展[23]。对于小城市,需要紧密依托现有的城市格局,充分发挥老城区的辐射带动作用。此外,在未来的城市规划中对于不同模式的城市扩展也应该采取针对性的措施。事实上,旱区的生态环境脆弱,气候和河流等自然因素对城市发展的制约作用比湿润地区更明显[37,38]。对旱区的城市发展,应该保持高度的谨慎态度,特别要注意在水资源承载力和地形的约束范围内进行,对不同规模等级城市和扩展模式针对性地制定规划,因地制宜地进行城市建设。
本文运用随机森林方法定量分析了区位因素对旱区不同规模等级城市扩展过程的影响,并提出相应的政策建议,这对旱区城市可持续发展具有重要意义。但本文也存在一些不足。首先,未考虑周边区位因素对目标像元的影响。目标像元是否转化为城市像元,不仅受该像元处的区位因素影响,往往还受到一定邻域范围内的区位因素影响[6]。其次,本文只分析了区位因素对城市扩展的影响。城市扩展过程是一个极其复杂的过程,受到政策规划、社会经济发展和微观区位等多方面因素的影响[8,38]。在未来的研究中,可以使用深度卷积神经网络,通过设置卷积核参数来分析目标像元一定邻域范围内区位因素对城市扩展过程的影响。此外,可以整合社会经济、规划政策以及地理区位等多因素综合分析旱区城市扩展的驱动机制。
参考文献
Ecosystems and Human Well-being
Landscape urbanization and economic growth in China: Positive feedbacks and sustainability dilemmas
DOI:10.1021/es202329f
URL
PMID:22103244
[本文引用: 1]

Accelerating urbanization has been viewed as an important instrument for economic development and reducing regional income disparity in some developing countries, including China. Recent studies (Bloom et al. 2008) indicate that demographic urbanization level has no causal effect on economic growth. However, due to the varying and changing definition of urban population, the use of demographic indicators as a sole representing indicator for urbanization might be misleading. Here, we re-examine the causal relationship between urbanization and economic growth in Chinese cities and provinces in recent decades, using built-up areas as a landscape urbanization indicator. Our analysis shows that (1) larger cities, both in terms of population size and built-up area, and richer cities tend to gain more income, have larger built-up area expansion, and attract more population, than poorer cities or smaller cities; and (2) that there is a long-term bidirectional causality between urban built-up area expansion and GDP per capita at both city and provincial level, and a short-term bidirectional causality at provincial level, revealing a positive feedback between landscape urbanization and urban and regional economic growth in China. Our results suggest that urbanization, if measured by a landscape indicator, does have causal effect on economic growth in China, both within the city and with spillover effect to the region, and that urban land expansion is not only the consequences of economic growth in cities, but also drivers of such growth. The results also suggest that under its current economic growth model, it might be difficult for China to control urban expansion without sacrificing economic growth, and China's policy to stop the loss of agricultural land, for food security, might be challenged by its policy to promote economic growth through urbanization.
A self-modified cellular automaton model of historical urbanization in the San Francisco Bay Area
An analysis on driving force system of land use changes
Will rapid urban expansion in the drylands of Northern China continue: A scenario analysis based on the land use scenario dynamics-urban model and the shared socioeconomic pathways
Detecting global urban expansion over the last three decades using a fully convolutional network
Urban expansion dynamics and natural habitat loss in China: A multiscale landscape perspective
The implications of current and future urbanization for global protected areas and biodiversity conservation
The impairment of environmental sustainability due to rapid urbanization in the dryland region of Northern China
The relationship between the change of water system and the urban land expansion in Changsha
Research progress on assessing the impacts of urban expansion on natural habitats
Urban expand and driving factors in the recent 20 years in case of Huhhot city
Research on urban expansion and drive mechanism in an oasis town of arid region: A case of Zhangye city
Understanding multi-scale urban expansion driving forces: In the case study of Beijing
Spatiotemporal variability of urban growth factors: A global and local perspective on the megacity of Mumbai
Drivers of urban expansion over the past three decades: A comparative study of Beijing, Tianjin, and Shijiazhuang
DOI:10.1007/s10661-018-7151-z
URL
PMID:30593608
[本文引用: 1]
Urban expansion is influenced by various natural and anthropogenic factors. Understanding the driving forces of urban expansion is crucial for modeling the process of urban expansion as well as guiding urban planning and management. Here, we quantified and compared the effects of natural, socioeconomic, and neighboring factors on urban expansion and their temporal dynamics in three large cities in the Jing-Jin-Ji Urban Agglomeration: Beijing, Tianjin, and Shijiazhuang. We used remote sensing imagery from six epochs (circa 1980, 1990, 1995, 2000, 2005, and 2010) integrated with GIS techniques and analyzed using binary logistic regression. The relative importance of the three types of driving forces was further decomposed using variance partitioning. We found that the direction and/or magnitude of effects on the drivers of urban expansion varied with both epoch and city. Natural factors placed significant constraints at early stages of urban expansion, but this constraint relaxed over time. As precursor drivers of urbanization, socioeconomic factors significantly influenced urban growth in most epochs for each city. Non-urban lands near existing urban areas were more likely to be urbanized, due to easier access to existing transportation infrastructure and other facility resources. Furthermore, with urbanization, individual effects of drivers tended to be replaced by joint effects, especially for the neighboring factors. Similarities and differences in the individual and joint effects of drivers on urban expansion across cities and through time will provide valuable information for adaptive urban development strategies in the national capital region of China.
Simulating urban growth using a Random Forest-Cellular Automata (RF-CA) Model
Multiple intra-urban land use simulations and driving factors analysis: A case study in Huicheng, China
Multi-scale analysis of ecosystem service trade-offs in urbanizing drylands of China: A case study in the Hohhot-Baotou-Ordos-Yulin region
Rapid urban land expansion in earthquake-prone areas of China
Understanding land system change through scenario-based simulations: A case study from drylands in Northern China
DOI:10.1007/s00267-016-0802-3
URL
PMID:28004140
[本文引用: 1]
The drylands in northern China are expected to face dramatic land system change in the context of socioeconomic development and environmental conservation. Recent studies have addressed changes of land cover with socioeconomic development in the drylands in northern China. However, the changes in land use intensity and the potential role of environmental conservation measures have yet to be adequately examined. Given the importance of land management intensity to the ecological conditions and regional sustainability, our study projected land system change in Hohhot city in the drylands in northern China from 2013 to 2030. Here, land systems are defined as combinations of land cover and land use intensity. Using the CLUMondo model, we simulated land system change in Hohhot under three scenarios: a scenario following historical trends, a scenario with strong socioeconomic and land use planning, and a scenario focused on achieving environmental conservation targets. Our results showed that Hohhot is likely to experience agricultural intensification and urban growth under all three scenarios. The agricultural intensity and the urban growth rate were much higher under the historical trend scenario compared to those with more planning interventions. The dynamics of grasslands depend strongly on projections of livestock and other claims on land resources. In the historical trend scenario, intensively grazed grasslands increase whereas a large amount of the current area of grasslands with livestock converts to forest under the scenario with strong planning. Strong conversion from grasslands with livestock and extensive cropland to semi-natural grasslands was estimated under the conservation scenario. The findings provide an input into discussions about environmental management, planning and sustainable land system design for Hohhot.
Impacts of urban expansion on net primary productivity in the agro-pastoral ecotone in Northern China: A case of Hohhot-Baotou-Ordos region
Impacts of urban expansion on ecosystem services in the drylands of Northern China: A case study in the Hohhot-Baotou-Ordos Urban Agglomeration region
Evaluating the effects of urban expansion on natural habitat quality by coupling localized shared socioeconomic pathways and the land use scenario dynamics-urban model
High-resolution multi-temporal mapping of global urban land using Landsat images based on the Google Earth Engine Platform
Changes in the spatiotemporal pattern of urbanization in Erdos of Inner Mongolia and related driving forces
A new landscape index for quantifying urban expansion using multi-temporal remotely sensed data
Driving forces analysis of urban expansion based on boosted regression trees and Logistic regression
Analysis of urban expansion in northwest minority area: A case study of Hohhot city
Extracting the dynamics of urban expansion in China using DMSP-OLS nighttime light data from 1992 to 2008
How did urban land expand in China between 1992 and 2015? A multi-scale landscape analysis
Land-cover change model validation by an ROC method for the Ipswich watershed, Massachusetts, USA
Analysis of a random forests model
The varying driving forces of urban expansion in China: Insights from a spatial-temporal analysis
Geogovernance of national land use based on coupled human and natural systems
