

本文在全面分析河北省AQI时空分布特征基础上,结合统计分析、空间插值等方法,揭示河北省大气污染的时空变化趋势,同时研究气象和社会经济关键因子对这种变化的作用,对深入了解河北省大气污染变化与成因有重要的意义。
1 研究方法与数据来源
1.1 研究区概况
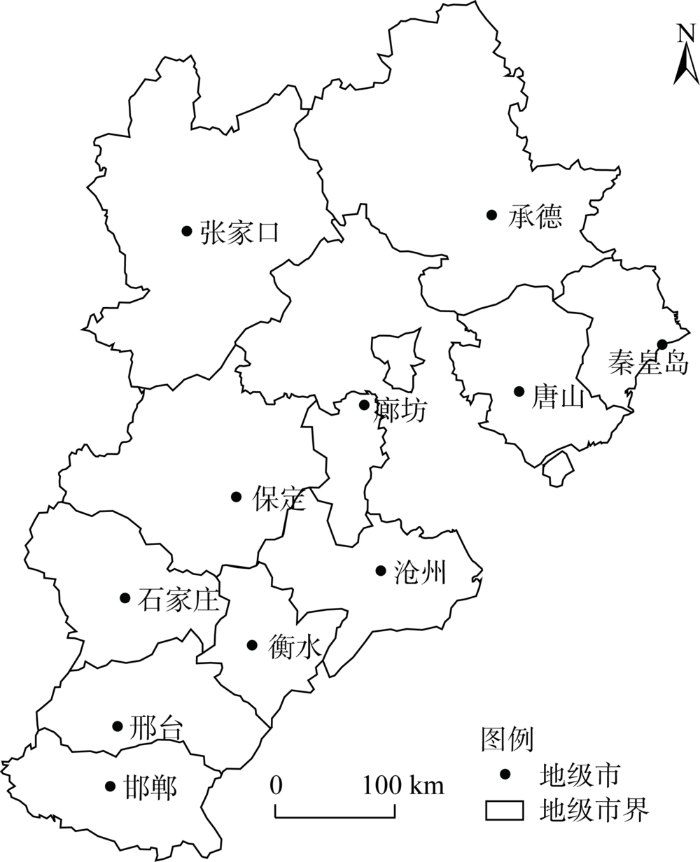
河北省是京津冀十分重要的一部分,在华北平原的北部,包括十一个城市(图1)。
图1
1.2 数据来源
1.2.1 AQI指标
2012年环境保护部公布了《环境空气质量标准》(GB3095-2012),用AQI表达空气质量。AQI越大、等级越高,表明空气污染越严重(表1)。
表1 AQI范围及相应的空气质量类别
Table 1
| AQI | 等级 | 状况 |
|---|---|---|
| 0~50 | Ⅰ | 优 |
| 51~100 | Ⅱ | 良 |
| 101~150 | Ⅲ | 轻度污染 |
| 151~200 | Ⅳ | 中度污染 |
| 201~300 | Ⅴ | 重度污染 |
| >300 | Ⅵ | 严重污染 |
1.2.2 空气质量监测点布局依据
空气质量监测点的功能是对大气污染物进行不断地测量。每个城市布局若干个监测点。监测点在建成区,并且分布均匀。
1.2.3 空气质量监测点数据的置信度和误差
在2014—2018年间,河北省空气质量监测点数据的置信度为95%,相对误差都小于5%(表2),其中,廊坊SO2相对误差为4.9266%,唐山NO2相对误差为1.6204%。
表2 河北省空气质量监测数据的相对误差
Table 2
| 城市 | PM2.5 | PM10 | SO2 | CO | NO2 | O3 |
|---|---|---|---|---|---|---|
| 保定 | 3.5982 | 2.9698 | 4.3388 | 3.9598 | 2.3788 | 2.8441 |
| 沧州 | 3.153 | 2.6298 | 3.3088 | 3.1208 | 2.0205 | 2.483 |
| 承德 | 3.6425 | 2.8918 | 3.3894 | 2.7278 | 1.983 | 2.4802 |
| 邯郸 | 3.3848 | 2.644 | 3.8454 | 3.0217 | 2.0908 | 2.7091 |
| 衡水 | 3.2628 | 2.8221 | 3.8933 | 2.9621 | 2.2107 | 2.4266 |
| 廊坊 | 4.082 | 3.1345 | 4.9266 | 3.3862 | 2.1872 | 2.8967 |
| 秦皇岛 | 3.7035 | 2.906 | 3.6954 | 3.2137 | 1.8202 | 2.5462 |
| 石家庄 | 3.8578 | 3.0932 | 4.1925 | 3.649 | 2.2642 | 2.9504 |
| 唐山 | 3.3202 | 2.6416 | 3.2847 | 2.7789 | 1.6204 | 2.844 |
| 邢台 | 3.5518 | 2.7978 | 3.9367 | 3.0046 | 1.8408 | 2.8689 |
| 张家口 | 3.8823 | 3.2757 | 4.542 | 2.6313 | 2.395 | 2.0458 |
1.2.4 数据处理方法
一个城市里全部监测点的污染物浓度的算术平均值代表该城市污染物浓度的总体平均值。每日AQI数据是当天每小时数据的平均值。
1.2.5 数据来源
空气质量数据来自我国空气质量平台。气象数据来自我国气象网。社会经济数据来自《河北省统计年鉴》,主要包括GDP、人口、林业、农业、人均GDP、电力消耗量、第一、二、三产业、森林面积、NOx与SO2的排放量、耕地面积等数据。
1.3 研究方法
利用SPSS统计分析软件计算了空气质量指数和气象要素、社会经济要素的相关系数。为分析2014—2018年河北省AQI的变化趋势(变化率),采用了一元线性回归分析,并采用t检验法对变化率做了显著性检验。空间插值法利用克里金法进行AQI空间分析。
2 结果分析
2.1 大气污染年际变化和空间分布特征
利用线性趋势法计算2014—2018年河北省AQI变化趋势表明(图2、表3),张家口市AQI变化率最小,线性趋势约为0.375/年;保定市AQI变化率最大,线性趋势约为-11.683/年;河北省AQI变化趋势的空间分布呈中部、南部和东部减速大而西北部变化不大。2014—2018年河北省平均AQI变化率(线性趋势)为-8.845/年,自2014—2018年河北省AQI逐步降低,空气质量逐渐改善。2014—2018年河北省AQI空间分布特征是从北部到南部逐渐增大,北部污染较轻,南部污染较重,且近5年没有明显变化;分区域来看,保定市AQI居河北省各市之首,而张家口AQI为河北省最低。也就是说,由南向北空气质量状况逐步转好。
图2
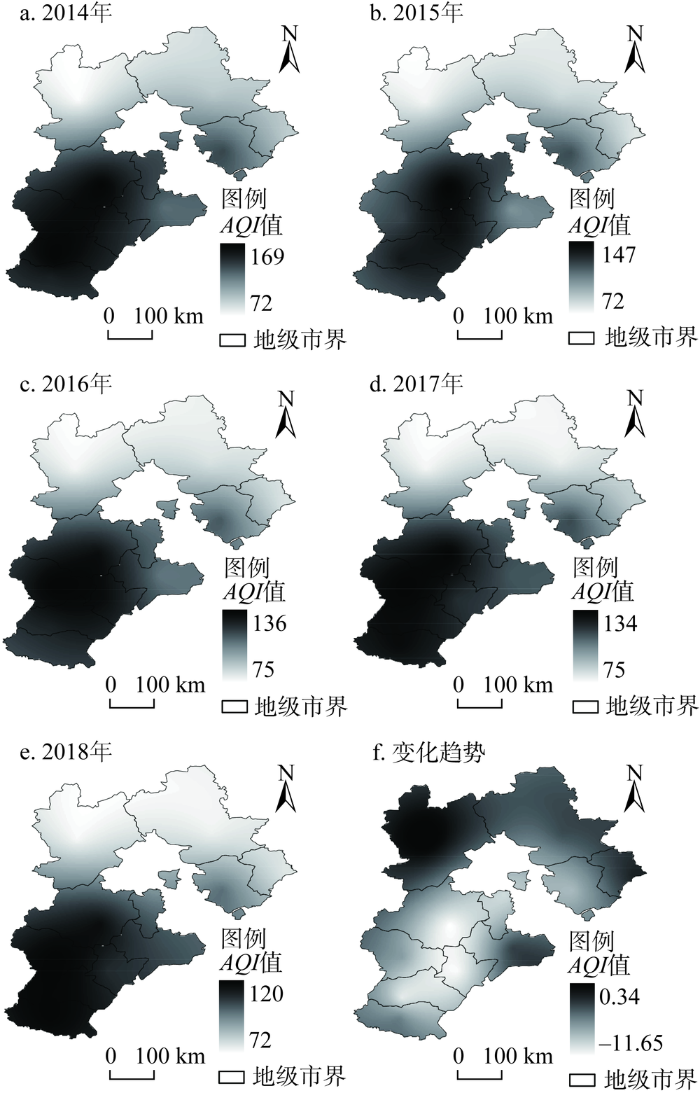
表3 2014—2018年河北省AQI年际变化趋势
Table 3
| 地区 | 保定 | 沧州 | 承德 | 邯郸 | 衡水 | 廊坊 | 秦皇岛 | 石家庄 | 唐山 | 邢台 | 张家口 | 河北省 |
|---|---|---|---|---|---|---|---|---|---|---|---|---|
| 变化趋势 | -11.683 | -3.8667 | -4.333 | -6.0083 | -11.508 | -9.975 | -2.4583 | -7.225 | -8.4917 | -10.775 | 0.375 | -8.845 |
2018年河北省秦皇岛市、张家口市和承德市空气质量优良等级所占比例依次为80.27%、79.18%、77.53%,且严重污染天数均为0;而石家庄、邯郸、保定三市优良天气所占比例较少(表4)。2018年空气质量最好的城市为秦皇岛市,最差的城市是石家庄市。
表4 2018年河北省AQI分级出现频率
Table 4
| 城市 | 优 | 良 | 轻度污染 | 中度污染 | 重度污染 | 严重污染 |
|---|---|---|---|---|---|---|
| 保定 | 6.85 | 38.36 | 33.15 | 13.42 | 7.67 | 0.27 |
| 沧州 | 5.21 | 47.12 | 30.68 | 12.05 | 3.56 | 0.55 |
| 承德 | 22.19 | 55.34 | 14.52 | 4.66 | 0.55 | 0 |
| 邯郸 | 0.55 | 43.56 | 34.25 | 13.15 | 5.48 | 1.92 |
| 衡水 | 2.47 | 54.25 | 28.49 | 9.32 | 4.56 | 1.1 |
| 廊坊 | 18.36 | 50.96 | 24.38 | 9.32 | 2.47 | 0.27 |
| 秦皇岛 | 18.36 | 61.92 | 15.89 | 2.47 | 0.82 | 0 |
| 石家庄 | 1.37 | 40 | 32.6 | 13.42 | 9.32 | 1.1 |
| 唐山 | 5.48 | 50.96 | 27.4 | 9.04 | 3.29 | 0.55 |
| 邢台 | 2.74 | 46.85 | 29.86 | 11.23 | 6.58 | 1.37 |
| 张家口 | 27.95 | 51.23 | 15.62 | 1.64 | 0.55 | 0 |
2.2 大气污染季节变化特征
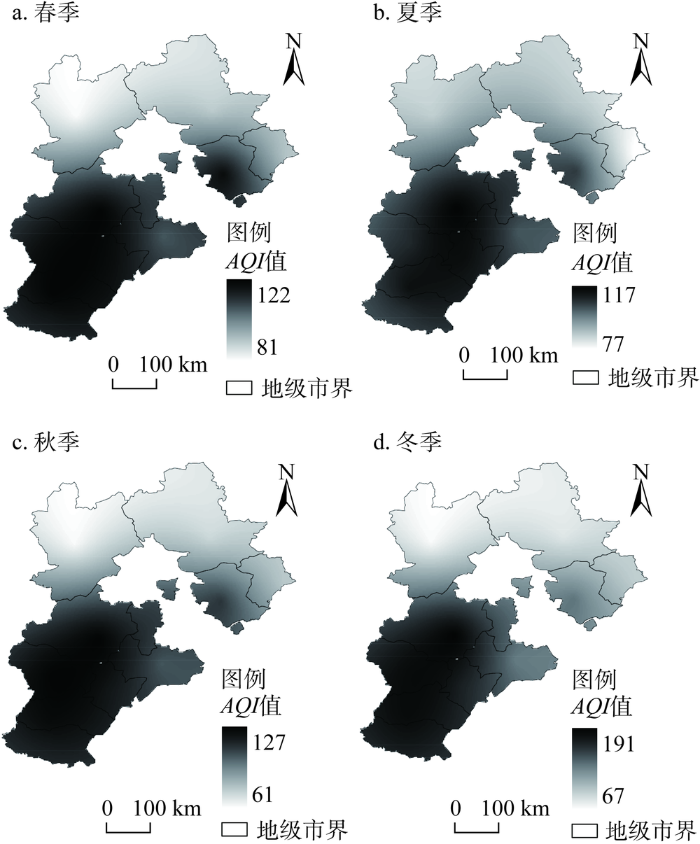
2014—2018年河北省AQI平均值在夏季最低,冬季最高,河北省AQI四季的变化趋势大致表现为:夏季<秋季<春季<冬季(图3),其AQI平均值分别为102、103、109、140。其中,保定市四个季节AQI平均值都是河北省最大的,而张家口市最低。在季节变化上,不同城市表现不尽相同,沧州市AQI平均值夏季小于秋季;承德市AQI平均值秋季小于夏季;邯郸市AQI平均值四季中夏季最小;而秦皇岛市夏季AQI平均值与秋季差别不大。这些现象的原因为在夏季地表增温快,进而产生强对流天气;而在冬季大气稳定,容易形成逆温,对空气污染物的分散不利,而且河北省为采暖期,进一步加重了大气污染,使得AQI平均值增加[10]。
图3
2.3 气象因素对大气污染的影响
图4
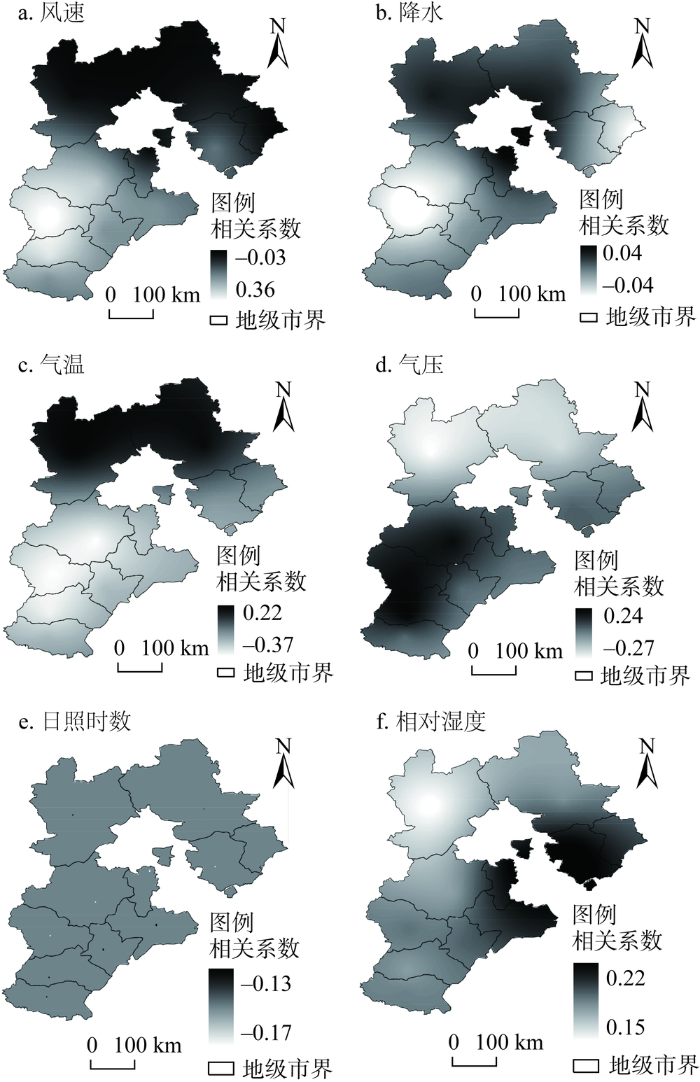
图4
河北省AQI和气象因子的相关系数空间分布
Fig. 4
Correlation coefficients between AQI and meteorological factors in Hebei province
石家庄、邢台和秦皇岛三市的降水与AQI呈现负相关,而河北省其他城市呈现正相关。降雨对大气污染物可以有冲刷与清除的效果。雨雪天气,大气污染物可以溶解在水中,可对气溶胶颗粒有清除作用,降低空气中污染物的浓度。因此,降水对污染物有很好的净化效果[10]。河北省AQI和日照时数呈负相关,而和相对湿度呈现正相关,当湿度较大时,会引起降水,从而使AQI降低,进而导致空气质量的改善。因此,如果相对湿度越大,那么空气质量越好。
2.4 社会经济因素对大气污染的影响
从图5可以看出,社会经济因素与AQI的相关性。除张家口之外,河北省各城市人口与AQI呈现负相关,即随着人口的增加,AQI越来越少。林业、农业发展状况与AQI的关系在河北省各市表现不同,如保定市AQI与农业发展呈现负相关,而张家口市AQI与农业发展表现为正相关。除张家口市外,河北省各地区生产总值GDP与AQI呈现负相关,当经济发展增快,重工业排放污染气体,加重空气污染,进而导致空气质量指数增加。但自从进入新世纪,河北省进行了产业升级,进而使得AQI减少。而且,国家和河北省都采取了一系列大气污染防治措施,积极地推动大气污染综合治理工作。为了更好地反映河北省大气污染总体水平与经济增长的关系,运用最小二乘法拟合AQI与GDP关系,得到拟合结果(图6)。从图6也可以看出,虽然河北省经济快速发展,但河北省AQI却逐年下降。主要是由于河北省加大环境污染治理投入,取得了较好的效果。
图5
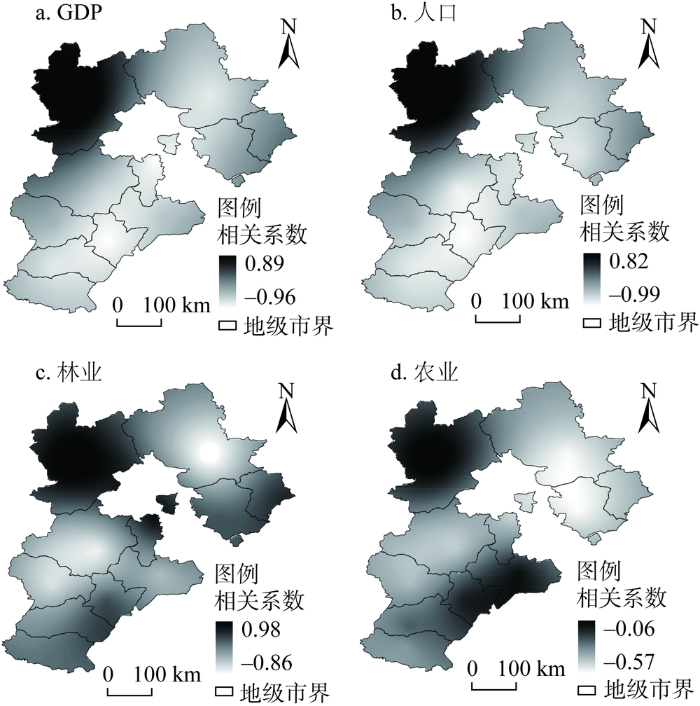
图5
河北省AQI与社会经济要素的相关系数空间分布
Fig. 5
Correlation coefficients between AQI and socio-economic factors in Hebei province
图6
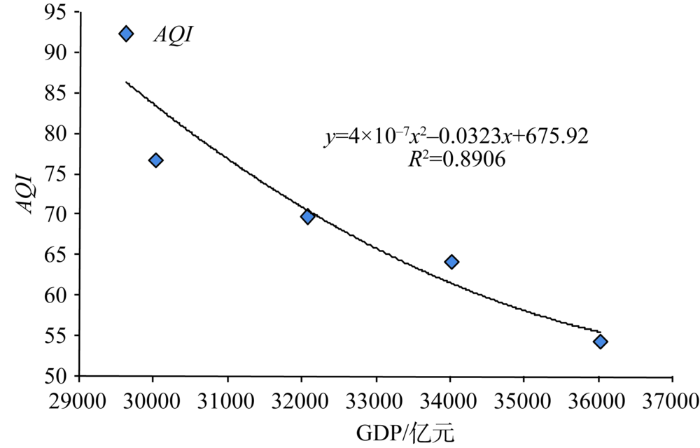
图6
河北省GDP(亿元)与AQI的关系
Fig. 6
The relationship between GDP (billion yuan) and AQI in Hebei province
从全省的角度分析,AQI与GDP、人均GDP、电力消耗量、第二产业、农业、森林面积呈负相关,而和NOx与SO2的排放量、第三产业、第一产业、耕地面积呈正相关(表5)。河北省社会经济因素人均GDP、人口与AQI的相关系数分别为 -0.9274和-0.9768,而二氧化硫排放量、氮氧化物排放量与AQI的相关系数分别为0.9462、0.9780。一般来说,环境质量转折点为人均GDP 6000~8000美元。2014年河北省人均GDP为 6300美元,已经在该区间。从 图5也可以看出,河北省已经超过EKC最大值,呈现集约型经济增长方式。河北省大气污染物排放量减少,也促使其大气污染与经济增长为异步阶段。
表5 河北省社会经济因素与AQI的相关系数
Table 5
| 因素 | GDP | 人均GDP | 人口 | 电力消费量 | SO2排放量 | NOx排放量 |
|---|---|---|---|---|---|---|
| 相关系数 | -0.9344** | -0.9274** | -0.9768** | -0.3259** | 0.9462** | 0.9780** |
| 因素 | 第三产业 | 第一产业 | 第二产业 | 农业 | 耕地面积 | 森林面积 |
| 相关系数 | 0.7677** | 0.4897** | -0.7243** | -0.6167** | 0.9997** | -0.9968** |
注:**代表通过了0.01显著性水平检验。
河北省AQI与耕地面积、森林面积的相关系数分别为0.9997、-0.9968。河北省森林面积与AQI呈现负相关,森林面积越多,昭示着植物越多,使得AQI越小。河北省耕地面积与AQI成正相关,在一定土地资源下,耕地面积的增多导致了森林面积的减少,进而导致AQI增加。
3 结论与讨论
大气污染的产生是多种要素共同作用的结果,而且它们的关系非常复杂。本文结果显示河北省空气质量与GDP、人口、森林面积、耕地面积关系密切。河北省经济和污染的非线性关系已经超过了EKC的最大值。随着河北省NOx与SO2排放量的减少,AQI也随着减少。
从河北省AQI年际变化率、季节变化和空间分布特征分析结果,可以得出河北省2014—2018年大气污染整体呈现逐步下降趋势;河北省各市AQI平均值在时间分布上均在夏季最低,冬季AQI平均值最高,在空间分布上北部污染较轻,南部污染较重且AQI变化趋势呈中部、南部和东部减速大,而西北部变化不大。
从河北省AQI与气象要素的相关系数分析结果,可以得出气象条件对河北省大气污染有显著的影响,其AQI基本和风速、气温、降水、日照时数呈现负相关,AQI和气压、相对湿度呈现正相关,气象条件不利是河北省大气污染诱导因素。
从河北省社会经济因素与AQI的相关系数分析结果,可以得出河北省大气污染还受到社会经济因素的显著影响,其AQI和GDP、人均GDP、电力消耗量、第二产业、农业、森林面积呈负相关,而和SO2排放量、NOx排放量、第三、第一产业、耕地面积呈正相关。然而林业、农业与AQI的关系在河北省各市表现不同。河北省经济发展对大气污染减少有重要的作用,空气污染与经济的关系已过了EKC的顶点,排放强度大是河北省大气重污染的主要因素。
河北省2014—2018年空气质量虽然大幅改善,但是治理工作仍任重道远。2018年河北省11市空气质量都未达标。因此,需要继续优化能源结构和产业结构,通过结构调整推动河北省经济高质量发展。
参考文献
Short-lived climate pollutant mitigation and the sustainable development goals
High secondary aerosol contribution to particulate pollution during haze events in China
DOI:10.1038/nature13774
URL
PMID:25231863
[本文引用: 1]

Rapid industrialization and urbanization in developing countries has led to an increase in air pollution, along a similar trajectory to that previously experienced by the developed nations. In China, particulate pollution is a serious environmental problem that is influencing air quality, regional and global climates, and human health. In response to the extremely severe and persistent haze pollution experienced by about 800 million people during the first quarter of 2013 (refs 4, 5), the Chinese State Council announced its aim to reduce concentrations of PM2.5 (particulate matter with an aerodynamic diameter less than 2.5 micrometres) by up to 25 per cent relative to 2012 levels by 2017 (ref. 6). Such efforts however require elucidation of the factors governing the abundance and composition of PM2.5, which remain poorly constrained in China. Here we combine a comprehensive set of novel and state-of-the-art offline analytical approaches and statistical techniques to investigate the chemical nature and sources of particulate matter at urban locations in Beijing, Shanghai, Guangzhou and Xi'an during January 2013. We find that the severe haze pollution event was driven to a large extent by secondary aerosol formation, which contributed 30-77 per cent and 44-71 per cent (average for all four cities) of PM2.5 and of organic aerosol, respectively. On average, the contribution of secondary organic aerosol (SOA) and secondary inorganic aerosol (SIA) are found to be of similar importance (SOA/SIA ratios range from 0.6 to 1.4). Our results suggest that, in addition to mitigating primary particulate emissions, reducing the emissions of secondary aerosol precursors from, for example, fossil fuel combustion and biomass burning is likely to be important for controlling China's PM2.5 levels and for reducing the environmental, economic and health impacts resulting from particulate pollution.
Transboundary health impacts of transported global air pollution and international trade
DOI:10.1038/nature21712
URL
PMID:28358094
[本文引用: 1]
Millions of people die every year from diseases caused by exposure to outdoor air pollution. Some studies have estimated premature mortality related to local sources of air pollution, but local air quality can also be affected by atmospheric transport of pollution from distant sources. International trade is contributing to the globalization of emission and pollution as a result of the production of goods (and their associated emissions) in one region for consumption in another region. The effects of international trade on air pollutant emissions, air quality and health have been investigated regionally, but a combined, global assessment of the health impacts related to international trade and the transport of atmospheric air pollution is lacking. Here we combine four global models to estimate premature mortality caused by fine particulate matter (PM2.5) pollution as a result of atmospheric transport and the production and consumption of goods and services in different world regions. We find that, of the 3.45 million premature deaths related to PM2.5 pollution in 2007 worldwide, about 12 per cent (411,100 deaths) were related to air pollutants emitted in a region of the world other than that in which the death occurred, and about 22 per cent (762,400 deaths) were associated with goods and services produced in one region for consumption in another. For example, PM2.5 pollution produced in China in 2007 is linked to more than 64,800 premature deaths in regions other than China, including more than 3,100 premature deaths in western Europe and the USA; on the other hand, consumption in western Europe and the USA is linked to more than 108,600 premature deaths in China. Our results reveal that the transboundary health impacts of PM2.5 pollution associated with international trade are greater than those associated with long-distance atmospheric pollutant transport.
华北黄淮冬季霾年代际增多与东亚冬季风的减弱
Interdecadal increase of haze in winter over North China and the Huang-huai Area and the weakening of the East Asia Winter Monsoon
京津冀及周边“2+26”城市秋冬季大气重污染气象条件及其气候特征研究
Study on meteorological conditions for heavy air pollution and its climatic characteristics in "2+26" cities around Beijing-Tianjin-Hebei region in autumn and winter
京津冀城市群大气污染的时空特征与影响因素解析
The spatial-temporal characteristics and influencing factors of air pollution in Beijing-Tianjin-Hebei urban agglomeration
京津冀地区气象要素对空气质量的影响及未来变化趋势分析
The Impact of meteorological factors on air quality in the beijing-tianjin-hebei region and trend analysis
河北霾分布与地形和风速关系分析
Analysis of relation between haze distribution and terrain and wind speed in Hebei province
近百年中国气候变化科学问题的新认识
Newly acquired knowledge on the scientific issues related to climate change over the recent 100 years in China
山东重点城市空气质量及其与气象要素的关系
Characteristics of air quality and the correlation between API and meteorological elements in major cities of Shandong province
2010年广州亚运期间空气质量与污染气象条件分析
Study on air quality and pollution meteorology conditions of guangzhou during the 2010 asian games
基于多源数据的PM2.5反演方法
Methods of PM2.5 inversion based on multi-source data
近50年我国雾和霾的长期变化特征及其与大气湿度的关系
Analysis of long-term variations of fog and haze in China in recent 50 years and their relations with atmospheric humidity
黑龙江省重点城市AQI指数特征及其与气象要素之关系
Characteristics of air quality index and its relationship with meteorological factors in key cities of Heilongjiang province
Spatial and temporal differences in traffic-related air pollution in three urban neighborhoods near an interstate highway
中国城市空气质量时空演化特征及社会经济驱动力
Spatio-temporal variations and socio-economic driving forces of air quality in Chinese cities
中国城市NO2浓度的时空分布及社会经济驱动力
Spatiotemporal variation in NO2 concentrations and socioeconomic driving forces in Chinese cities
Spatio-temporal variation of PM2.5 concentrations and their relationship with geographic and socioeconomic factors in China
DOI:10.3390/ijerph110100173
URL
PMID:24362546
[本文引用: 1]
The air quality in China, particularly the PM2.5 (particles less than 2.5 mum in aerodynamic diameter) level, has become an increasing public concern because of its relation to health risks. The distribution of PM2.5 concentrations has a close relationship with multiple geographic and socioeconomic factors, but the lack of reliable data has been the main obstacle to studying this topic. Based on the newly published Annual Average PM2.5 gridded data, together with land use data, gridded population data and Gross Domestic Product (GDP) data, this paper explored the spatial-temporal characteristics of PM2.5 concentrations and the factors impacting those concentrations in China for the years of 2001-2010. The contributions of urban areas, high population and economic development to PM2.5 concentrations were analyzed using the Geographically Weighted Regression (GWR) model. The results indicated that the spatial pattern of PM2.5 concentrations in China remained stable during the period 2001-2010; high concentrations of PM2.5 are mostly found in regions with high populations and rapid urban expansion, including the Beijing-Tianjin-Hebei region in North China, East China (including the Shandong, Anhui and Jiangsu provinces) and Henan province. Increasing populations, local economic growth and urban expansion are the three main driving forces impacting PM2.5 concentrations.
中国PM2.5污染与社会经济的空间关系及成因
Social and economic drivers of PM2.5 and their spatial relationship in China
环境规制效果与中国城市空气污染
Air pollution in chinese cities: does enforcement of environmental regulations matter?
中国中东部雾霾污染与入境旅游的时空动态关联分析
The spatiotemporal dynamic correlation analysis of haze pollution and inbound tourism in central and eastern China
