
碳减排目标约束对城市绿色全要素生产率的双边效应研究
|
许莹莹(1996- ),女,宁夏银川人,博士,讲师,研究方向为资源与环境经济。E-mail: 932809881@qq.com |
收稿日期: 2025-02-24
修回日期: 2025-06-04
网络出版日期: 2025-10-31
基金资助
国家社会科学基金项目(23BGL222)
Bilateral effects of carbon emission reduction target constraints on urban green total factor productivity
Received date: 2025-02-24
Revised date: 2025-06-04
Online published: 2025-10-31
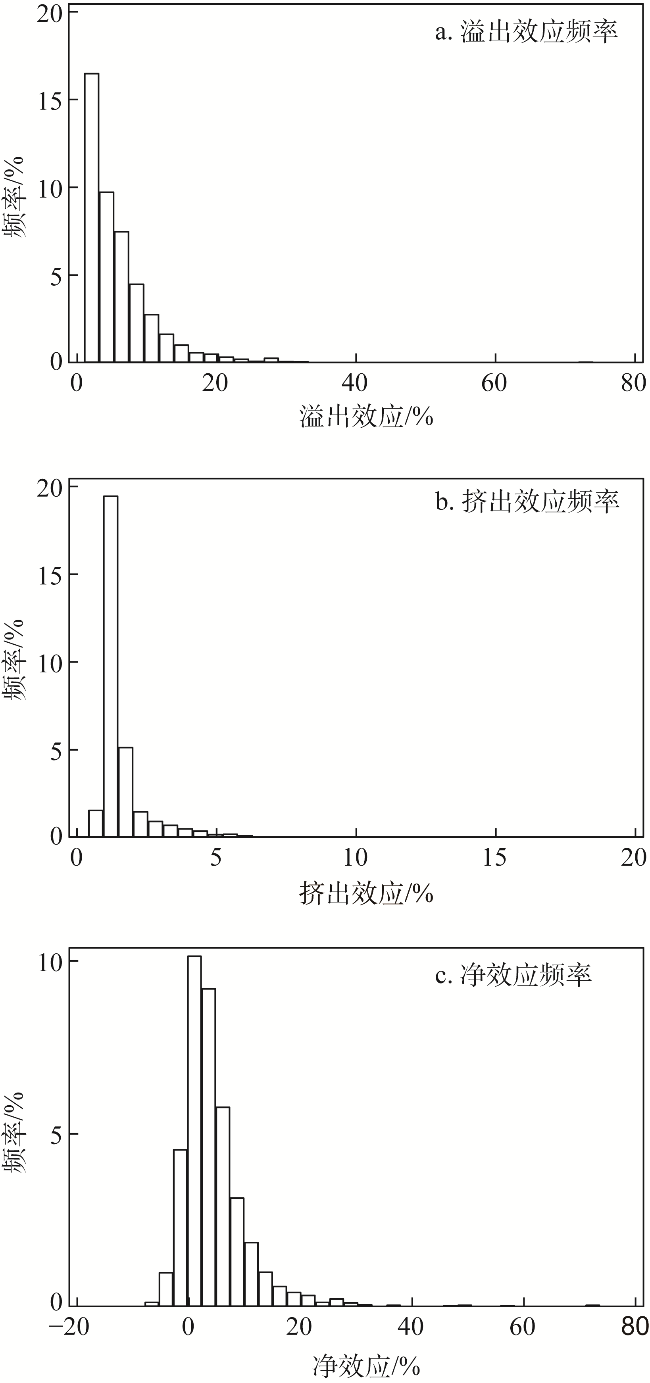
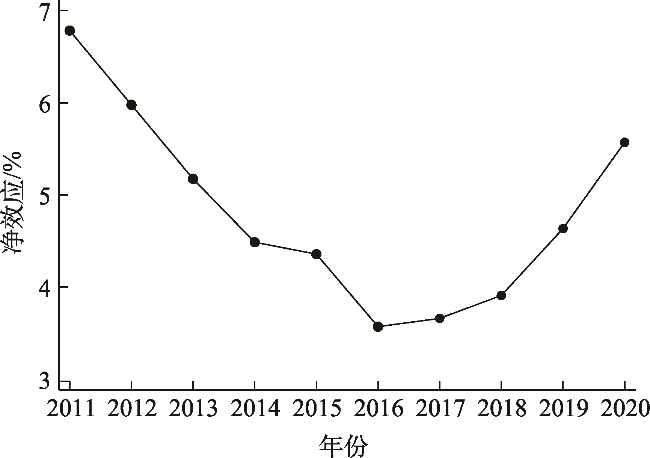
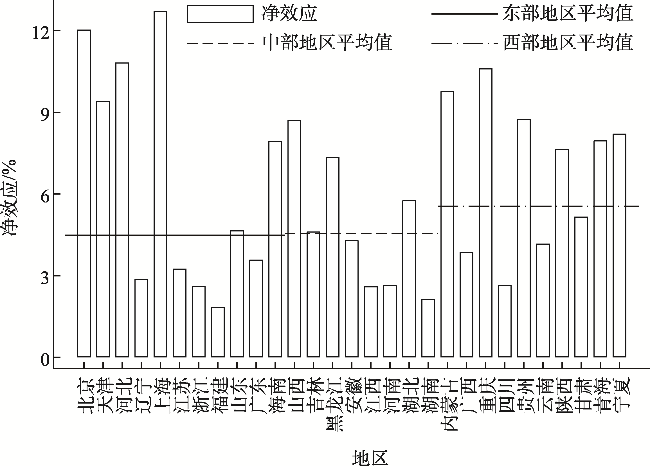
基于中国275个城市的面板数据,构建双边随机前沿模型,评估碳减排目标约束对城市绿色全要素生产率的“创新补偿”溢出效应、“遵循成本”挤出效应和净效应。结果表明:(1)碳减排目标约束对城市绿色全要素生产率存在双边效应,且溢出效应占主导地位。溢出效应使绿色全要素生产率上升6.468%,挤出效应使绿色全要素生产率降低1.655%,两者角力使净效应提高4.814%。(2)双边效应具有时空变化特征,双边效应综合作用下的净效应随时间呈“U”型曲线,并在空间上表现为西部地区最强、中部地区次之、东部地区最弱。(3)地方经济增长压力、资源禀赋和金融发展水平差异使双边效应具有异质性表现。研究拓展了对中国式碳强度目标管理以复杂方式影响城市绿色发展的理解,有助于政府把握碳减排目标约束政策设计的切入点。
许莹莹 , 高红贵 . 碳减排目标约束对城市绿色全要素生产率的双边效应研究[J]. 自然资源学报, 2025 , 40(11) : 3117 -3139 . DOI: 10.31497/zrzyxb.20251113
It is necessary to assess the impact of carbon emission reduction targets on urban green total factor productivity, a topic with significant practical implications. Based on a panel data of 275 Chinese cities, this paper constructs a two-tier stochastic frontier model to evaluate the "innovation compensation" spillover effect, "compliance cost" crowding-out effect, and net effect of carbon emission reduction targets on urban green total factor productivity. The main conclusions of this paper are as follows: (1) Carbon emission reduction targets have both "innovation compensation" spillover effects and "compliance cost" crowding-out effects on urban green total factor productivity. Among the effects of carbon emission reduction targets, the spillover effect prevails over the crowding-out effect. Specifically, the spillover effect of carbon emission reduction targets increases urban green total factor productivity by 6.468% relative to the frontier, while the crowding-out effect reduces urban green total factor productivity by 1.655% relative to the frontier. The combined action of the spillover and crowding-out effects results in a net effect of a 4.814% increase in urban green total factor productivity due to carbon emission reduction targets. (2) The spillover effect, crowding-out effect, and net effect of carbon emission reduction targets on urban green total factor productivity exhibit temporal and spatial variations. Specifically, under the combined influence of the spillover and crowding-out effects, the net effect of carbon emission reduction targets on urban green total factor productivity shows a U-shaped curve over time. Spatially, under the combined influence of the spillover and crowding-out effects, the net effect of carbon emission reduction targets on urban green total factor productivity varies across eastern, central, and western regions. The net effect is strongest in the western region, followed by the central region, and weakest in the eastern region. (3) Regional characteristic factors influence the spillover and crowding-out effects of carbon emission reduction targets on urban green total factor productivity. Specifically, local economic growth pressure, resource endowment, and financial development level all contribute to heterogeneous manifestations of how carbon emission reduction targets affect urban green total factor productivity through spillover and crowding-out effects. The conclusions of this study have theoretical and practical significance. These findings not only enhance our understanding of the complex impact of China's carbon intensity target management on urban green development but also offer practical insights for local governments to refine the design of emission reduction policies.
表1 变量描述性统计Table1 Descriptive statistics of variables (N=2750) |
| 变量 | 均值 | 标准差 | 最小值 | 最大值 |
|---|---|---|---|---|
| GTFP | 0.140 | 0.189 | 0.015 | 1.333 |
| Policy | 0.747 | 0.543 | 0.095 | 5.404 |
| Pgdp | 10.723 | 0.564 | 8.758 | 12.594 |
| Pop | 5.758 | 0.908 | 1.808 | 9.086 |
| Open | 1.974 | 2.097 | 0.007 | 9.179 |
| Indus | 1.025 | 0.579 | 0.175 | 5.331 |
| Finance | 1.022 | 0.608 | 0.118 | 6.023 |
| Consume | 0.387 | 0.109 | 0.026 | 1.012 |
| Human | 1.519 | 2.079 | 0.047 | 11.076 |
| Tanspor | 3.445 | 0.484 | 0.798 | 5.159 |
| Labor | 3.630 | 0.865 | 1.631 | 7.042 |
| Capital | 18.342 | 0.826 | 15.691 | 21.018 |
| Land | 4.556 | 0.858 | 1.792 | 8.072 |
| Energy | 4.367 | 1.190 | 0.105 | 7.430 |
| Rgdp | 7.498 | 0.935 | 4.899 | 11.023 |
| PM2.5 | 3.671 | 0.339 | 2.609 | 4.690 |
表2 基准回归结果Table 2 Benchmark regression results |
| 变量 | (1) | (2) | (3) | (4) | (5) |
|---|---|---|---|---|---|
| GTFP | GTFP | GTFP | GTFP | GTFP | |
| Policy | 0.019*** | ||||
| (3.615) | |||||
| Pgdp | 0.016*** | 0.013*** | 0.011*** | 0.013*** | 0.013*** |
| (2.822) | (6.924) | (6.091) | (7.264) | (7.303) | |
| Pop | 0.014** | 0.006*** | 0.006*** | 0.006*** | 0.006** |
| (2.194) | (3.012) | (2.648) | (2.715) | (2.569) | |
| Open | 0.937*** | 0.195*** | 0.202*** | 0.191*** | 0.190*** |
| (3.716) | (3.756) | (4.057) | (3.764) | (3.711) | |
| Indus | 0.079*** | 0.008*** | 0.010*** | 0.009*** | 0.012*** |
| (4.886) | (3.788) | (4.014) | (4.302) | (4.076) | |
| Finance | 0.100*** | 0.036*** | 0.034*** | 0.037*** | 0.037*** |
| (6.105) | (10.911) | (10.353) | (12.418) | (12.394) | |
| Consume | 0.425*** | 0.084*** | 0.085*** | 0.083*** | 0.083*** |
| (11.095) | (8.793) | (9.135) | (8.891) | (8.853) | |
| Human | 0.298 | 0.526*** | 0.558*** | 0.533*** | 0.530*** |
| (1.146) | (9.486) | (10.351) | (9.304) | (9.146) | |
| Tanspor | -0.031** | -0.003 | -0.003 | -0.005*** | -0.005*** |
| (-2.349) | (-0.809) | (-0.781) | (-6.125) | (-6.166) | |
| 时间效应 | Y | N | Y | N | Y |
| 地区效应 | Y | N | N | Y | Y |
| 随机误差:σv | |||||
| cons | -5.262*** | -5.343*** | -5.212*** | -5.190*** | |
| (-12.300) | (-11.796) | (-14.013) | (-14.654) | ||
| 挤出效应:σu | |||||
| Policy | 2.387*** | 2.384*** | 2.474*** | 2.475*** | |
| (6.297) | (6.118) | (6.247) | (6.208) | ||
| 溢出效应:σw | |||||
| Policy | 4.053*** | 4.066*** | 4.047*** | 4.044*** | |
| (6.683) | (6.365) | (6.413) | (6.015) | ||
| Log likelihood | 3331.962 | 3339.427 | 3466.217 | 3566.552 | |
| LR(χ2) | 93.487 | 1268.382 | 1377.389 | ||
| P-value | 0.000 | 0.000 | 0.000 | ||
| N/个 | 2750 | 2750 | 2750 | 2750 | 2750 |
注:表中括号内为t值,**、***分别表示回归结果在5%、1%的水平上显著。下同。 |
表3 双边效应的方差分解Table 3 Variance decomposition of bilateral effects |
| 变量 | 变量含义 | 符号 | 系数值 |
|---|---|---|---|
| 双边 效应 | 随机误差项 | σv | 0.005 |
| 溢出效应 | σw | 0.092 | |
| 挤出效应 | σu | 0.017 | |
| 方差 分解 | 随机项总方差 | σv2+σu2+σw2 | 0.009 |
| 总方差中双边效应的影响比例 | (σu2+σw2)/(σv2+σu2+σw2) | 0.997 | |
| 溢出效应的影响比例 | σw2/(σu2+σw2) | 0.968 | |
| 挤出效应的影响比例 | σu2/(σu2+σw2) | 0.032 |
表4 偏离程度估计Table 4 Estimation of deviation (%) |
| 变量 | (1) 平均值 | (2) 标准差 | (3) 25百分位 | (4) 50百分位 | (5) 75百分位 |
|---|---|---|---|---|---|
| 溢出效应 | 6.468 | 7.169 | 2.272 | 4.462 | 7.918 |
| 挤出效应 | 1.655 | 1.345 | 1.126 | 1.237 | 1.564 |
| 净效应 | 4.814 | 7.372 | 0.918 | 3.166 | 6.628 |
表5 稳健性检验Table 5 Robustness tests |
| 变量 | (1) | (2) | (3) | (4) | (5) | (6) | (7) |
|---|---|---|---|---|---|---|---|
| 挤出效应:σu | |||||||
| Policy | 2.261*** | 2.401*** | 2.210*** | 2.383*** | 2.359*** | 2.468*** | 2.320*** |
| (5.385) | (8.932) | (5.041) | (7.703) | (6.080) | (8.217) | (7.675) | |
| 溢出效应:σw | |||||||
| Policy | 4.228*** | 4.045*** | 4.017*** | 4.373*** | 4.234*** | 4.183*** | 4.140*** |
| (5.029) | (6.005) | (6.087) | (7.511) | (7.527) | (6.595) | (6.507) | |
| 方差分解 | |||||||
| 随机误差项 | 0.009 | 0.005 | 0.016 | 0.012 | 0.004 | 0.006 | 0.013 |
| 溢出效应 | 0.105 | 0.091 | 0.109 | 0.096 | 0.093 | 0.092 | 0.099 |
| 挤出效应 | 0.010 | 0.017 | 0.013 | 0.013 | 0.018 | 0.017 | 0.013 |
| 随机项总方差 | 0.011 | 0.009 | 0.012 | 0.009 | 0.009 | 0.009 | 0.010 |
| 总方差中双边效应的影响比例 | 0.993 | 0.997 | 0.980 | 0.986 | 0.999 | 0.996 | 0.983 |
| 溢出效应的影响比例 | 0.991 | 0.967 | 0.986 | 0.981 | 0.964 | 0.967 | 0.983 |
| 挤出效应的影响比例 | 0.009 | 0.032 | 0.015 | 0.019 | 0.036 | 0.033 | 0.017 |
| 偏离程度估计 | |||||||
| 溢出效应 | 8.843 | 7.706 | 9.082 | 8.029 | 7.839 | 7.738 | 8.339 |
| 挤出效应 | 0.990 | 1.654 | 1.308 | 1.316 | 1.763 | 1.622 | 1.267 |
| 净效应 | 7.853 | 6.051 | 7.774 | 6.713 | 6.076 | 6.115 | 7.072 |
| EEnergy | 0.883*** | — | — | — | — | — | — |
| (9.055) | — | — | — | — | — | — | |
| SO2 | 0.356*** | — | — | — | — | — | — |
| (3.370) | — | — | — | — | — | — | |
| COD | 0.655*** | — | — | — | — | — | — |
| (5.100) | — | — | — | — | — | — | |
| NH3-N | 0.717*** | — | — | — | — | — | — |
| (5.287) | — | — | — | — | — | — | |
| NOX | 0.371*** | — | — | — | — | — | — |
| (8.685) | — | — | — | — | — | — | |
| 控制变量 | Y | Y | Y | Y | Y | Y | Y |
| 时间效应 | Y | Y | Y | Y | Y | Y | Y |
| 地区效应 | Y | Y | Y | Y | Y | Y | Y |
| 城市×年份 | N | N | N | N | N | N | Y |
| 地区×年份 | N | N | N | N | N | N | Y |
| Log likelihood | 2907.658 | 3346.028 | 2869.764 | 3244.431 | 3282.444 | 3362.561 | 3151.939 |
| N/个 | 2750 | 3575 | 2750 | 2750 | 2750 | 2750 | 2750 |
表6 内生性检验Table 6 Endogeneity test |
| 变量 | (1) | (2) |
|---|---|---|
| Policy | GTFP | |
| iv | 0.486*** | |
| (7.582) | ||
| Policy | 0.065*** | |
| (7.406) | ||
| 控制变量 | Y | Y |
| Cons | 4.325*** | -0.349*** |
| (18.156) | (-3.010) | |
| N/个 | 2750 | 2750 |
| R2 | 0.595 | 0.310 |
| F值 | 41.298 |
表7 双边效应的年度分布特征Table 7 Annual distribution characteristics of bilateral effects (%) |
| 年份 | 溢出效应 | 挤出效应 |
|---|---|---|
| 2011 | 8.337 | 1.553 |
| 2012 | 7.655 | 1.676 |
| 2013 | 6.821 | 1.646 |
| 2014 | 6.087 | 1.599 |
| 2015 | 5.961 | 1.602 |
| 2016 | 5.294 | 1.722 |
| 2017 | 5.328 | 1.666 |
| 2018 | 5.645 | 1.734 |
| 2019 | 6.325 | 1.689 |
| 2020 | 7.231 | 1.659 |
表8 双边效应的地区分布特征Table 8 Regional distribution characteristics of bilateral effects (%) |
| 地区 | 溢出效应 | 挤出效应 | 地区 | 溢出效应 | 挤出效应 | 地区 | 溢出效应 | 挤出效应 |
|---|---|---|---|---|---|---|---|---|
| 北京 | 13.221 | 1.190 | 山西 | 10.892 | 2.179 | 内蒙古 | 12.160 | 2.393 |
| 天津 | 10.625 | 1.215 | 吉林 | 6.017 | 1.402 | 广西 | 5.172 | 1.311 |
| 河北 | 12.325 | 1.501 | 黑龙江 | 8.652 | 1.311 | 重庆 | 11.862 | 1.253 |
| 辽宁 | 4.331 | 1.452 | 安徽 | 5.899 | 1.605 | 四川 | 4.713 | 2.066 |
| 上海 | 13.904 | 1.193 | 江西 | 3.821 | 1.216 | 贵州 | 9.977 | 1.235 |
| 江苏 | 4.485 | 1.228 | 河南 | 4.471 | 1.827 | 云南 | 5.563 | 1.388 |
| 浙江 | 3.881 | 1.271 | 湖北 | 6.963 | 1.205 | 陕西 | 9.731 | 2.085 |
| 福建 | 3.163 | 1.315 | 湖南 | 3.339 | 1.201 | 甘肃 | 6.628 | 1.462 |
| 山东 | 6.475 | 1.817 | 青海 | 9.366 | 1.407 | |||
| 广东 | 6.387 | 2.808 | 宁夏 | 9.497 | 1.291 | |||
| 海南 | 9.245 | 1.301 | ||||||
| 东部 | 6.214 | 1.734 | 中部 | 6.063 | 1.513 | 西部 | 7.269 | 1.726 |
表9 地区特征因素与双边效应Table 9 Regional characteristic factors and bilateral effects (%) |
| 效应分解 | 分组 | (1) | (2) | (3) | (4) | (5) |
|---|---|---|---|---|---|---|
| EGP1 | EGP2 | EGP3 | INRD | FIN | ||
| 溢出效应 | 0~25 | 8.002 | 7.983 | 7.927 | 7.446 | 5.181 |
| 挤出效应 | 1.512 | 1.518 | 1.542 | 1.531 | 1.771 | |
| 净效应 | 6.490 | 6.465 | 6.385 | 5.915 | 3.410 | |
| 溢出效应 | 25~50 | 6.787 | 6.838 | 6.803 | 6.681 | 5.582 |
| 挤出效应 | 1.582 | 1.579 | 1.602 | 1.608 | 1.702 | |
| 净效应 | 5.205 | 5.259 | 5.201 | 5.073 | 3.880 | |
| 溢出效应 | 50~75 | 5.792 | 5.721 | 6.016 | 6.093 | 6.847 |
| 挤出效应 | 1.679 | 1.712 | 1.689 | 1.688 | 1.594 | |
| 净效应 | 4.113 | 4.009 | 4.327 | 4.405 | 5.253 | |
| 溢出效应 | 75~100 | 5.292 | 5.331 | 5.127 | 5.653 | 8.263 |
| 挤出效应 | 1.845 | 1.809 | 1.786 | 1.792 | 1.552 | |
| 净效应 | 3.447 | 3.522 | 3.341 | 3.861 | 6.711 |
| [1] |
|
| [2] |
张杰, 范雨婷. 创新型城市绿色发展: 效率测算、外部性与提升路径. 中国人口·资源与环境, 2023, 33(2): 102-112.
[
|
| [3] |
|
| [4] |
|
| [5] |
|
| [6] |
魏丽莉, 侯宇琦. 数字经济对中国城市绿色发展的影响作用研究. 数量经济技术经济研究, 2022, 39(8): 60-79.
[
|
| [7] |
|
| [8] |
李鹏升, 陈艳莹. 环境规制、企业议价能力和绿色全要素生产率. 财贸经济, 2019, 40(11): 144-160.
[
|
| [9] |
赵明亮, 冯健康, 孙威. 环境规制影响资源型城市绿色全要素生产率的途径与政策建议. 自然资源学报, 2023, 38(1): 186-204.
[
|
| [10] |
高红贵, 许莹莹, 朱于珂. 命令控制型环境规制对碳市场价格的影响: 来自中央环保督察的准自然实验. 中国地质大学学报: 社会科学版, 2022, 22(3): 54-66.
[
|
| [11] |
王建民, 杨文培, 杨力. 双赢目标约束下中国能源结构调整测算. 中国人口·资源与环境, 2016, 26(3): 27-36.
[
|
| [12] |
周鹏, 高朱红, 闻雯. 政府补贴、碳减排目标约束与工业企业低碳策略选择. 北京理工大学学报: 社会科学版, 2022, 24(4): 118-128.
[
|
| [13] |
李锴, 齐绍洲. 碳减排政策与工业结构低碳升级. 暨南学报: 哲学社会科学版, 2020, 42(12): 102-116.
[
|
| [14] |
杨洋, 张倩倩. 碳减排绝对量约束目标下京津冀低碳经济发展路径分析. 软科学, 2015, 29(11): 105-109.
[
|
| [15] |
赵泽斌, 李映洁, 生世玉, 等. 区域碳减排政策协同的演化轨迹与影响因素: 基于网络分析视角. 公共管理与政策评论, 2024, 13(6): 20-33.
[
|
| [16] |
|
| [17] |
刘颖, 吕明俐, 刘双丰. 碳交易政策对高碳产业绿色全要素生产率的影响研究. 经济纵横, 2024, (7): 56-66.
[
|
| [18] |
|
| [19] |
徐妍, 郑冠群, 沈悦. 地方政府环境治理目标约束强度与绿色经济效率. 中国经济问题, 2022, (6): 165-177.
[
|
| [20] |
|
| [21] |
张卫东, 汪海. 我国环境政策对经济增长与环境污染关系的影响研究. 中国软科学, 2007, (12): 32-38.
[
|
| [22] |
|
| [23] |
夏建红, 刘松, 丁晨峰, 等. 环境规制与绿色全要素生产率: 促进还是抑制?. 经济问题, 2024, (4): 60-67.
[
|
| [24] |
孙英杰, 林春. 试论环境规制与中国经济增长质量提升: 基于环境库兹涅茨倒U型曲线. 上海经济研究, 2018, 30(3): 84-94.
[
|
| [25] |
张同斌. 提高环境规制强度能否“利当前” 并“惠长远”. 财贸经济, 2017, 38(3): 116-130.
[
|
| [26] |
张哲, 白雪洁. 经济增长压力下“能耗双控” 政策会加剧绿色全要素生产率南北分化吗?. 南方经济, 2024, (5): 12-29, 94.
[
|
| [27] |
|
| [28] |
|
| [29] |
|
| [30] |
|
| [31] |
|
| [32] |
|
| [33] |
贾俊雪, 罗理恒, 顾嘉. 地方政府环境规制与经济高质量发展. 中国工业经济, 2023, (5): 99-117.
[
|
| [34] |
易兰, 杨田恬, 杜兴, 等. 减污降碳协同路径研究: 典型国家驱动机制及对中国的启示. 中国人口·资源与环境, 2022, 32(9): 53-65.
[
|
| [35] |
严成樑, 赵扶扬, 牛欢. 环境目标责任制、环境治理与内生经济增长. 经济研究, 2024, 59(4): 133-152.
[
|
| [36] |
杜龙政, 赵云辉, 陶克涛, 等. 环境规制、治理转型对绿色竞争力提升的复合效应: 基于中国工业的经验证据. 经济研究, 2019, 54(10): 106-120.
[
|
| [37] |
余泳泽, 林彬彬. 偏向性减排目标约束与技术创新: “中国式波特假说” 的检验. 数量经济技术经济研究, 2022, 39(11): 113-135.
[
|
| [38] |
余泳泽, 尹立平. 中国式环境规制政策演进及其经济效应: 综述与展望. 改革, 2022, (3): 114-130.
[
|
| [39] |
许东彦, 林婷, 张国建. 环境规制对绿色技术扩散的影响. 中南财经政法大学学报, 2022, (5): 147-160.
[
|
| [40] |
|
| [41] |
王杰, 李治国. 环境规制策略互动与绿色创新: 来自市场型与命令型环境规制的证据. 统计研究, 2023, 40(12): 26-38.
[
|
| [42] |
|
| [43] |
毛奕欢, 林雁, 谭洪涛. 经济增长目标、官员压力与企业绿色创新. 中南财经政法大学学报, 2022, (3): 113-125.
[
|
| [44] |
|
| [45] |
马艺菲, 陈昕昀, 雷晓英, 等. 地方政府竞争对绿色全要素生产率的影响: 经济—环境综合竞争和转变效应. 自然资源学报, 2025, 40(2): 459-477.
[
|
| [46] |
史丹, 李少林. 排污权交易制度与能源利用效率: 对地级及以上城市的测度与实证. 中国工业经济, 2020, (9): 5-23.
[
|
| [47] |
戴其文, 郭忠媛, 赖璇宇, 等. 绿色金融政策对企业绿色发展的影响机制. 自然资源学报, 2025, 40(3): 667-691.
[
|
| [48] |
|
| [49] |
刘书畅, 叶艳妹, 李林林, 等. 基于随机前沿分析的中国城镇建设用地利用效率研究. 自然资源学报, 2021, 36(5): 1268-1281.
[
|
| [50] |
匡远凤, 彭代彦. 中国环境生产效率与环境全要素生产率分析. 经济研究, 2012, 47(7): 62-74.
[
|
| [51] |
李双燕, 谈笑, 斯宏浩. 普惠金融与绿色全要素生产率: 基于R&D投入视角. 当代经济科学, 2021, 43(6): 77-88.
[
|
| [52] |
|
| [53] |
刘春艳, 徐俊, 赵军. 对外直接投资对工业绿色转型的双重效应: 基于双边随机前沿模型的分析. 中国人口·资源与环境, 2024, 34(4): 126-137.
[
|
| [54] |
|
| [55] |
余泳泽, 孙鹏博, 宣烨. 地方政府环境目标约束是否影响了产业转型升级?. 经济研究, 2020, 55(8): 57-72.
[
|
| [56] |
|
| [57] |
|
/
| 〈 |
|
〉 |