
县域城乡融合发展的演变特征、区域差异及影响因素研究——以武陵山区64个县为例
|
朱小会(1981-),女,重庆人,博士,副教授,硕士生导师,研究方向为生态经济理论与方法。E-mail: 2018007@cqust.edu.cn |
收稿日期: 2024-07-11
修回日期: 2024-11-05
网络出版日期: 2025-04-16
基金资助
重庆市社会科学规划年度项目(2024NDYB046)
教育部人文社会科学研究青年项目(20YJC790128)
Evolution characteristics, regional differences and influencing factors of urban-rural integrated development at the county scale:Take 64 counties in Wuling Mountain Area as examples
Received date: 2024-07-11
Revised date: 2024-11-05
Online published: 2025-04-16
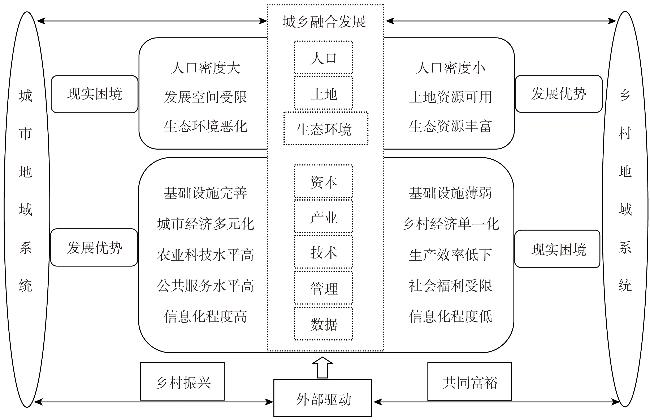
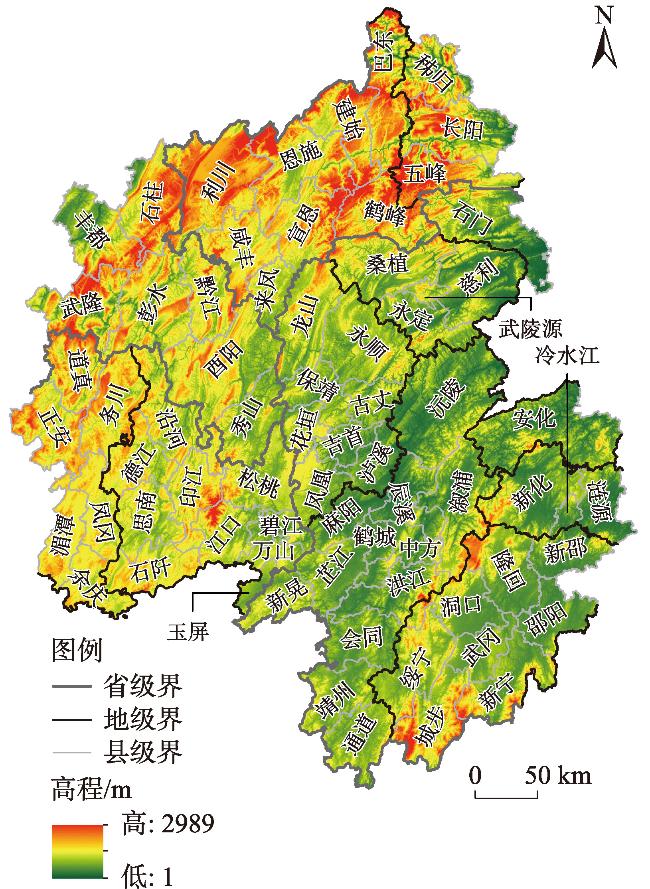
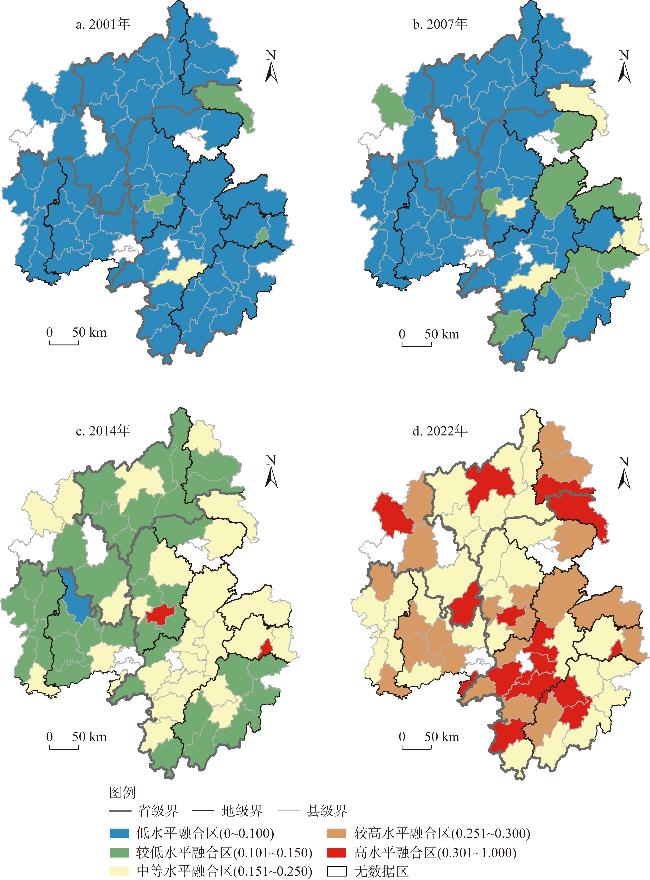
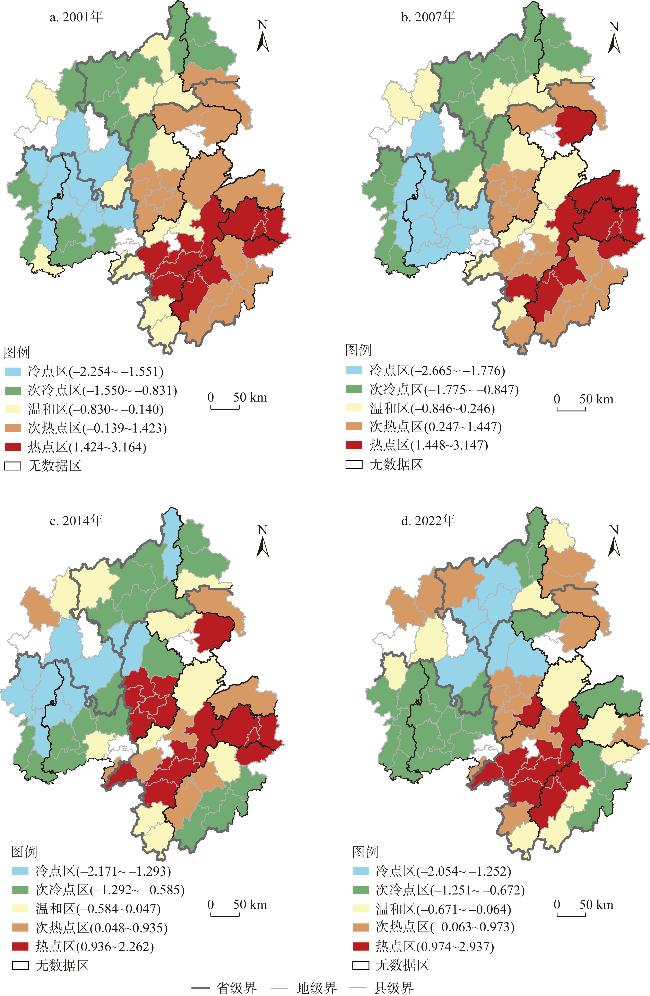
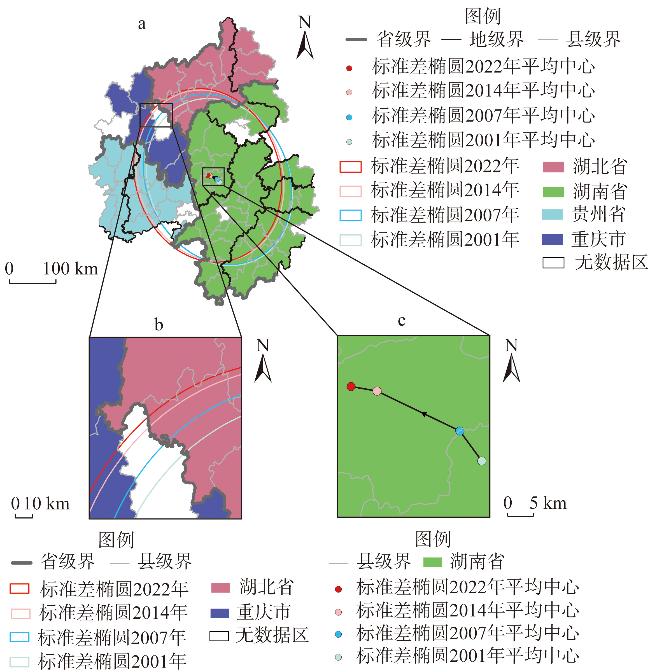
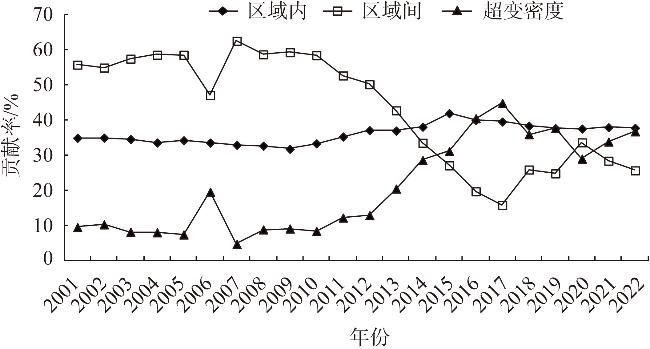
城乡发展不平衡是中国经济社会发展存在的突出矛盾,要从根本上解决这个矛盾,必须走城乡融合发展道路。县域是城乡融合发展的关键支撑,精准把握县域城乡融合多维时空特征,厘清要素流动影响城乡融合发展的作用机理,对丰富新时代共同富裕理论体系意义非凡。基于流空间理论,解析要素流动对城乡融合发展的理论机制,从人口、土地、生态环境、资本、产业、技术、管理及数据8种要素层面构建适用于县域尺度的城乡融合发展评价指标体系,对武陵山区64个县域进行实证分析。研究结果显示:(1)样本期内,武陵山区城乡融合发展水平呈不断上升趋势。(2)武陵山区低水平城乡融合区不断减少,高水平城乡融合区不断增加,总体呈现“南部热西部冷”的空间分布特征,标准差椭圆呈现从东南方向往西北方向移动的趋势。(3)财政分权、产业结构对城乡融合发展具有显著抑制作用,财政支出、金融效率对城乡融合发展具有显著促进作用。各因素对城乡融合发展的作用因海拔高度、是否是少数民族自治县而具有异质性。需从重视城乡融合发展的时空特征、充分利用资源禀赋和区位优势以实现差异化发展、关注影响城乡融合发展的具体因素等方面着手,实现城乡融合高质量发展。研究结果可为城乡融合发展在山区县域落地提供科学依据。
朱小会 , 于法稳 . 县域城乡融合发展的演变特征、区域差异及影响因素研究——以武陵山区64个县为例[J]. 自然资源学报, 2025 , 40(5) : 1386 -1411 . DOI: 10.31497/zrzyxb.20250515
The imbalance between urban and rural development is a prominent contradiction in China's economic and social development. To fundamentally resolve this problem, it is necessary to take the path of urban-rural integrated development. The county is a crucial support for urban-rural integration. Accurately grasping the multidimensional spatiotemporal characteristics of urban-rural integration within the county domain and clarifying the mechanism by which element flow impacts urban-rural integrated development is of great significance for enriching the theoretical system of common prosperity in the New Era. Based on flow space theory, this study analyzed the theoretical mechanism of element flow on urban-rural integrated development and constructed an evaluation index system for integration at the county scale from eight elements: population, land, ecological environment, capital, industry, technology, management, and data. An empirical analysis was conducted on 64 counties in the Wuling Mountain Area, Central China. The research results showed that: (1) During the sample period, the level of urban-rural integrated development in the study area showed a continuous upward trend. (2) The number of low-level urban-rural integrated areas in this region was decreasing, while that of high-level areas was increasing, generally presenting a spatial distribution pattern of "hotspots in the south, and coldspots in the west," with the standard deviation ellipse showing a trend of moving from southeast to northwest. (3) The overall disparity in the level of urban-rural integrated development was decreasing, with intra-regional differences being the main source. (4) Fiscal decentralization and industrial structure had significant inhibitory effects on the integration of urban and rural areas, while fiscal expenditure and financial efficiency had significant promoting effects on the integrated development. The impact of these factors on urban-rural integration varied depending on altitude and whether the area was an ethnic minority autonomous county. To achieve high-quality urban-rural integrated development, it was necessary to focus on the spatial and temporal characteristics of urban-rural integration development, make full use of resource endowments and locational advantages to achieve differentiated development, and pay attention to specific factors affecting urban-rural integration. The research results can provide a scientific basis for the implementation of urban-rural integrated development in mountainous county regions.
表1 武陵山区县域尺度城乡融合发展评价指标体系Table 1 Evaluation index system for urban-rural integrated development at the county scale in Wuling Mountain Area |
| 准则层 | 一级指标 | 二级指标 | 属性 |
|---|---|---|---|
| 人口(0.122) | 人口状况 | 人口密度/(人/km2)(0.344) | 正 |
| 收入水平 | 城镇居民家庭人均可支配收入/农村居民家庭人均可支配收入/%(0.007) | 逆 | |
| 财富状况 | 城乡居民人均储蓄存款余额/(元/人)(0.649) | 正 | |
| 土地(0.295) | 空间融合 | 建成区面积占比变化率/%(0.217) | 正 |
| 耕地利用 | 农村人均机收面积/(hm2/万人)(0.646) | 正 | |
| 交通通达性 | 公路总里程数/行政区总面积/(km/km2)(0.137) | 正 | |
| 生态环境(0.036) | 生态条件 | 森林覆盖率/%(0.926) | 正 |
| 单位GDP能耗下降 | (本年单位GDP能耗/上年单位GDP能耗-1)×100%/%(0.016) | 逆 | |
| 污染状况 | 亩均(1亩≈667 m2)化肥施用量/t(0.058) | 逆 | |
| 资本(0.193) | 投资结构 | 人均固定资产投资/(万元/人)(0.591) | 正 |
| 经济水平 | 人均GDP/(元/人)(0.409) | 正 | |
| 产业(0.055) | 产业发展 | 二三产业增加值/一产业增加值/%(0.298) | 正 |
| 二元生产效率 | (一产业增加值/一产业从业人员数)/(二三产业增加值/二三产业从业人员数)/%(0.618) | 正 | |
| 农村就业结构 | 农村非农就业率/%(0.084) | 正 | |
| 技术(0.166) | 通讯技术 | 固定电话用户数/户(0.537) | 正 |
| 农业现代化 | 亩均农用机械总动力/(kW/hm2)(0.463) | 正 | |
| 管理(0.133) | 教育水平 | 基础教育师生比/%(0.361) | 正 |
| 医疗条件 | 每万人医疗床位数/张(0.639) | 正 | |
| 数据 | 信息化程度 | 城乡互联网接入用户数量比/%* | 逆 |
| 数据流动性 | 城乡信息联系强度/人次* | 正 |
注:受制于县域尺度城乡分类统计数据不完善,*表示县域尺度该项指标数据缺乏,故本文未纳入实证分析,圆括号内值表示各项指标权重。 |
表2 武陵山区县域尺度城乡融合发展水平Table 2 The urban-rural integrated development level at the county scale in Wuling Mountain Area |
| 年份 | 最大值 | ||||
|---|---|---|---|---|---|
| 研究区 | 贵州武陵山区 | 湖北武陵山区 | 湖南武陵山区 | 重庆武陵山区 | |
| 2001 | 洪江市0.230 | 湄潭县0.056 | 鹤峰县0.078 | 洪江市0.230 | 丰都县0.055 |
| 2007 | 冷水江市0.193 | 湄潭县0.079 | 恩施市0.093 | 冷水江市0.193 | 丰都县0.102 |
| 2014 | 吉首市0.332 | 玉屏侗族自治县 0.220 | 恩施市0.190 | 吉首市0.332 | 丰都县0.190 |
| 2022 | 吉首市0.454 | 玉屏侗族自治县0.356 | 恩施市0.352 | 吉首市0.454 | 秀山土家族苗族 自治县0.367 |
| 年份 | 最小值 | ||||
| 研究区 | 贵州武陵山区 | 湖北武陵山区 | 湖南武陵山区 | 重庆武陵山区 | |
| 2001 | 德江县0.022 | 德江县0.022 | 宣恩县0.026 | 中方县0.039 | 彭水苗族土家族 自治县0.033 |
| 2007 | 德江县0.043 | 德江县0.043 | 建始县0.046 | 凤凰县0.068 | 酉阳土家族苗族 自治县0.064 |
| 2014 | 沿河土家族 自治县0.102 | 沿河土家族 自治县0.102 | 建始县0.114 | 保靖县0.123 | 酉阳土家族苗族 自治县0.125 |
| 2022 | 建始县0.199 | 沿河土家族 自治县0.224 | 建始县0.199 | 隆回县0.204 | 酉阳土家族苗族 自治县0.232 |
| 年份 | 平均值 | ||||
| 研究区 | 贵州武陵山区 | 湖北武陵山区 | 湖南武陵山区 | 重庆武陵山区 | |
| 2001 | 0.055 | 0.039 | 0.040 | 0.069 | 0.041 |
| 2007 | 0.088 | 0.060 | 0.067 | 0.099 | 0.082 |
| 2014 | 0.155 | 0.141 | 0.139 | 0.160 | 0.155 |
| 2022 | 0.275 | 0.260 | 0.254 | 0.284 | 0.304 |
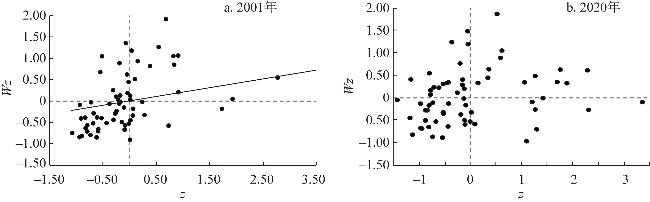
表3 武陵山区城乡融合发展水平Moran指数Table 3 Moran's I of urban-rural integrated development level in Wuling Mountain Area |
| 年份 | 2001 | 2003 | 2005 | 2007 | 2009 | 2011 | 2013 | 2015 | 2017 | 2020 | 2021 | 2022 |
|---|---|---|---|---|---|---|---|---|---|---|---|---|
| Moran's I | 0.205 | 0.253 | 0.267 | 0.337 | 0.302 | 0.171 | 0.045 | 0.006 | 0.083 | 0.139 | 0.092 | 0.080 |
| P值 | 0.017 | 0.008 | 0.006 | 0.001 | 0.004 | 0.034 | 0.066 | 0.685 | 0.050 | 0.060 | 0.118 | 0.148 |
表4 武陵山区城乡融合发展水平基尼系数及四省(直辖市)分解结果Table 4 Gini coefficient and decomposition results of urban-rural integrated development level in Wuling Mountain Area of four provincial-level regions |
| 年份 | 整体基尼系数 | 区域内基尼系数 | 区域间基尼系数 | |||||||||
|---|---|---|---|---|---|---|---|---|---|---|---|---|
| 贵州 | 湖北 | 湖南 | 重庆 | 贵州—湖北 | 贵州— 湖南 | 贵州— 重庆 | 湖北— 湖南 | 湖北— 重庆 | 湖南— 重庆 | |||
| 2001 | 0.245 | 0.154 | 0.193 | 0.214 | 0.109 | 0.175 | 0.240 | 0.144 | 0.243 | 0.173 | 0.222 | |
| 2002 | 0.223 | 0.145 | 0.176 | 0.198 | 0.114 | 0.161 | 0.223 | 0.140 | 0.221 | 0.162 | 0.203 | |
| 2003 | 0.222 | 0.134 | 0.157 | 0.196 | 0.108 | 0.148 | 0.225 | 0.138 | 0.219 | 0.150 | 0.197 | |
| 2004 | 0.209 | 0.132 | 0.149 | 0.180 | 0.108 | 0.144 | 0.214 | 0.144 | 0.202 | 0.148 | 0.180 | |
| 2005 | 0.196 | 0.106 | 0.127 | 0.177 | 0.094 | 0.119 | 0.201 | 0.120 | 0.197 | 0.133 | 0.174 | |
| 2006 | 0.221 | 0.112 | 0.256 | 0.191 | 0.092 | 0.192 | 0.212 | 0.123 | 0.226 | 0.223 | 0.187 | |
| 2007 | 0.199 | 0.104 | 0.118 | 0.172 | 0.076 | 0.115 | 0.208 | 0.126 | 0.191 | 0.119 | 0.169 | |
| 2008 | 0.186 | 0.124 | 0.140 | 0.158 | 0.078 | 0.144 | 0.197 | 0.140 | 0.172 | 0.129 | 0.155 | |
| 2009 | 0.177 | 0.126 | 0.103 | 0.147 | 0.089 | 0.124 | 0.186 | 0.154 | 0.162 | 0.122 | 0.143 | |
| 2010 | 0.163 | 0.096 | 0.114 | 0.145 | 0.062 | 0.114 | 0.174 | 0.120 | 0.154 | 0.109 | 0.139 | |
| 2011 | 0.145 | 0.090 | 0.098 | 0.140 | 0.072 | 0.095 | 0.153 | 0.104 | 0.146 | 0.103 | 0.134 | |
| 2012 | 0.140 | 0.081 | 0.074 | 0.146 | 0.073 | 0.081 | 0.152 | 0.091 | 0.144 | 0.081 | 0.141 | |
| 2013 | 0.130 | 0.096 | 0.086 | 0.134 | 0.071 | 0.093 | 0.136 | 0.099 | 0.136 | 0.094 | 0.128 | |
| 2014 | 0.123 | 0.106 | 0.084 | 0.130 | 0.086 | 0.097 | 0.130 | 0.106 | 0.126 | 0.092 | 0.126 | |
| 2015 | 0.136 | 0.094 | 0.072 | 0.168 | 0.088 | 0.086 | 0.152 | 0.097 | 0.149 | 0.081 | 0.160 | |
| 2016 | 0.117 | 0.097 | 0.082 | 0.135 | 0.069 | 0.092 | 0.125 | 0.093 | 0.126 | 0.084 | 0.128 | |
| 2017 | 0.112 | 0.076 | 0.086 | 0.131 | 0.083 | 0.082 | 0.117 | 0.085 | 0.122 | 0.092 | 0.127 | |
| 2018 | 0.117 | 0.080 | 0.069 | 0.136 | 0.081 | 0.076 | 0.122 | 0.101 | 0.123 | 0.099 | 0.135 | |
| 2019 | 0.112 | 0.069 | 0.100 | 0.125 | 0.076 | 0.084 | 0.111 | 0.090 | 0.121 | 0.111 | 0.125 | |
| 2020 | 0.111 | 0.060 | 0.091 | 0.120 | 0.090 | 0.076 | 0.111 | 0.079 | 0.121 | 0.103 | 0.118 | |
| 2021 | 0.113 | 0.056 | 0.104 | 0.125 | 0.085 | 0.083 | 0.111 | 0.077 | 0.125 | 0.110 | 0.122 | |
| 2022 | 0.112 | 0.055 | 0.103 | 0.125 | 0.086 | 0.085 | 0.110 | 0.079 | 0.124 | 0.112 | 0.122 | |
| 均值 | 0.160 | 0.100 | 0.117 | 0.154 | 0.086 | 0.112 | 0.164 | 0.111 | 0.161 | 0.120 | 0.152 | |
表5 变量描述性统计值Table 5 Descriptive statistics of variables |
| 变量 | 平均值 | 标准差 | 最小值 | 最大值 | 样本量/个 |
|---|---|---|---|---|---|
| Uri | 0.14 | 0.08 | 0.02 | 0.62 | 1408 |
| Fd | -1.68 | 0.45 | -2.91 | 0.26 | 1408 |
| Fe | 3.22 | 0.50 | 1.71 | 4.42 | 1408 |
| Fin | -0.27 | 0.45 | -1.85 | 1.51 | 1408 |
| Urb | 3.12 | 0.68 | -0.11 | 4.36 | 1408 |
| Ind | 0.36 | 0.53 | -1.36 | 1.77 | 1408 |
| Hei | 0.41 | 0.49 | 0 | 1.00 | 1408 |
| Min | 0.53 | 0.50 | 0 | 1.00 | 1408 |
表6 县域城乡融合发展影响因素分析模型估计结果Table 6 Estimation results of the analysis model for influencing factors of urban-rural integrated development at the county scale |
| 变量 | ① 武陵山区 | ② 贵州武陵山区 | ③ 湖北武陵山区 | ④ 湖南武陵山区 | ⑤ 重庆武陵山区 |
|---|---|---|---|---|---|
| Fd | -0.141***(0.012) | -0.403***(0.037) | -0.059**(0.027) | -0.152***(0.016) | 0.020(0.075) |
| Fe | 0.047***(0.007) | 0.235***(0.017) | -0.007(0.014) | 0.078***(0.010) | -0.155***(0.034) |
| Fd×Fe | 0.040***(0.004) | 0.105***(0.010) | 0.016**(0.008) | 0.047***(0.005) | -0.070***(0.023) |
| Fin | 0.008***(0.003) | 0.020***(0.005) | 0.019***(0.004) | -0.002(0.005) | 0.042***(0.007) |
| Urb | 0.001(0.003) | 0.022***(0.005) | 0.006(0.005) | -0.010*(0.005) | 0.000(0.015) |
| Ind | -0.008***(0.002) | 0.013*(0.006) | -0.013***(0.005) | -0.010***(0.004) | 0.011*(0.007) |
| W×Fd | 0.118***(0.018) | 0.223***(0.069) | 0.008(0.041) | 0.141***(0.026) | 0.317***(0.107) |
| W×Fe | -0.017*(0.010) | -0.147***(0.035) | 0.045**(0.019) | -0.017(0.017) | -0.024(0.044) |
| W×Fd×Fe | -0.034***(0.006) | -0.060***(0.019) | -0.003(0.012) | -0.041***(0.009) | -0.085***(0.032) |
| W×Fin | 0.023***(0.004) | 0.026***(0.008) | 0.014**(0.007) | 0.024***(0.007) | 0.057***(0.011) |
| W×Urb | 0.018***(0.004) | 0.020**(0.009) | 0.012*(0.006) | 0.021**(0.007) | 0.126***(0.016) |
| W×Ind | 0.024***(0.003) | -0.032***(0.008) | 0.037***(0.006) | 0.034***(0.006) | 0.036***(0.009) |
| ρ/λ | 0.709***(0.017) | 0.574***(0.049) | 0.702***(0.036) | 0.622***(0.028) | 0.131*(0.079) |
| R2 | 0.802 | 0.872 | 0.850 | 0.778 | 0.968 |
| Hausman检验 | 45.63[0.000] | 64.46[0.000] | 45.95[0.000] | 32.83[0.002] | 15.23[0.000] |
| 模型选择 | 个体固定SDM | 个体固定SDM | 个体固定SDM | 个体固定SDM | 个体固定SDM |
| 变量 | ⑥ 高海拔县 | ⑦ 低高海拔县 | ⑧ 少数民族自治县 | ⑨ 非少数民族自治县 | |
| Fd | -0.038**(0.020) | -0.140***(0.018) | -0.206***(0.016) | -0.178***(0.024) | |
| Fe | 0.016**(0.010) | 0.043***(0.010) | 0.068***(0.009) | 0.090***(0.012) | |
| Fd×Fe | 0.008*(0.006) | 0.040***(0.006) | 0.057***(0.005) | 0.049***(0.007) | |
| Fin | 0.014***(0.003) | 0.018***(0.004) | 0.088***(0.003) | 0.048***(0.006) | |
| Urb | 0.004(0.003) | -0.003(0.006) | -0.004(0.003) | 0.043***(0.006) | |
| Ind | -0.004(0.003) | 0.007(0.004) | -0.005(0.003) | 0.006*(0.004) | |
| W×Fd | 0.041*(0.025) | 0.203***(0.021) | 0.211***(0.025) | ||
| W×Fe | -0.014(0.014) | -0.037**(0.012) | -0.026*(0.013) | ||
| W×Fd×Fe | -0.013**(0.008) | -0.063***(0.007) | -0.056***(0.007) | ||
| W×Fin | 0.013***(0.004) | -0.001(0.006) | 0.020***(0.004) | ||
| W×Urb | 0.017***(0.004) | 0.025***(0.007) | 0.014***(0.004) | ||
| W×Ind | 0.014***(0.004) | 0.020***(0.005) | 0.025***(0.004) | ||
| ρ/λ | 0.703***(0.022) | 0.574***(0.025) | 0.683***(0.022) | 0.627***(0.041) | |
| R2 | 0.833 | 0.720 | 0.811 | 0.631 | |
| Hausman检验 | 28.60[0.008] | 58.24[0.000] | 49.28[0.000] | 12.77[0.076] | |
| 模型选择 | 个体固定SDM | 个体固定SDM | 个体固定SDM | 个体固定SEM |
注:*、**、***分别表示10%、5%、1%显著性水平,圆括号内为回归系数稳健性标准误差,方括号内数字为P值,下同。 |
表7 稳健性检验Table 7 Robustness test |
| 变量 | ① 自变量滞后一期 | ② 地理距离空间权重矩阵 |
|---|---|---|
| Fd | -0.139***(0.026) | -0.128***(0.011) |
| Fe | 0.058***(0.007) | 0.040***(0.006) |
| Fd×Fe | 0.040***(0.004) | 0.038***(0.003) |
| Fin | 0.008***(0.003) | 0.003**(0.002) |
| Urb | 0.001(0.003) | -0.003(0.003) |
| Ind | -0.007***(0.003) | -0.010***(0.002) |
| W×Fd | 0.107***(0.020) | 0.159***(0.023) |
| W×Fe | -0.017(0.011) | 0.039***(0.014) |
| W×Fd×Fe | -0.030***(0.006) | -0.048***(0.007) |
| W×Fin | 0.028***(0.004) | 0.016***(0.005) |
| W×Urb | 0.018***(0.004) | 0.018***(0.005) |
| W×Ind | 0.025***(0.003) | 0.029***(0.005) |
| ρ/λ | 0.673***(0.019) | 0.784***(0.023) |
| R2 | 0.801 | 0.854 |
| Hausman检验 | 43.22[0.000] | 38.79[0.000] |
| 模型选择 | 个体固定SDM | 个体固定SDM |
| [1] |
李俊杰, 梁辉. 民族地区城乡融合发展水平测度及影响因素研究. 中央民族大学学报: 哲学社会科学版, 2022, 49(2): 97-109.
[
|
| [2] |
付金存, 李豫新. 少数民族地区城乡协调发展动态评价: 以新疆为例. 云南民族大学学报: 哲学社会科学版, 2013, 30(1): 93-98.
[
|
| [3] |
陈坤秋, 龙花楼. 中国土地市场对城乡融合发展的影响. 自然资源学报, 2019, 34(2): 221-235.
[
|
| [4] |
杨一鸣, 王健, 吴群. 中国城乡实体要素流动对城乡融合发展的影响机制研究. 地理科学进展, 2022, 41(12): 2191-2202.
[
|
| [5] |
陈瑞莲, 李学. 城乡二元结构理论与国内现实. 天津行政学院学报, 2004, 6(4): 19-23.
[
|
| [6] |
何仁伟. 城乡融合与乡村振兴: 理论探讨、机理阐释与实现路径. 地理研究, 2018, 37(11): 2127-2140.
[
|
| [7] |
|
| [8] |
|
| [9] |
黄小明. 收入差距、农村人力资本深化与城乡融合. 经济学家, 2014, (1): 84-91.
[
|
| [10] |
魏后凯. 深刻把握城乡融合发展的本质内涵. 中国农村经济, 2020, (6): 5-8.
[
|
| [11] |
杨志恒, 吴先华, 于兰军. 城乡融合视野下的城镇化发展研究. 北京: 经济科学出版社, 2018: 215.
[
|
| [12] |
|
| [13] |
|
| [14] |
|
| [15] |
|
| [16] |
杨荣南. 城乡一体化及其评价指标体系初探. 城市研究, 1997, (2): 19-23.
[
|
| [17] |
杨丽, 赵富城. 基于DEA技术的城乡一体化发展效率评价. 经济问题探索, 2010, (6): 8-13.
[
|
| [18] |
吴殿廷, 王丽华, 戎鑫, 等. 我国各地区城乡协调发展的初步评价及预测. 中国软科学, 2007, (10): 111-117, 135.
[
|
| [19] |
张海鹏. 我国生态环境城乡一体化进展与评价. 生态经济, 2014, 30(12): 147-150.
[
|
| [20] |
兰勇, 陈忠祥. 论我国城市化过程中的城乡文化整合. 人文地理, 2006, 21(6): 45-48, 39.
[
|
| [21] |
周德, 钟文钰, 张佳文, 等. 县域城乡融合评价及差异化发展路径: 以浙江山区26县为例. 地理科学, 2023, 43(10): 1803-1814.
[
|
| [22] |
徐姗, 吴青青. 中国城乡融合水平时空分异特征及影响因素分析. 统计与决策, 2023, 39(20): 114-119.
[
|
| [23] |
金成武. 中国城乡融合发展与理论融合: 兼谈当代发展经济学理论的批判借鉴. 经济研究, 2019, 54(8): 183-197.
[
|
| [24] |
周佳宁, 秦富仓, 刘佳, 等. 多维视域下中国城乡融合水平测度、时空演变与影响机制. 中国人口·资源与环境, 2019, 29(9): 166-176.
[
|
| [25] |
舒季君, 周建平, 陈亦婷, 等. 中国省域数字经济的空间演化特征及其城乡融合效应. 经济地理, 2022, 42(8): 103-111.
[
|
| [26] |
孙群力, 周镖. 财政分权、农村金融服务与城乡融合水平: 基于城镇化与乡村振兴视角. 农村经济, 2021, (3): 93-100.
[
|
| [27] |
贺艳华, 谭惠敏, 康富美. 大都市边缘区城乡融合发展模式及效应评价: 以长沙市望城区为例. 经济地理, 2022, 42(5): 156-164.
[
|
| [28] |
卫嫚, 黄泰. 县域城乡融合发展对乡村旅游地实现共同富裕的影响机制: 以长三角地区60个典型县为例. 自然资源学报, 2024, 39(7): 1591-1612.
[
|
| [29] |
张海朋, 何仁伟, 李立娜, 等. 环首都地区城乡融合水平时空分异及乡村振兴路径. 自然资源学报, 2021, 36(10): 2652-2671.
[
|
| [30] |
胡西武, 苏云清, 李毅. 青海省城乡融合时空分异及影响因素研究: 以城乡收入差距为视角. 青海民族大学学报: 社会科学版, 2020, 46(4): 36-45.
[
|
| [31] |
张蔚文, 白粤, 于晨炜. 区域均衡发展视角下滇桂边境城镇发展的路径选择. 城市发展研究, 2018, 25(4): 1-8.
[
|
| [32] |
周佳宁, 邹伟, 秦富仓. 等值化理念下中国城乡融合多维审视及影响因素. 地理研究, 2020, 39(8): 1836-1851.
[
|
| [33] |
戈大专, 龙花楼. 论乡村空间治理与城乡融合发展. 地理学报, 2020, 75(6): 1272-1286.
[
|
| [34] |
蔡秀玲, 陈贵珍. 乡村振兴与城镇化进程中城乡要素双向配置. 社会科学研究, 2018, (6): 51-58.
[
|
| [35] |
梁书民. 新技术变革下的我国城乡融合发展前瞻. 学术前沿, 2021, (7): 126-134.
[
|
| [36] |
高耿子. 从二元分割到城乡融合发展新思路: 中国农村经济高质量发展研究. 现代经济探讨, 2020, (1): 108-116.
[
|
| [37] |
张新林, 赵媛. 基于空间视角的资源流动内涵与构成要素的再思考. 自然资源学报, 2016, 31(10): 1611-1623.
[
|
| [38] |
平卫英, 李文星, 罗良清. 要素流动对城乡融合发展的影响机理与空间分异研究. 统计与信息论坛, 2024, 39(6): 15-31.
[
|
| [39] |
|
| [40] |
罗明忠, 刘子玉. 要素流动视角下新型工农城乡关系构建: 症结与突破. 农林经济管理学报, 2021, 20(1): 10-18.
[
|
| [41] |
郑瑜晗, 龙花楼. 中国城乡融合发展测度评价及其时空格局. 地理学报, 2023, 78(8): 1869-1887.
[
|
| [42] |
王芳, 毛渲. 环境公平视角下的城乡融合发展: 价值审视与路向选择. 农林经济管理学报, 2021, 20(5): 686-692.
[
|
| [43] |
|
| [44] |
周振, 伍振军, 孔祥智. 中国农村资金净流出的机理、规模与趋势: 1978—2012年. 管理世界, 2015, 31(1): 63-74.
[
|
| [45] |
刘合光. 城乡融合发展视域下的乡村产业发展新方向. 学术前沿, 2022, (15): 62-68.
[
|
| [46] |
|
| [47] |
姚毓春, 梁梦宇. 我国城乡融合发展问题及政策选择. 经济纵横, 2021, (1): 46-53.
[
|
| [48] |
杨俊, 李小明, 黄守军. 大数据、技术进步与经济增长: 大数据作为生产要素的一个内生增长理论. 经济研究, 2022, 57(4): 103-119.
[
|
| [49] |
史卫民, 彭逸飞. 共同富裕下我国城乡融合发展的理论维度与路径突破. 西南金融, 2022, (12): 81-93.
[
|
| [50] |
王媛, 程曦, 殷培红, 等. 影响中国碳排放绩效的区域特征研究: 基于熵值法的聚类分析. 自然资源学报, 2013, 28(7): 1106-1116.
[
|
| [51] |
章激扬. 长三角城市群创新发展空间差异及收敛性研究: 基于Dagum基尼系数分解. 长江流域资源与环境, 2023, 32(2): 235-249.
[
|
| [52] |
胡西武, 黄越, 万建鹏, 等. 新丝路国家与中国各省份外贸总额的空间分异. 经济地理, 2018, 38(10): 5-12.
[
|
| [53] |
|
| [54] |
张彰, 郑艳茜, 李玉姣. 财政分权、政府行为与绿色全要素生产率的增长. 财经论丛, 2020, (3): 22-33.
[
|
| [55] |
邓金钱, 何爱平. 政府主导、地方政府竞争与城乡收入差距: 基于面板分位数模型的经验证据. 中国人口科学, 2017, (6): 54-67.
[
|
| [56] |
熊小林, 李拓. 基本公共服务、财政分权与县域经济发展. 统计研究, 2018, 35(2): 66-74.
[
|
| [57] |
张彤进, 任碧云. 包容性金融发展与城乡居民收入差距: 基于中国内地省级面板数据的实证研究. 经济理论与经济管理, 2017, 37(5): 90-101.
[
|
| [58] |
周民良, 刘希兰. 加快构筑区域协调发展新格局的战略思考. 甘肃社会科学, 2023, (2): 184-195.
[
|
| [59] |
干春晖, 郑若谷, 余典范. 中国产业结构变迁对经济增长和波动的影响. 经济研究, 2011, 46(5): 4-16, 31.
[
|
| [60] |
周璟, 张旭东, 何丹, 等. 基于GIS与RUSLE的武陵山区小流域土壤侵蚀评价研究. 长江流域资源与环境, 2011, 20(4): 468-474.
[
|
/
| 〈 |
|
〉 |