
成渝城市群国土空间碳收支精细核算与驱动因子监测研究
|
魏中胤(1996-),男,山东枣庄人,博士研究生,研究方向为区域创新与协调发展。E-mail: bevis_w@163.com |
收稿日期: 2024-04-01
修回日期: 2024-10-31
网络出版日期: 2025-04-16
基金资助
国家社会科学基金重大项目(20&ZD156)
Detailed accounting of territorial carbon budgets and monitoring of driving factors in the Chengdu-Chongqing Urban Agglomeration
Received date: 2024-04-01
Revised date: 2024-10-31
Online published: 2025-04-16
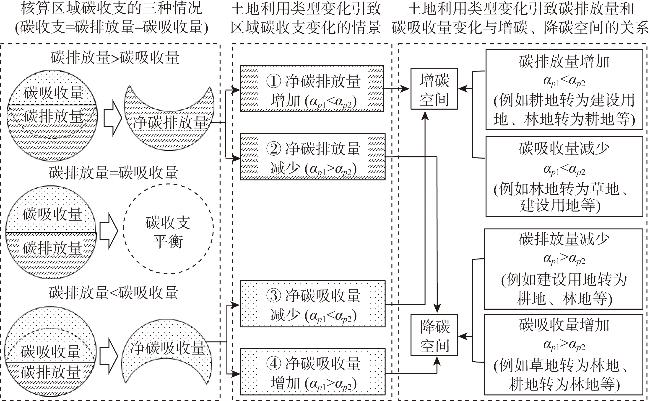
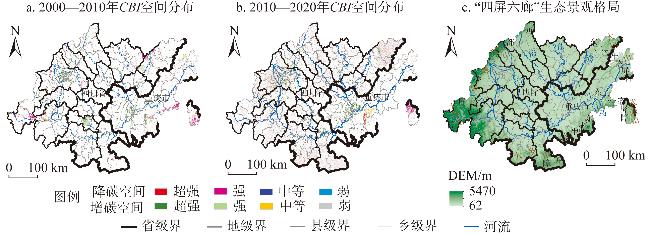
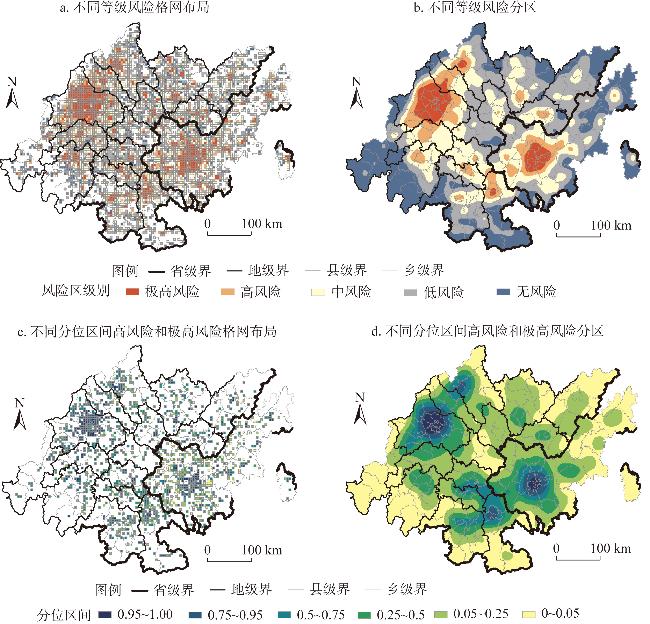
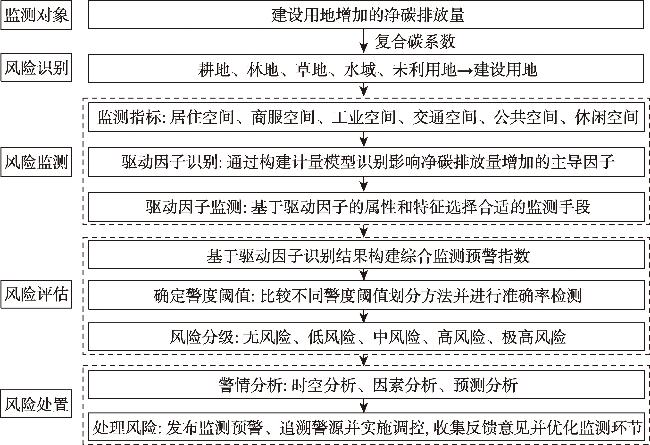
土地是国土空间的核心载体,也是碳排放和碳吸收的重要主体,优化土地利用方式是调控国土空间碳收支的重要手段。基于复合碳系数法构建30 m×30 m栅格尺度的碳收支指数,精细核算2000—2020年成渝城市群因土地利用变化导致的碳收支变化,并结合兴趣点(POI)数据识别影响碳收支的驱动因子,在此基础上构建碳收支监测预警指数并进行风险分区。研究表明:(1)研究期内,成渝城市群发生变化的土地面积共2.27万km2,占土地总面积的12.32%,带来净碳排放量增加1843.58万t,主要由耕地与建设用地间的相互转化导致。(2)耕地转为建设用地成为超强型增碳空间,集中在成都和重庆主城区这两个核心城市;建设用地转为耕地是超强型降碳空间,布局于“双核”及周边区县的农村地区。(3)工业空间、交通空间是驱动超强型增碳空间增加净碳排放量的主导因子,对国土空间碳收支的调控关键是要增加降碳空间或减少增碳空间。(4)基于主导因子划定的碳收支风险区表明,成都和重庆主城区与泸州、绵阳等地为极高风险区域。
魏中胤 , 涂建军 , 肖林 , 杨洋 , 李玥 . 成渝城市群国土空间碳收支精细核算与驱动因子监测研究[J]. 自然资源学报, 2025 , 40(5) : 1294 -1311 . DOI: 10.31497/zrzyxb.20250510
Land serves as the core carrier of territorial space and is also a significant entity for carbon emissions and carbon sequestration. Optimizing land use patterns is a crucial means of regulating territorial space carbon emissions. Using the composite carbon coefficient method, a 30 m×30 m grid-scale carbon budget index was constructed to precisely evaluate the carbon budget changes due to land-use variations in the Chengdu-Chongqing Urban Agglomeration (CCUA) from 2000 to 2020. This study also identified driving factors influencing carbon budget changes using POI data, and on this basis, constructed a carbon budget monitoring and early warning index, followed by risk zoning. Some conclusions can be drawn as follows: (1) During the study period, the total land-use area in the CCUA changed by 22700 km2, accounting for 12.32% of the total land area. This change resulted in an increase of 18.44 million tons in net carbon emissions, primarily due to the mutual conversion between cultivated land and construction land. (2) Cultivated land-to-construction land conversion represented a "super-enhanced" source of increased net carbon emissions in Chengdu and Chongqing's main urban areas, whereas conversion from construction land to cultivated land served as a "super-enhanced" source of reduced net carbon emissions in the rural areas adjacent to these "dual-core" cities. (3) Industrial space and transportation space were the dominant factors driving the increase in "super-enhanced" net carbon emissions. The key to regulating the carbon functionality of territorial space lied in expanding the scope for reducing net carbon emissions or narrowing the scope for increasing net carbon emissions. (4) The carbon budget risk zones identified based on the dominant factors indicate that Chengdu, the main urban areas of Chongqing, Luzhou, Mianyang, and other locations were classified as extremely high-risk areas.
表2 CBI分级阈值Table 2 CBI grading thresholds |
| 变化等级 | 弱(IV) | 中等(III) | 强(II) | 超强(I) | |
|---|---|---|---|---|---|
| 降碳空间 | [-1.1, 0) | [-2.2, -1.1) | [-3.3, -2.2) | < -3.3 | |
| 无变化 | 0 | ||||
| 增碳空间 | (0, 1.1] | (1.1, 2.2] | (2.2, 3.3] | >3.3 | |
表3 POI数据与建设用地空间类型对照Table 3 Comparison of POI data with spatial types of construction land use |
| 空间分类 一级类 | 一级类用地特征描述 | 空间分类 二级类 | POI大类 | POI小类 | 权重 |
|---|---|---|---|---|---|
| 居住空间 (LIS) | 低、中、高层住宅用地,连片分布 | 居住用地 | 商务住宅 | 住宅区 | 50 |
| 商服空间 (CS) | 低层建筑里密集分布餐馆、服饰、小商品等,高层建筑主要为综合性办公场地 | 商业设施用地 | 餐饮服务 | 中外餐厅 | 10 |
| 住宿服务 | 宾馆酒店 | 10 | |||
| 购物服务 | 商场、超市、家具建材市场、特色商业街等 | 15 | |||
| 商务设施用地 | 金融保险服务 | 银行、保险、证券及相关服务机构 | 30 | ||
| 科教文化服务 | 传媒机构 | 30 | |||
| 工业空间 (IS) | 工矿企业的生产车间、仓库及配套设施,占地广,边界明显 | 工业用地 | 商务住宅 | 产业园区 | 70 |
| 公司企业 | 工厂、公司、企业 | 30 | |||
| 交通空间 (TS) | 客货运输站等场所用地,形状明显 | 交通设施用地 | 交通服务设施 | 港口码头、机场、各类车站、服务区等 | 15 |
| 公共空间 (PS) | 教科研、文体、医疗、行政等场所,占地广 | 行政办公用地 | 政府机构及社会团体 | 机关单位、外国机构、社会团体等 | 30 |
| 文化设施用地 | 科教文化服务 | 博物馆、科技馆、展览馆、美术馆、图书馆等科教文化场所 | 30 | ||
| 教育科研用地 | 科教文化服务 | 学校、科研机构、培训机构等 | 30 | ||
| 医疗卫生用地 | 医疗保健服务 | 医院、疾病预防机构等 | 20 | ||
| 体育休闲用地 | 体育休闲服务 | 运动场馆、度假疗养场所、影剧院、娱乐场所 | 10 | ||
| 休闲空间 (LES) | 公园、绿地、广场、景区等用地 | 绿地与广场用地 | 风景名胜 | 公园广场、风景名胜 | 95 |
表4 警度阈值划分方法与准确率测度Table 4 Early warning threshold classification methods and accuracy measurement |
| 方法 | 划分原则 | 操作过程 | 成渝城市群准确率/% |
|---|---|---|---|
| 比较法 | 中位数原则 | 大于中位数即有警 | 73.35 |
| 平均数原则 | 大于平均数即有警 | 87.06 | |
| 波动法 | 波动原则 | PW=min+(max-min)×0.75 (6) | 78.68 |
| 参数法 | 参数原则 | 以自然断裂点法将建设用地碳排放分为5等级,以各级格网量为阈值,对应划分IT为无、低、中、高、极高5类风险区 | 72.84 |
| 误差理论法 | 正态分布原则 | 以均值与不同倍数标准差的差距将IT划分无、低、中、高、极高5类风险区 | 90.43 |
注:PW为无警与有警分界阈值,min、max分别代表IT的最小值、最大值。比较法和波动法的准确率为有警的准确率,参数法和误差理论法的准确率为高风险区和极高风险区的准确率。 |
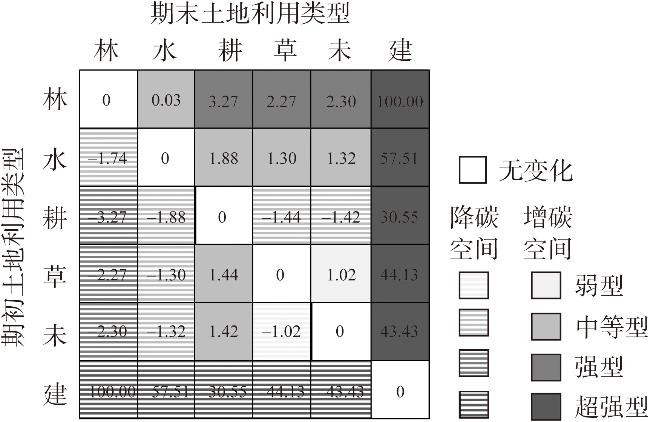
表5 成渝城市群主要地类间转换面积及碳收支变化Table 5 Area of net conversion between major land categories, and changes in net carbon emissions and net carbon sequestration in Chengdu-Chongqing Urban Agglomeration |
| 主要转换类型 | 净转换面积/km2 | 净碳排放量和净碳吸收量变化/万t | |||||
|---|---|---|---|---|---|---|---|
| 2000—2010年 | 2010—2020年 | 2000—2020年 | 2000—2010年 | 2010—2020年 | 2000—2020年 | ||
| CUL-COL | 1905.77 | 2144.28 | 4002.96 | 810.87 | 912.35 | 1703.18 | |
| CUL-WA | 155.06 | 169.82 | 328.11 | -1.05 | -1.15 | -2.21 | |
| FL-COL | 82.96 | 137.75 | 248.94 | 36.13 | 59.99 | 108.41 | |
| FL-CUL | 84.98 | 69.87 | 64.42 | 32.44 | 81.56 | 0.64 | |
| FL-WA | 24.89 | 52.95 | 78.36 | 0.08 | 0.17 | 0.25 | |
| GL-COL | 31.04 | 32.15 | 70.58 | 13.34 | 13.82 | 30.34 | |
| GL-CUL | 216.53 | 220.39 | 483.42 | 0.96 | 0.98 | 2.14 | |
| GL-FL | 1187.12 | 511.49 | 1635.84 | -6.61 | -2.85 | -9.11 | |
| GL-WA | 24.60 | 18.85 | 49.34 | -0.06 | -0.04 | -0.11 | |
| UL-COL | 0.05 | 1.01 | 1.21 | 0.02 | 0.43 | 0.52 | |
| UL-WA | 6.60 | 5.25 | 13.16 | -0.02 | -0.01 | -0.03 | |
| WA-COL | 1.27 | 8.71 | 21.12 | 0.55 | 3.77 | 9.13 | |
注:CUL-COL表示耕地与建设用地相互转换后,整体表现为耕地→建设用地,其他代码意思相同。转换面积即两地类相互转换后的净面积。使用式(2)计算得到净碳排放量和净碳吸收量。 |
表6 成渝城市群不同CBI级别的面积及净碳排放变化Table 6 Changes in area and net carbon emissions of different CBI classes in Chengdu-Chongqing Urban Agglomeration |
| CBI类型 | CBI级别 | 面积/km2 | 净碳排放量变化/万t | |||||
|---|---|---|---|---|---|---|---|---|
| 2000—2010年 | 2010—2020年 | 2000—2020年 | 2000—2010年 | 2010—2020年 | 2000—2020年 | |||
| 降碳空间 | 超强 | 134.61 | 817.50 | 595.07 | -57.75 | -348.71 | -254.04 | |
| 强 | 3092.54 | 5015.40 | 7458.15 | -24.22 | -45.85 | -64.21 | ||
| 中等 | 491.65 | 1437.79 | 1755.6 | -2.53 | -7.45 | -9.09 | ||
| 弱 | 1.01 | 4.00 | 2.83 | 0 | 0 | 0 | ||
| 无变化 | 无变化 | 175731.80 | 167679.99 | 161534.39 | 0 | 0 | 0 | |
| 增碳空间 | 弱 | 7.74 | 3.56 | 11.38 | 0 | 0 | 0 | |
| 中等 | 542.22 | 1515.44 | 1920.65 | 2.43 | 7.39 | 9.10 | ||
| 强 | 2070.54 | 4574.37 | 5966.92 | 18.92 | 43.70 | 56.20 | ||
| 超强 | 2155.69 | 3141.40 | 4939.88 | 918.66 | 1339.06 | 2105.62 | ||
表7 OLS与QR回归结果Table 7 OLS and QR regression results |
| 驱动因子 | OLS | QR | ||||
|---|---|---|---|---|---|---|
| 5th | 25th | 50th | 75th | 95th | ||
| lnΔLIS | -0.05** | -0.18 | -0.26 | -0.11 | 0.03 | -0.08 |
| lnΔCS | -0.13*** | -0.61* | -0.46*** | -0.04 | -0.09 | 0.18 |
| lnΔIS | 0.60*** | 2.67*** | 2.39*** | 2.34*** | 2.24*** | 1.64*** |
| lnΔTS | 0.37*** | 0.01 | 0.68*** | 0.71*** | 0.84*** | 0.88*** |
| lnΔPS | -0.23*** | -0.47 | -1.72*** | -2.35*** | -2.69*** | -2.41*** |
| lnΔLES | 0.05*** | -0.39* | 0.21* | 0.32*** | 0.36*** | 0.34** |
| Obs./个 | 4428 | 4428 | 4428 | 4428 | 4428 | 4428 |
注:***、**、*分别表示P<0.01、P<0.05、P<0.1。 |
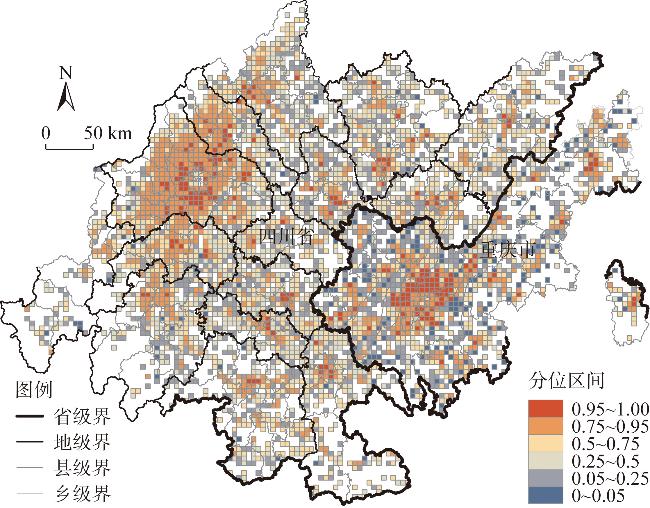
表8 碳收支监测预警指数阈值分类Table 8 Carbon budget monitoring and early warning index threshold classification |
| 阈值区间 | 无风险 | 低风险 | 中风险 | 高风险 | 极高风险 |
|---|---|---|---|---|---|
| (-∞, μ-σ) | [μ-σ, μ-0.5σ) | [μ-0.5σ, μ+0.5σ) | [μ+0.5σ, μ+σ) | [μ+σ, +∞) | |
| IT | (-∞, 0.2622) | [0.2622, 0.2877) | [0.2877, 0.3386) | [0.3386, 0.3641) | [0.3641, +∞) |
| ITQ,Q=0.05 | (-∞, 0.2754) | [0.2754, 0.2829) | [0.2829, 0.298) | [0.298, 0.3056) | [0.3056, +∞) |
| ITQ,Q=0.25 | (-∞, 0.2758) | [0.2758, 0.2826) | [0.2826, 0.2962) | [0.2962, 0.3029) | [0.3029, +∞) |
| ITQ,Q=0.5 | (-∞, 0.2708) | [0.2708, 0.2808) | [0.2808, 0.3009) | [0.3009, 0.311) | [0.311, +∞) |
| ITQ,Q=0.75 | (-∞, 0.2728) | [0.2728, 0.2867) | [0.2867, 0.3146) | [0.3146, 0.3286) | [0.3286, +∞) |
| ITQ,Q=0.95 | (-∞, 0.2964) | [0.2964, 0.3275) | [0.3275, 0.3899) | [0.3899, 0.4211) | [0.4211, +∞) |
注:μ为均值,σ为标准差。 |
| [1] |
|
| [2] |
黄贤金, 张秀英, 卢学鹤, 等. 面向碳中和的中国低碳国土开发利用. 自然资源学报, 2021, 36(12): 2995-3006.
[
|
| [3] |
张振龙, 侯琰珍, 孙鸿鹄. 市域国土空间碳排放测算及低碳化发展效率差异. 自然资源学报, 2023, 38(6): 1464-1481.
[
|
| [4] |
甄峰, 张姗琪, 秦萧, 等. 从信息化赋能到综合赋能: 智慧国土空间规划思路探索. 自然资源学报, 2019, 34(10): 2060-2072.
[
|
| [5] |
郭安宁, 牛陆, 刘霈珈, 等. 黄河流域城市群土地利用的碳排放效应. 经济地理, 2023, 43(9): 172-178, 240.
[
|
| [6] |
孙赫, 梁红梅, 常学礼, 等. 中国土地利用碳排放及其空间关联. 经济地理, 2015, 35(3): 154-162.
[
|
| [7] |
|
| [8] |
朴世龙, 何悦, 王旭辉, 等. 中国陆地生态系统碳汇估算: 方法、进展、展望. 中国科学: 地球科学, 2022, 52(6): 1010-1020.
[
|
| [9] |
刘良云, 陈良富, 刘毅, 等. 全球碳盘点卫星遥感监测方法、进展与挑战. 遥感学报, 2022, 26(2): 243-267.
[
|
| [10] |
夏四友, 杨宇. 基于主体功能区的京津冀城市群碳收支时空分异与碳补偿分区. 地理学报, 2022, 77(3): 679-696.
[
|
| [11] |
张玥, 代亚强, 陈媛媛, 等. 土地利用隐性转型与土地利用碳排放空间关联研究. 中国土地科学, 2022, 36(6): 100-112.
[
|
| [12] |
汪权方, 晋雨涵, 孙佩, 等. 区域土地利用变化碳效应的精细监测方法及其应用. 环境科学, 2024, 45(9): 5060-5068.
[
|
| [13] |
张茹倩, 李鹏辉, 徐丽萍. 城镇化对新疆土地利用碳排放的影响及其耦合关系. 生态学报, 2022, 42(13): 5226-5242.
[
|
| [14] |
单玉红, 程秋月, 柯新利, 等. 流空间视角下湖北省县域土地利用碳排放关联态势及其影响因素研究. 中国土地科学, 2024, 38(3): 48-59.
[
|
| [15] |
石洪昕, 穆兴民, 张应龙, 等. 四川省广元市不同土地利用类型的碳排放效应研究. 水土保持通报, 2012, 32(3): 101-106.
[
|
| [16] |
钱静, 毛利伟, 杨续超, 等. 基于POI和多源遥感数据估算中国人为热排放. 中国环境科学, 2023, 43(6): 3183-3193.
[
|
| [17] |
曹根榕, 顾朝林, 张乔扬. 基于POI数据的中心城区“三生空间” 识别及格局分析: 以上海市中心城区为例. 城市规划学刊, 2019, (2): 44-53.
[
|
| [18] |
王开家, 徐伟铭, 李楚瑜, 等. 空间治理视角下的城市建成区土地混合利用功能与结构. 自然资源学报, 2023, 38(6): 1496-1516.
[
|
| [19] |
吴佳楠, 储君, 孙裔煜, 等. SOFM网络下的深圳市城市用地功能识别分析. 北京大学学报: 自然科学版, 2022, 58(4): 664-672.
[
|
| [20] |
|
| [21] |
丛日杰, 韩洁平. 基于人工神经网络的我国火电厂碳排放预警评价研究: 以吉林省某火电厂为例. 生态经济, 2019, 35(10): 37-41.
[
|
| [22] |
赵桂芹. 中国出口贸易碳排放的测度与预警研究. 生态经济, 2018, 34(9): 19-24.
[
|
| [23] |
韩少秀, 朱美峰, 刘慧洁, 等. 碳排放监测预警体系研究: 基于中国省级相关数据的分析. 生态经济, 2022, 38(7): 21-27.
[
|
/
| 〈 |
|
〉 |