
中国耕地—粮食丰裕度与居民收入的关系研究
|
杨人懿(1997- ),男,云南大理人,博士研究生,研究方向为农村贫困治理与乡村发展、自然资源开发利用与区域可持续发展。E-mail: yangrenyi1997@126.com |
收稿日期: 2023-12-18
修回日期: 2024-05-29
网络出版日期: 2024-11-15
基金资助
国家社会科学基金重大项目(18VSJ023)
国家自然科学基金项目(41261018)
国家自然科学基金项目(71673182)
Study on the relationship between farmland & grain abundance and households' income in China
Received date: 2023-12-18
Revised date: 2024-05-29
Online published: 2024-11-15
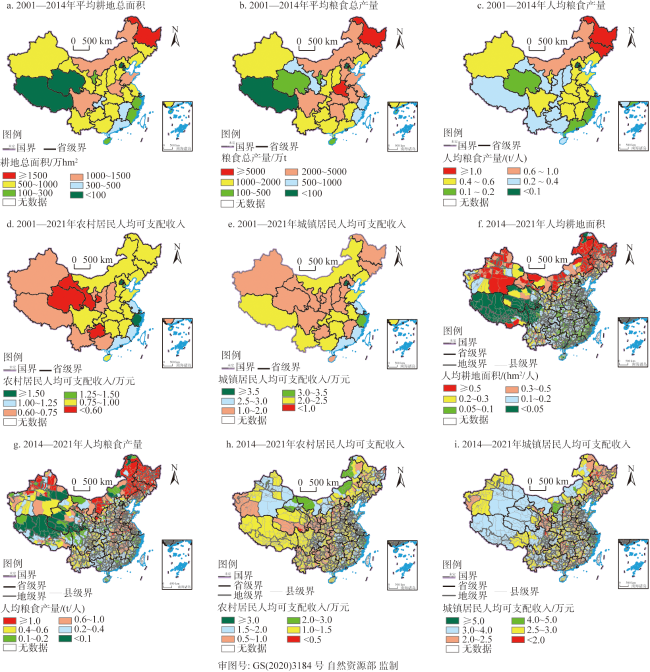
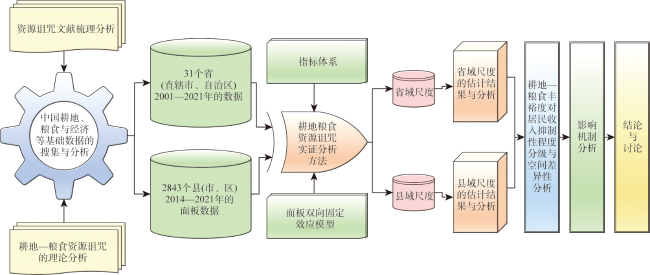
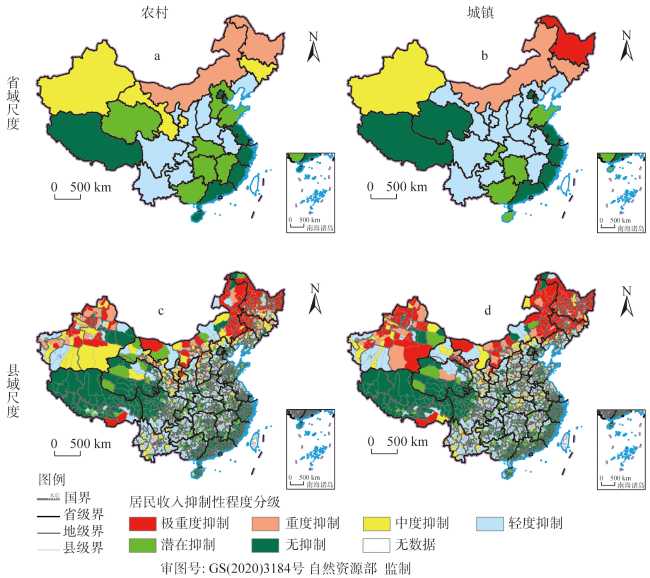
粮食安全乃是“国之大者”,然而在现实中却往往呈现出“产粮大县、经济穷县”“粮食产出多,农民收入低”等反常现象。针对现有“资源诅咒”研究中几乎未涉足粮食与耕地的话题、缺乏资源丰裕度对居民收入影响的定量实证分析等不足,采用省域和县域两种尺度相结合的分析方式,分别搜集了31个省(自治区、直辖市)2001—2021年和2843个县域2014—2021年的面板数据,进行中国耕地—粮食丰裕度与居民收入关系的实证检验。研究结果表明:粮食主产区的耕地—粮食丰裕度对农村和城镇居民可支配收入的抑制是客观存在的;耕地—粮食丰裕度分别对70%以上的省域农村和城镇居民以及56.81%和64.09%的县域农村和城镇居民的收入产生不同程度的抑制现象(含潜在抑制)。本文据此提出了破解耕地—粮食丰裕对居民收入抑制的对策建议。
杨人懿 , 杨子生 , 钟昌标 , 杨诗琴 , 曹琳琳 . 中国耕地—粮食丰裕度与居民收入的关系研究[J]. 自然资源学报, 2024 , 39(11) : 2619 -2638 . DOI: 10.31497/zrzyxb.20241108
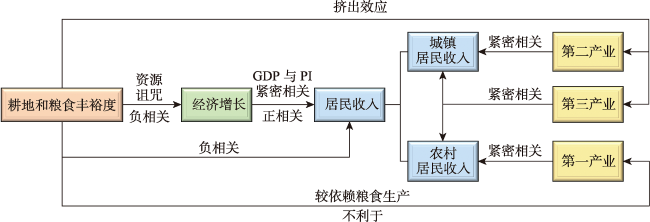
Food security is the most important for China. However, we often see abnormal phenomena such as "main grain-producing counties with low economic level", and "larger grain output with less income of farmers". In view of the lack of research on the resources curse of grain and farmland, and the lack of quantitative analysis of the impact of resource abundance on residents' income, in this paper, we use the method in combination of the provincial and county scale analysis to carry out the empirical test of China's relationship between farmland & grain abundance and households' income on the basis of collected respectively panel data of 31 provincial-level regions in 2001-2021 and 2843 counties in 2014-2021. The paper also analyzes the spatial difference of the suppression degree of the farmland & grain abundance on the income of the residents in the provincial and county scales, and reveals its influence mechanism by using econometric model. The results show that: (1) The farmland & grain of the main grain-producing areas has a significant suppression effect on the income of rural and urban residents. (2) The farmland & grain abundance has a different degree of suppression effect on the income of more than 70% of the rural and urban residents in the provincial scale, and 56.81% of the rural residents and 64.09% of the urban residents in the county scale, among which 8.58% of the rural residents and 10.06% of the urban residents in the counties reach the "serious suppression" and "extremely-serious suppression" levels. (3) The abundance of grain does not obviously promote the development of the primary industry in the main grain-producing areas, but increases the dependence of the primary industry on grain, and it also obviously inhibits the development of the sectors of the secondary and tertiary industries. Based on the above, this paper proposes countermeasures to solve the problem.
表1 计量经济学模型检验的指标体系Table 1 Index system for econometric model testing |
| 属性 | 维度 | 简称 | 变量 | 计算方法 | 单位 |
|---|---|---|---|---|---|
| 因变量 | 居民收入水平 | rural | 农村居民收入水平 | 农村居民人均可支配收入 | 万元/人 |
| urban | 城镇居民收入水平 | 城镇居民人均可支配收入 | 万元/人 | ||
| 核心 自变量 | 耕地丰裕度 | cultiprop | 耕地面积比例 | 耕地总面积/土地总面积×100% | % |
| perculti | 人均耕地面积 | 耕地总面积/总人口 | hm2/人 | ||
| 粮食丰裕度 | totalopt | 粮食总产出 | 粮食总产量 | 万t | |
| peropt | 人均粮食产出 | 粮食总产量/总人口 | t/人 | ||
| 控制变量 | 产业结构 | struc | 产业结构 | 第三产业产值/GDP×100% | % |
| afafopt | 农林牧渔产业产值 | 农林牧渔业总产值 | 元/人 | ||
| 发展状况 | light | 夜间灯光亮度 | 夜间灯光平均亮度+0.01 | 无 | |
| 投资支出 | fix | 固定资产投资力度 | 固定资产投资额 | 元/人 | |
| finance | 财政收入水平 | 公共财政一般预算收入 | 元/人 | ||
| 人口结构 | pd | 人口密度 | 总人口/土地面积 | 人/ km2 |
表2 中国31个省(自治区、直辖市)耕地—粮食丰裕度对居民收入影响的实证研究结果Table 2 Empirical study on the impact of farmland and grain abundance on residents' income in China |
| 类型 | rural为因变量;样本包括中国31个省(自治区、直辖市) | rural为因变量;样本仅包括中国粮食主产区 | |||||||
|---|---|---|---|---|---|---|---|---|---|
| (1) | (2) | (3) | (4) | (5) | (6) | (7) | (8) | ||
| cultiprop | -0.0099** | -0.0333*** | |||||||
| perculti | -0.5766 | -1.2107** | |||||||
| totalopt | 0.00001 | -0.000005 | |||||||
| peropt | -0.0795* | -0.1165*** | |||||||
| 样本量/个 | 651 | 651 | 651 | 651 | 273 | 273 | 273 | 273 | |
| R2 | 0.9747 | 0.9708 | 0.9745 | 0.9709 | 0.9914 | 0.9878 | 0.9890 | 0.9880 | |
| 类型 | urban为因变量;样本包括中国31个省(自治区、直辖市) | urban为因变量;样本仅包括中国粮食主产区 | |||||||
| (9) | (10) | (11) | (12) | (13) | (14) | (15) | (16) | ||
| cultiprop | -0.0305*** | -0.0578*** | |||||||
| perculti | -4.0355*** | -5.5690*** | |||||||
| totalopt | -0.0001*** | -0.0001*** | |||||||
| peropt | -0.4773*** | -0.5148*** | |||||||
| 样本量/个 | 651 | 651 | 651 | 651 | 273 | 273 | 273 | 273 | |
| R2 | 0.9768 | 0.9742 | 0.9768 | 0.9747 | 0.9889 | 0.9856 | 0.9882 | 0.9863 | |
注:以上结果均为考虑了控制变量后的TWFE模型的稳健标准误估计结果,为节约篇幅,不再汇报标准误。**、***分别表示估计参数显著性水平为5%、1%,下同。 |
表3 中国2843个县域耕地、粮食丰裕度与居民收入的实证研究结果Table 3 Empirical study on farmland & grain abundance and residents' income in 2843 counties of China |
| 类型 | rural为因变量 | urban为因变量 | |||||||
|---|---|---|---|---|---|---|---|---|---|
| (1) | (2) | (3) | (4) | (5) | (6) | (7) | (8) | ||
| cultiprop | -0.0039** (0.0016) | -0.0063*** (0.0024) | |||||||
| perculti | -0.3303*** (0.1037) | -0.5038*** (0.1575) | |||||||
| totalopt | -0.0018*** (0.0004) | -0.0031*** (0.0008) | |||||||
| peropt | -0.0949*** (0.0120) | -0.1720*** (0.0200) | |||||||
| 样本量/个 | 22656 | 22656 | 22656 | 22656 | 22744 | 22744 | 22744 | 22744 | |
| R2 | 0.9644 | 0.9639 | 0.9645 | 0.9641 | 0.9626 | 0.9617 | 0.9628 | 0.9620 | |
注:以上结果均为考虑了控制变量后的TWFE模型的个体聚类稳健标准误估计结果,下同。 |
表4 不同粮食生产区域的耕地、粮食丰裕度与居民收入的实证结果Table 4 Empirical results on farmland & grain abundance and residents' income in different regions of China |
| 类型 | 粮食主产区 | 粮食产销平衡区 | 粮食主销区 | |||||
|---|---|---|---|---|---|---|---|---|
| (1)rural | (2)urban | (3)rural | (4)urban | (5)rural | (6)urban | |||
| cultiprop | -0.0101*** (0.0021) | -0.0077** (0.0037) | 0.0012 (0.0018) | -0.0095*** (0.0024) | -0.0179*** (0.0062) | -0.0288*** (0.0100) | ||
| 样本量/个 | 12448 | 12448 | 7336 | 7336 | 2960 | 2960 | ||
| R2 | 0.9667 | 0.9653 | 0.9542 | 0.9621 | 0.9538 | 0.9551 | ||
| 类型 | (7)rural | (8)urban | (9)rural | (10)urban | (11)rural | (12)urban | ||
| perculti | -0.3348** (0.1331) | -0.3200* (0.1786) | -0.2009 (0.1425) | -0.7332*** (0.1850) | -4.5790** (2.0886) | -3.4456 (2.5065) | ||
| 样本量/个 | 12448 | 12448 | 7336 | 7336 | 2960 | 2960 | ||
| R2 | 0.9660 | 0.9648 | 0.9539 | 0.9608 | 0.9528 | 0.9540 | ||
| 类型 | (13)rural | (14)urban | (15)rural | (16)urban | (17)rural | (18)urban | ||
| totalopt | -0.0022*** (0.0005) | -0.0040*** (0.0007) | -0.0005* (0.0003) | 0.0011 (0.0007) | -0.0043 (0.0047) | -0.0039 (0.0131) | ||
| 样本量/个 | 12448 | 12448 | 7336 | 7336 | 2960 | 2960 | ||
| R2 | 0.9667 | 0.9657 | 0.9542 | 0.9619 | 0.9532 | 0.9547 | ||
| 类型 | (19)rural | (20)urban | (21)rural | (22)urban | (23)rural | (24)urban | ||
| peropt | -0.1274*** (0.0140) | -0.1863*** (0.0237) | -0.0160 (0.0157) | 0.0059 (0.0388) | -0.1719 (0.2740) | -0.1163 (0.6481) | ||
| 样本量/个 | 12448 | 12448 | 7336 | 7336 | 2960 | 2960 | ||
| R2 | 0.9668 | 0.9655 | 0.9538 | 0.9603 | 0.9522 | 0.9539 | ||
注:*表示估计参数显著性水平为10%,下同。 |
表5 耕地—粮食丰裕度对居民收入的抑制性程度分级体系Table 5 A grading system for the degree of suppression of farmland and grain abundance on residents' income |
| 抑制性 程度分级 | ISIFG值 | 含义 |
|---|---|---|
| 1. 无抑制 | <0.8 | 该地居民收入水平总体较高,居民收入对耕地资源禀赋和粮食生产的依赖很小 |
| 2. 潜在抑制 | 0.8~1.0 | 该地尚不存在耕地—粮食丰裕度对居民收入抑制的现象,但该数值已接近于1,若不采取合理可行的举措,则可能导致居民收入被抑制的问题 |
| 3. 轻度抑制 | 1.0~2.0 | 该地已存在明显的耕地—粮食丰裕度对居民收入抑制的现象,尽管受抑制程度相对较轻,但需要引起重视,采取可行的措施规避耕地—粮食丰裕度对居民收入抑制的问题 |
| 4. 中度抑制 | 2.0~3.0 | 该地已存在中等程度的耕地—粮食丰裕度对居民收入抑制的现象,耕地—粮食优势与居民收入水平之间出现了明显的反差,需要采取有力的措施规避这种抑制性问题 |
| 5. 重度抑制 | 3.0~4.0 | 该地的耕地—粮食丰裕度与居民收入之间存在严重的不匹配或反差,耕地—粮食优势对居民收入有着较为严重的抑制作用,需要采取强有力的措施稳步推动居民收入的可持续增长 |
| 6. 极重度抑制 | ≥4.0 | 该地的耕地—粮食优势与居民收入水平的偏离程度很大,耕地—粮食优势对居民收入的抑制作用非常严重,需要科学、合理地制定强有力的措施体系来破解“产量多,收入低”的突出问题 |
表6 耕地与粮食丰裕度对第一产业及其增长状况的影响Table 6 The impact of farmland & grain abundance on the primary industry and its growth status |
| 类型 | 人均第一产业产值为因变量/(元/人) | 人均第一产业产值自然对数形式为因变量/(元/人) | |||||||||
|---|---|---|---|---|---|---|---|---|---|---|---|
| 所有样本 | 粮食主产区 | 所有样本 | 粮食主产区 | ||||||||
| (1) | (2) | (3) | (4) | (5) | (6) | (7) | (8) | ||||
| cultiprop | 30.5882*** (11.5150) | 22.6705 (18.3158) | 0.0043*** (0.0016) | 0.0043 (0.0027) | |||||||
| totalopt | 8.6716 (6.0825) | 14.4564* (8.4564) | 0.0008** (0.0004) | 0.0008 (0.0005) | |||||||
| 样本量/个 | 22744 | 22744 | 12448 | 12448 | 22744 | 22744 | 12448 | 12448 | |||
| R2 | 0.9523 | 0.9523 | 0.9521 | 0.9523 | 0.9942 | 0.9942 | 0.9929 | 0.9929 | |||
注:本表中的核心解释变量为cultiprop和totalopt,若换成perculti和peropt作为核心解释变量的结果也较为类似,为节约篇幅,本文不再汇报其估计结果。下同。 |
表7 粮食丰裕度与第一产业对粮食依赖度之间的关系Table 7 The relationship between grain abundance and the dependence of the primary industry on grain |
| 类型 | 所有样本 | 粮食主产区 | 粮食产销平衡区 | 粮食主销区 | |||||||
|---|---|---|---|---|---|---|---|---|---|---|---|
| (1) | (2) | (3) | (4) | (5) | (6) | (7) | (8) | ||||
| totalopt | 0.0159*** (0.0017) | 0.0129*** (0.0011) | 0.0190*** (0.0064) | 0.0454*** (0.0128) | |||||||
| peropt | 0.6056*** (0.0903) | 0.4118*** (0.0810) | 1.0424*** (0.1262) | 3.0592*** (0.4256) | |||||||
| 样本量/个 | 22744 | 22744 | 12448 | 12448 | 7336 | 7336 | 2960 | 2960 | |||
| R2 | 0.9923 | 0.9924 | 0.9911 | 0.9909 | 0.9909 | 0.9920 | 0.9962 | 0.9964 | |||
表8 不同粮食生产区域的耕地与粮食丰裕度对第二和第三产业的影响Table 8 The impact of farmland & grain abundance in different grain production regions on the secondary and tertiary industries |
| 人均第二产业产值为因变量(元/人) | 粮食主产区 | 粮食产销平衡区 | 粮食主销区 | |||||
|---|---|---|---|---|---|---|---|---|
| (1) | (2) | (3) | (4) | (5) | (6) | |||
| cultiprop | -285.47(125.39)** | 113.85(93.67) | 413.65(632.41) | |||||
| totalopt | -74.49(18.16)*** | -31.81(16.97)* | -1135.95(749.69) | |||||
| 样本量/个 | 12447 | 12447 | 7336 | 7336 | 2960 | 2960 | ||
| R2 | 0.9529 | 0.9470 | 0.9423 | 0.9423 | 0.9511 | 0.9515 | ||
| 人均第三产业产值为因变量(元/人) | 粮食主产区 | 粮食产销平衡区 | 粮食主销区 | |||||
| (7) | (8) | (9) | (10) | (11) | (12) | |||
| cultiprop | -842.96(176.20)*** | -180.07(124.16) | -420.87(564.92) | |||||
| totalopt | -119.21(20.96)*** | -9.68(12.23) | 141.81(522.90) | |||||
| 样本量/个 | 12448 | 12448 | 7336 | 7336 | 2960 | 2960 | ||
| R2 | 0.9514 | 0.9510 | 0.9479 | 0.9477 | 0.9596 | 0.9595 | ||
感谢杨金蓉、罗磊和申宜丛3名硕士研究生在协助搜集基础数据过程中所付出的辛勤劳动!
| [1] |
杨子生, 刘彦随, 赵乔贵, 等. 基于耕地资源利用的区域粮食安全评估原理·方法及其在云南的实践. 北京: 中国科学技术出版社, 2008.
[
|
| [2] |
央广网—中国乡村之声. 800产粮大县贫困人口3600万为何产粮越多反而越穷?, http://country.cnr.cn/gundong/20150825/t20150825_519647956.shtml, 2015-08-25.
[China National Radio: Voice of China's Countryside. There are 36 million poverty alleviation population in 800 grain-producing counties. Why these counties produce more grain but poorer?, http://country.cnr.cn/gundong/20150825/t20150825_519647956.shtml, 2015-08-25.]
|
| [3] |
新浪网. 黑龙江饶河调研报告: 全家种地一年收入不及一人外出打工, https://news.sina.cn/gn/2023-04-11/detail-imypypnq7484335.d.html, 2023-04-11.
[Sina. An investigation report of Raohe county, Heilongjiang province: A family's annual income from farming was less than one person working outside the home, https://news.sina.cn/gn/2023-04-11/detail-imypypnq7484335.d.html, 2023-04-11.]
|
| [4] |
国务院第三次全国国土调查领导小组办公室, 自然资源部, 国家统计局. 第三次全国国土调查主要数据公报. 人民日报, 2021-08-27(17).
[Office of the Leading Group for the Third National Land Survey of the State Council, Ministry of Natural Resources, National Bureau of Statistics of the People's Republic of China. Bulletin on the Main Data of the Third National Land Survey. People's Daily, 2021-08-27(17).]
|
| [5] |
杜尚泽. 那么粮食怎么办? (微镜头·习近平总书记在中央经济工作会议上). 人民日报, 2021-12-12(1), http://paper.people.com.cn/rmrb/html/2021-12/12/nw.D110000renmrb_20211212_2-01.htm.
[
|
| [6] |
姚洋. 发展经济学. 北京: 北京大学出版社, 2013.
[
|
| [7] |
|
| [8] |
|
| [9] |
|
| [10] |
|
| [11] |
|
| [12] |
|
| [13] |
|
| [14] |
|
| [15] |
|
| [16] |
|
| [17] |
|
| [18] |
|
| [19] |
张馨, 牛叔文, 丁永霞, 等. 中国省域能源资源与经济增长关系的实证分析: 基于“资源诅咒”假说. 自然资源学报, 2010, 25(12): 2040-2051.
[
|
| [20] |
|
| [21] |
|
| [22] |
王晓楠, 孙威. 黄河流域资源型城市转型效率及其影响因素. 地理科学进展, 2020, 39(10): 1643-1655.
[
|
| [23] |
王雅俊, 王雅蕾. 黄河流域城市“资源诅咒”异质性效应研究. 当代经济, 2022, 39(10): 46-53.
[
|
| [24] |
|
| [25] |
|
| [26] |
|
| [27] |
毕铃, 郭琎. “资源诅咒”的形成机制研究. 政治经济学评论, 2012, 3(4): 173-185.
[
|
| [28] |
姚予龙, 周洪, 谷树忠. 中国资源诅咒的区域差异及其驱动力剖析. 资源科学, 2011, 33(1): 18-24.
[
|
| [29] |
王闰平, 陈凯. 资源富集地区经济贫困的成因与对策研究: 以山西省为例. 资源科学, 2006, 28(4): 158-165.
[
|
| [30] |
崔学锋. 美国规避“资源诅咒”的成功经验及启示. 理论探索, 2013, 30(4): 92-95.
[
|
| [31] |
褚艳宁. 生态经济视角下“资源诅咒”向“资源福祉”的转化. 经济问题, 2015, 37(2): 31-34.
[
|
| [32] |
|
| [33] |
|
| [34] |
|
| [35] |
张菲菲, 刘刚, 沈镭. 中国区域经济与资源丰度相关性研究. 中国人口·资源与环境, 2007, 17(4): 19-24.
[
|
| [36] |
文兰娇, 张安录. 武汉城市圈土地资源诅咒空间差异性、空间传导机制及差别化管理. 中国土地科学, 2013, 27(9): 30-37.
[
|
| [37] |
刘宗飞, 姚顺波, 刘越. 基于空间面板模型的森林“资源诅咒”研究. 资源科学, 2015, 37(2): 379-390.
[
|
| [38] |
王毅鑫, 王慧敏, 刘钢, 等. 生态优先视域下资源诅咒空间分异分析: 以黄河流域为例. 软科学, 2019, 33(1): 50-55.
[
|
| [39] |
李文静, 张朝枝. 基于路径依赖视角的旅游资源诅咒演化模型. 资源科学, 2019, 41(9): 1724-1733.
[
|
| [40] |
丁声俊. 粮食大省“资源诅咒”之忧. 黑龙江粮食, 2014, 25(9): 4-8.
[
|
| [41] |
戈大专, 孙攀, 周贵鹏, 等. 传统农区粮食生产转型机制及其安全效应: 基于乡村空间治理视角. 自然资源学报, 2021, 36(6): 1588-1601.
[
|
| [42] |
国家发展和改革委员会. 全国新增1000亿斤粮食生产能力规划 (2009—2020年), https://www.gov.cn/gzdt/2009-11/03/content_1455493.htm, 2009-11-03.
[National Development and Reform Commission of PRC. National plan to increase grain production capacity by 500 billion kilograms (2009-2020), https://www.gov.cn/gzdt/2009-11/03/content_1455493.htm, 2009-11-03.]
|
| [43] |
潘竟虎. 中国地级及以上城市城乡收入差距时空分异格局. 经济地理, 2014, 34(6): 60-67.
[
|
| [44] |
孙晓一, 徐勇, 刘艳华. 中国居民收入差距及空间分异特征. 经济地理, 2015, 35(12): 18-25, 42.
[
|
| [45] |
杨子生, 杨人懿, 刘凤莲. 基于贫困分级的云南省城乡收入差距时空演化与影响因素研究. 地理研究, 2021, 40(8): 2252-2271.
[
|
| [46] |
杨人懿, 钟昌标, 杨子生, 等. 精准扶贫政策与农村居民增收: 基于云南省129个县的实证检验. 南开经济研究, 2023, 39(3): 131-150.
[
|
| [47] |
|
| [48] |
|
| [49] |
苏迅. 资源贫困: 现象、原因与补偿. 中国矿业, 2007, 16(10): 11-14.
[
|
| [50] |
陈秧分, 王介勇, 张凤荣, 等. 全球化与粮食安全新格局. 自然资源学报, 2021, 36(6): 1362-1380.
[
|
| [51] |
袁源, 王亚华, 徐萍. “非粮化”治理视角下的耕地用途管制: 应对逻辑与体系构建. 自然资源学报, 2024, 39(4): 942-959.
[
|
| [52] |
罗伊·普罗斯特曼, 蒂姆·汉斯达德, 李平. 中国农业的规模经营: 政策适当吗?. 中国农村观察, 1996, 17(6): 17-29, 63.
[
|
| [53] |
国家统计局. 中国统计年鉴(2021). 北京: 中国统计出版社, 2021.
[National Bureau of Statistics of China. China Statistical Yearbook 2021. Beijing: China Statistics Press, 2021.]
|
| [54] |
国家统计局. 国际统计年鉴(2022). 北京: 中国统计出版社, 2022.
[National Bureau of Statistics of China. International Statistical Yearbook 2022. Beijing: China Statistics Press, 2022.]
|
| [55] |
|
| [56] |
张守莉, 杨宁, 边爽. 土地经营规模对农户种粮收入的影响分析: 以吉林省公主岭市为例. 中国农业资源与区划, 2017, 38(9): 162-166.
[
|
| [57] |
沈玉洁. 以河南省西华县为例谈土地经营规模对农户种粮收入的影响. 粮食问题研究, 2020, (2): 43-48.
[
|
/
| 〈 |
|
〉 |