
青藏高原气候变化对草地碳汇/源格局的影响
|
耿垭鑫(1996- ),女,山西长治人,硕士,研究方向为自然地理。E-mail: gengyaxin@stu.cdut.edu.cn |
收稿日期: 2023-05-29
修回日期: 2024-01-13
网络出版日期: 2024-05-11
基金资助
四川省科技计划项目(2022YFS0491)
第二次青藏高原综合科学考察研究(2019QZKK0307)
国家自然科学基金项目(41801099)
Impacts of climate change on grassland carbon sink/source patterns in the Qinghai-Tibet Plateau
Received date: 2023-05-29
Revised date: 2024-01-13
Online published: 2024-05-11
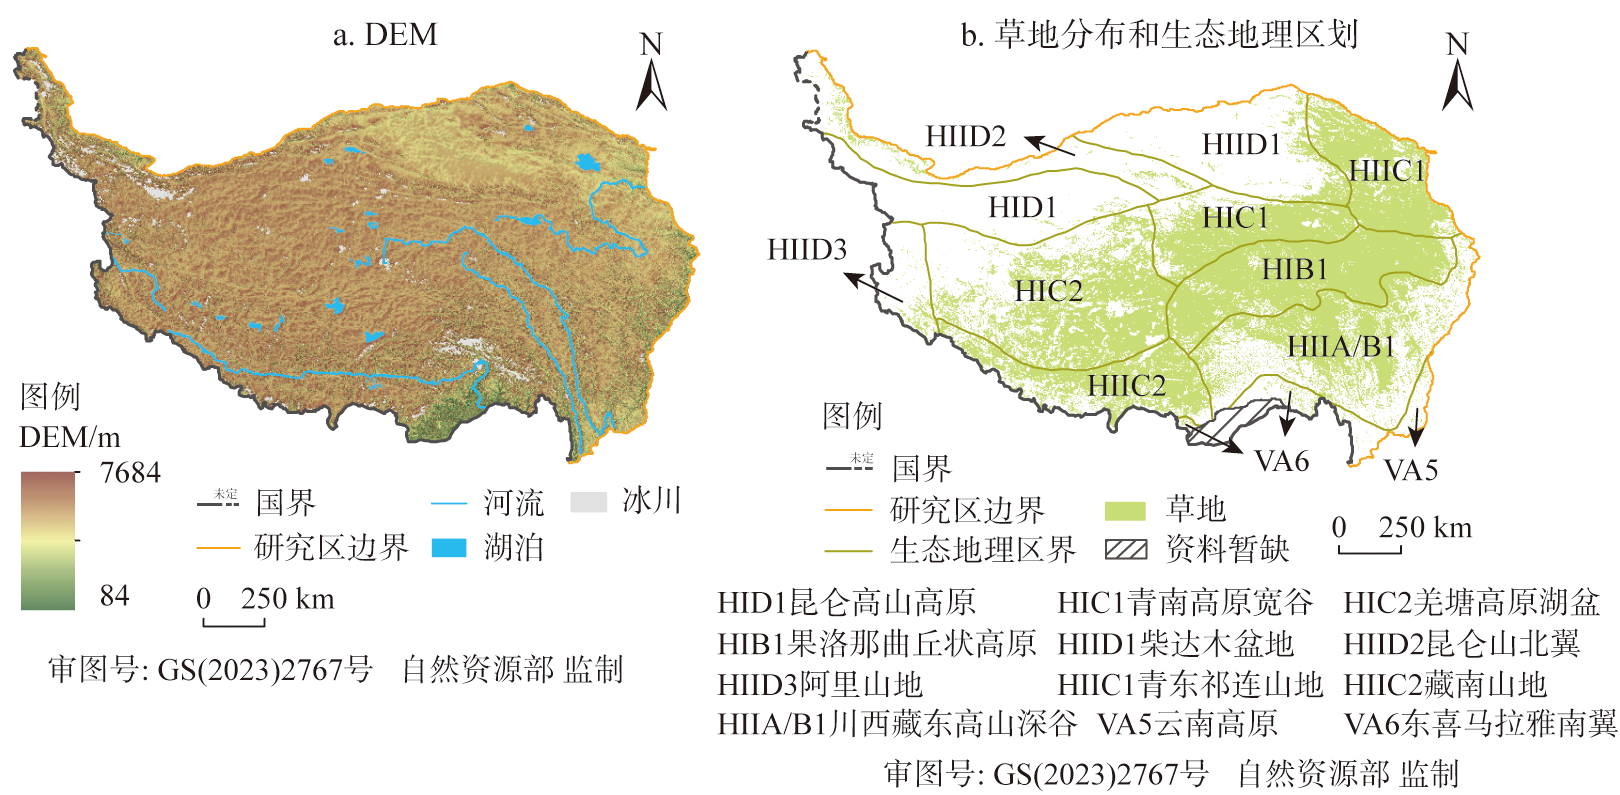
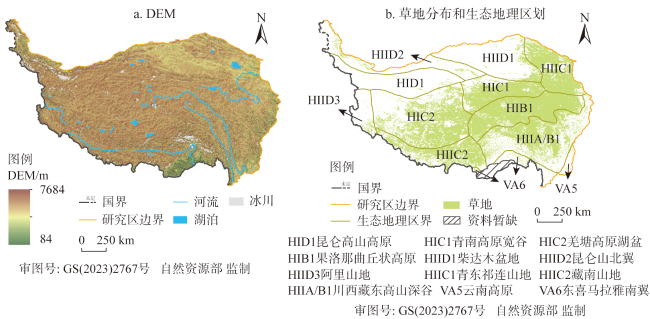
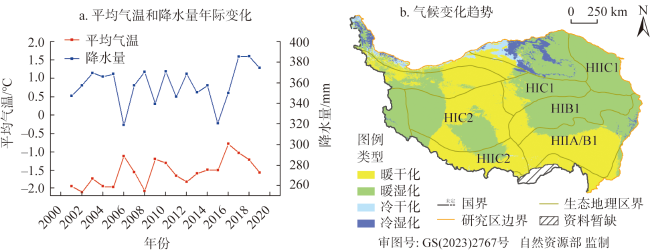
草地碳汇/源是植被生态系统中碳收支和碳平衡的一个重要内容,区分碳汇和碳源对气候变化的响应可为减源增汇提供科学依据。基于MODIS NPP数据和土壤呼吸模型量化了2001—2019年青藏高原草地净生态系统生产力(NEP)的时空变化和碳汇/源格局,利用通径分析方法分析了青藏高原气候变化对草地碳汇/源的影响。结果表明:青藏高原草地NEP呈现东高西低的分布格局,年平均值为54.41 g C m-2。草地整体上以碳汇功能为主。碳汇区面积约为72.26万km2,碳源区面积约为47.82万km2,净碳汇总量65.35 Tg C a-1。近19年青藏高原草地NEP以增加趋势为主,青藏高原气候暖湿化趋势有利于草地NEP的增加,增强碳汇;而暖干化趋势对NEP的影响在不同生态地理区差异较大。
耿垭鑫 , 易桂花 , 张廷斌 , 别小娟 , 李景吉 , 王国严 , 林梦男 . 青藏高原气候变化对草地碳汇/源格局的影响[J]. 自然资源学报, 2024 , 39(5) : 1208 -1221 . DOI: 10.31497/zrzyxb.20240514
Grassland carbon sink/source is an important part of carbon budget and carbon balance in vegetation ecosystem. Distinguishing the response of carbon sink and carbon source to climate change can provide a scientific basis for reducing sources and increasing sinks. Based on MODIS NPP data and the soil respiration model, we quantified the spatial and temporal variability of Net Ecosystem Productivity (NEP) and carbon sink/source patterns in the Qinghai-Tibet Plateau (QTP) grassland ecosystem from 2001 to 2019, and analyzed the impact of climate change on grassland carbon sink/source using path analysis. The results show that the NEP in the grassland of the QTP presents a distribution pattern of higher in the east and lower in the west, with the average annual NEP of 54.41 g C m-2. Most of the grassland area in the QTP has functioned as a carbon sink since 2001. The areas of carbon sink are about 72.26×10⁴ km2, with an average carbon sequestration of 79.61 Tg C a-1. The carbon source areas are about 47.82×10⁴ km2, with an average carbon release of 14.26 Tg C a-1. Over the past 19 years, the trend of NEP in grassland of the QTP has been increasing. The trend of warming and humidification in the QTP was conducive to the increase of grassland NEP and the enhancement of carbon sinks. However, the effects of warming and drying trends on NEP varied greatly in different eco-geographical region systems.
Key words: NEP; carbon sink/source; climate change; path analysis; Qinghai-Tibet Plateau
表1 2001—2019年青藏高原不同生态地理区草地NEP平均值Table 1 Average NEP of eco-geographical region in the QTP grassland ecosystem from 2001 to 2019 |
| 生态地理区 | 平均NEP/(g C m-2 a-1) | 平均高程/m |
|---|---|---|
| 羌塘高原湖盆区(HIC2) | -19.35 | 5021.98 |
| 青南高原宽谷区(HIC1) | -15.16 | 4694.02 |
| 藏南山地区(HIIC2) | 13.93 | 4829.98 |
| 果洛那曲丘状高原区(HIB1) | 86.99 | 4491.32 |
| 川西藏东高山深谷区(HIIA/B1) | 116.86 | 4111.08 |
| 青东祁连山地区(HIIC1) | 142.70 | 3562.52 |
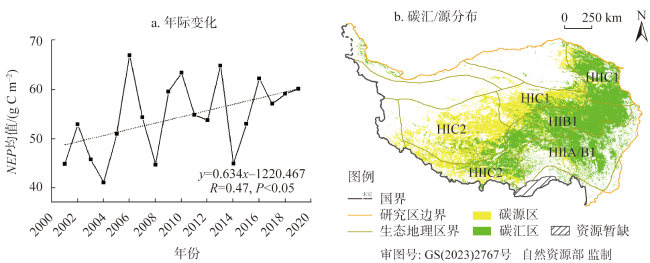
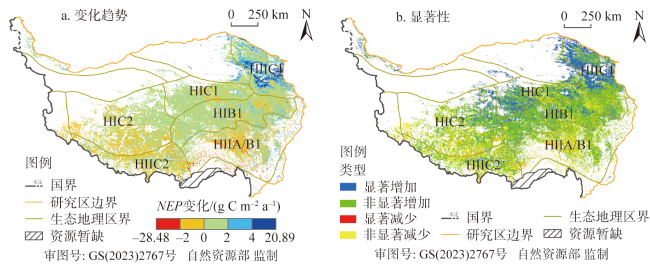
图3 2001—2019 年青藏高原草地NEP的变化趋势及其显著性Fig. 3 Change trends and their significance of grassland NEP in the QTP from 2001 to 2019 |
表2 青藏高原草地碳汇/源不同变化趋势面积占比Table 2 Area share of different carbon sink/source trends in grasslands in the QTP (%) |
| 变化趋势 | 碳源区 | 碳汇区 |
|---|---|---|
| 显著增加 | 18.85 | 17.14 |
| 非显著增加 | 56.96 | 58.92 |
| 显著减少 | 1.14 | 1.45 |
| 非显著减少 | 23.05 | 22.49 |
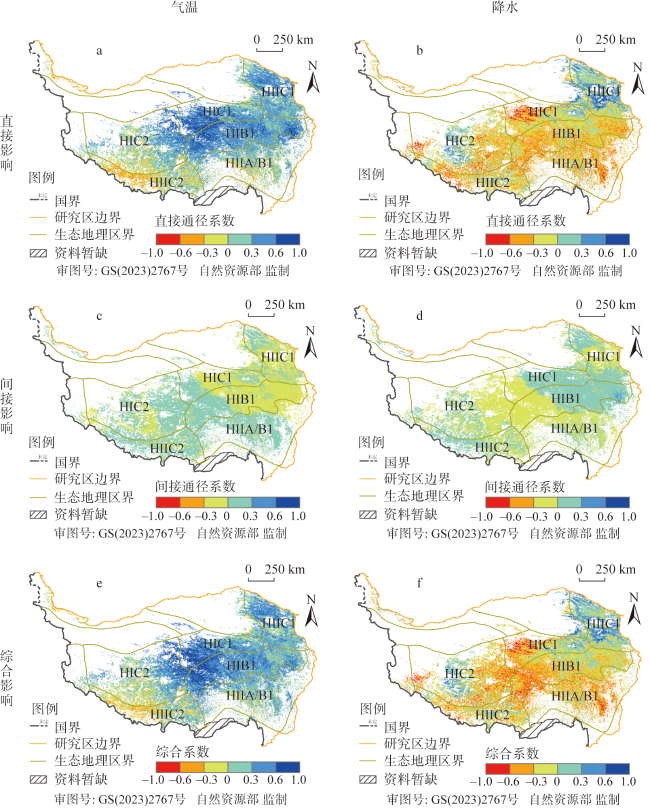
表3 2001—2019年青藏高原气温对草地NEP的影响Table 3 Impact of warming on grassland NEP in the QTP from 2001 to 2019 |
| NEP分类 | 直接影响 | 间接影响 | 综合影响 |
|---|---|---|---|
| 碳源区 | 0.21 | 0.03 | 0.24 |
| 碳汇区 | 0.28 | 0.01 | 0.29 |
| 平均 | 0.25 | 0.02 | 0.27 |
表4 2001—2019年青藏高原降水对草地NEP的影响Table 4 Impact of increased precipitation on grassland NEP in the QTP from 2001 to 2019 |
| NEP分类 | 直接影响 | 间接影响 | 综合影响 |
|---|---|---|---|
| 碳源区 | -0.23 | -0.01 | -0.24 |
| 碳汇区 | -0.17 | 0.01 | -0.14 |
| 平均 | -0.18 | 0 | -0.18 |
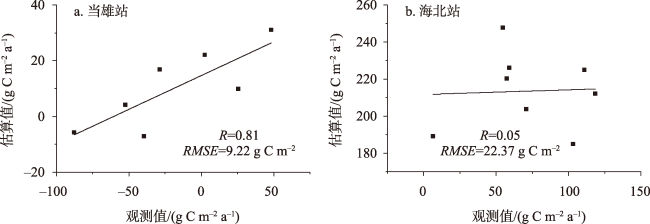
图6 估算NEP值与通量站点观测数据的比较Fig. 6 Comparison of the estimated NEP with observed data from flux sites |
表5 本文估算结果与已发表文献的比较Table 5 Comparison of the results of our study with the published studies |
| [1] |
IPCC.Climate Change 2021: The Physical Science Basis. Cambridge and New York: Cambridge University Press, 2022: 3-32.
|
| [2] |
王利宁, 彭天铎, 向征艰, 等. 碳中和目标下中国能源转型路径分析. 国际石油经济, 2021, 29(1): 2-8.
[
|
| [3] |
刘宇, 羊凌玉, 李欣蓓, 等. 碳中和目标实现下中国转型发展路径研究. 北京理工大学学报: 社会科学版, 2022, 24(4): 27-36.
[
|
| [4] |
LE QUÉRÉ C,
|
| [5] |
|
| [6] |
|
| [7] |
|
| [8] |
杨元合, 石岳, 孙文娟, 等. 中国及全球陆地生态系统碳源汇特征及其对碳中和的贡献. 中国科学: 生命科学, 2022, 52(4): 534-574.
[
|
| [9] |
唐志鹏, 于浩杰, 陈明星, 等. 基于函数极值条件下的中国碳达峰碳中和情景分析. 自然资源学报, 2022, 37(5): 1247-1260.
[
|
| [10] |
刚成诚, 王钊齐, 杨悦, 等. 近百年全球草地生态系统净初级生产力时空动态对气候变化的响应. 草业学报, 2016, 25(11): 1-14.
[
|
| [11] |
陈雪娇, 周伟, 杨晗. 2001—2017年三江源区典型草地群落碳源/汇模拟及动态变化分析. 干旱区地理, 2020, 43(6): 1583-1592.
[
|
| [12] |
|
| [13] |
汪涛, 王晓昳, 刘丹, 等. 青藏高原碳汇现状及其未来趋势. 中国科学: 地球科学, 2023, 53(7): 1506-1516.
[
|
| [14] |
张梅, 黄贤金, 揣小伟, 等. 中国净生态系统生产力空间分布及变化趋势研究. 地理与地理信息科学, 2020, 36(2): 69-74.
[
|
| [15] |
徐冠华, 刘琦岩, 罗晖, 等. 后疫情时代全球气候变化的应对与抉择. 遥感学报, 2021, 25(5): 1037-1042.
[
|
| [16] |
方精云, 柯金虎, 唐志尧, 等. 生物生产力的“4P”概念、估算及其相互关系. 植物生态学报, 2001, 25(4): 414-419.
[
|
| [17] |
|
| [18] |
胡波, 孙睿, 陈永俊, 等. 遥感数据结合Biome-BGC模型估算黄淮海地区生态系统生产力. 自然资源学报, 2011, 26(12): 2061-2071.
[
|
| [19] |
戴尔阜, 黄宇, 吴卓, 等. 内蒙古草地生态系统碳源/汇时空格局及其与气候因子的关系. 地理学报, 2016, 71(1): 21-34.
[
|
| [20] |
|
| [21] |
常顺利, 杨洪晓, 葛剑平. 净生态系统生产力研究进展与问题. 北京师范大学学报: 自然科学版, 2005, 41(5): 517-521.
[
|
| [22] |
|
| [23] |
|
| [24] |
|
| [25] |
赵宁, 周蕾, 庄杰, 等. 中国陆地生态系统碳源/汇整合分析. 生态学报, 2021, 41(19): 7648-7658.
[
|
| [26] |
杨延征, 马元丹, 江洪, 等. 基于IBIS模型的1960—2006年中国陆地生态系统碳收支格局研究. 生态学报, 2016, 36(13): 3911-3922.
[
|
| [27] |
|
| [28] |
黄磊, 贾根锁, 房世波, 等. 地球大数据支撑联合国可持续发展目标: 气候变化与应对. 中国科学院院刊, 2021, 36(8): 923-931.
[
|
| [29] |
朴世龙, 张宪洲, 汪涛, 等. 青藏高原生态系统对气候变化的响应及其反馈. 科学通报, 2019, 64(27): 2842-2855.
[
|
| [30] |
陈舒婷, 郭兵, 杨飞, 等. 2000—2015年青藏高原植被NPP时空变化格局及其对气候变化的响应. 自然资源学报, 2020, 35(10): 2511-2527.
[
|
| [31] |
陈德亮, 徐柏青, 姚檀栋, 等. 青藏高原环境变化科学评估: 过去、现在与未来. 科学通报, 2015, 60(32): 3025-3035.
[
|
| [32] |
段安民, 肖志祥, 吴国雄. 1979—2014年全球变暖背景下青藏高原气候变化特征. 气候变化研究进展, 2016, 12(5): 374-381.
[
|
| [33] |
|
| [34] |
袁巧丽, 杨建. 青藏高原草地植被物候变化及其对气候变化的响应. 中国草地学报, 2021, 43(9): 32-43.
[
|
| [35] |
|
| [36] |
|
| [37] |
张镱锂, 祁威, 周才平, 等. 青藏高原高寒草地净初级生产力 (NPP) 时空分异. 地理学报, 2013, 68(9): 1197-1211.
[
|
| [38] |
许洁, 陈惠玲, 商沙沙, 等. 2000—2014年青藏高原植被净初级生产力时空变化及对气候变化的响应. 干旱区地理, 2020, 43(3): 592-601.
[
|
| [39] |
刘凤, 曾永年. 2000—2015年青海高原植被碳源/汇时空格局及变化. 生态学报, 2021, 41(14): 5792-5803.
[
|
| [40] |
张镱锂, 李炳元, 郑度. 论青藏高原范围与面积. 地理研究, 2002, 21(1): 1-8.
[
|
| [41] |
张镱锂, 李炳元, 刘林山, 等. 再论青藏高原范围. 地理研究, 2021, 40(6): 1543-1553.
[
|
| [42] |
|
| [43] |
孙庆龄, 李宝林, 李飞, 等. 三江源植被净初级生产力估算研究进展. 地理学报, 2016, 71(9): 1596-1612.
[
|
| [44] |
王强, 张廷斌, 易桂花, 等. 横断山区2004—2014年植被NPP时空变化及其驱动因子. 生态学报, 2017, 37(9): 3084-3095.
[
|
| [45] |
|
| [46] |
|
| [47] |
茆杨, 蒋勇军, 张彩云, 等. 近20年来西南地区植被净初级生产力时空变化与影响因素及其对生态工程响应. 生态学报, 2022, 42(7): 2878-2890.
[
|
| [48] |
裴志永, 周才平, 欧阳华, 等. 青藏高原高寒草原区域碳估测. 地理研究, 2010, 29(1): 102-110.
[
|
| [49] |
杨正兰, 张廷斌, 易桂花, 等. 气候变化背景下横断山区植被叶面积指数时空变化特征分析. 长江流域资源与环境, 2021, 30(11): 2670-2681.
[
|
| [50] |
谢舒笛, 莫兴国, 胡实, 等. 三北防护林工程区植被绿度对温度和降水的响应. 地理研究, 2020, 39(1): 152-165.
[
|
| [51] |
杨达, 易桂花, 张廷斌, 等. 青藏高原植被生长季NDVI时空变化与影响因素. 应用生态学报, 2021, 32(4): 1361-1372.
[
|
| [52] |
赵晓涵, 张方敏, 韩典辰, 等. 内蒙古半干旱区蒸散特征及归因分析. 干旱区研究, 2021, 38(6): 1614-1623.
[
|
| [53] |
|
| [54] |
|
| [55] |
周夏飞, 於方, 曹国志, 等. 2001—2015年青藏高原草地碳源/汇时空变化及其与气候因子的关系. 水土保持研究, 2019, 26(1): 76-81.
[
|
| [56] |
任小丽, 何洪林, 张黎, 等. 2001—2010年三江源区草地净生态系统生产力估算. 环境科学研究, 2017, 30(1): 51-58.
[
|
| [57] |
|
| [58] |
汪涛, 朴世龙. 青藏高原陆地生态系统碳汇估算: 进展、挑战与展望. 第四纪研究, 2023, 43(2): 313-323.
[
|
| [59] |
|
| [60] |
|
| [61] |
|
| [62] |
|
/
| 〈 |
|
〉 |