
上海市建设用地与人口变化的关联特征及展望
|
游猎(1986- ),男,四川南部人,博士,副教授,博士生导师,研究方向为区域与城乡发展。E-mail: youlie@sjtu.edu.cn |
收稿日期: 2023-09-18
修回日期: 2023-11-24
网络出版日期: 2024-05-11
基金资助
国家自然科学基金项目(51908350)
国家社会科学基金重大项目(20ZDA085)
Correlation characteristics and prospects of construction land and population changes in Shanghai
Received date: 2023-09-18
Revised date: 2023-11-24
Online published: 2024-05-11
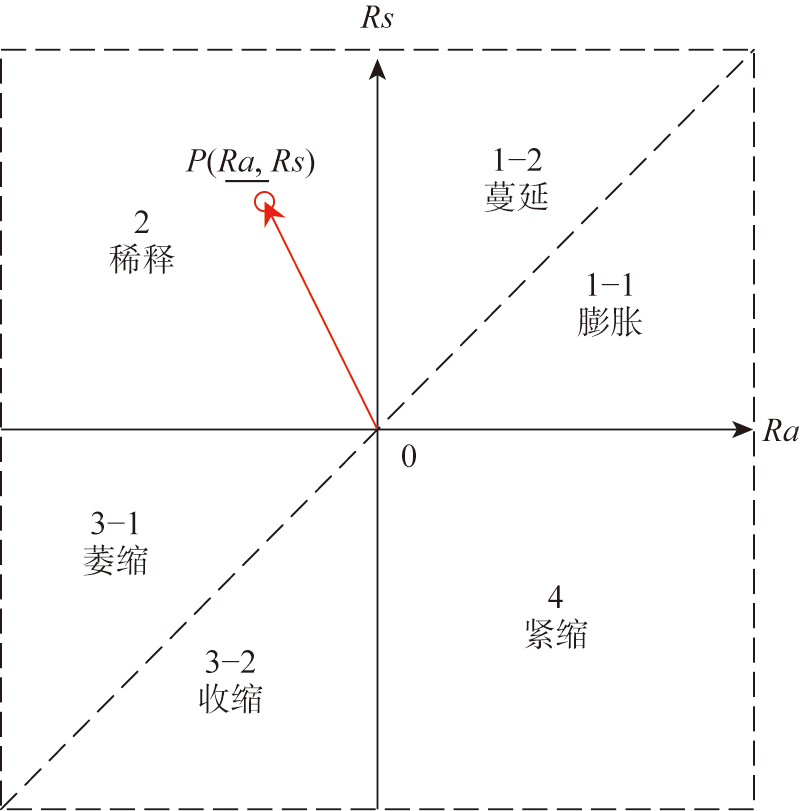
系统研究建设用地与人口的时空耦合关系,是优化调整建设用地与人口政策,提高土地资源利用效率的理论基础。利用1990年以来四次人口普查数据与多时期土地利用遥感监测数据,基于人口—建设用地变化率模型分析1990—2020年间上海市域及16个行政区建设用地面积与人口数量的时空变化特征和耦合关系。研究发现:(1)30年间上海市建设用地和人口均大幅扩张,强度剧烈,呈典型的蔓延特征。(2)全市16个区人口用地变迁同时呈现空间分异和地理邻近特征。(3)在近郊区和远郊区变迁强度先增后减的同时,部分中心城区出现人口用地的减少。研究结果反映出30年来上海市人口用地变化与城市发展呈现出一种“补偿式启动、扩张式发展、收缩式平衡”的阶段性特征。首次提出了变迁强度、弹性等概念和计算方法,并加入地理信息增强结果可视化,为超大城市人地关系提供了评价方法和价值导向,可为相关政策制定和规划编制提供参考。
关键词: 人地关系; 人口—建设用地变化率模型; 人居空间变迁模型; 关联特征; 上海
游猎 , 刘晓琴 , 陈睿山 . 上海市建设用地与人口变化的关联特征及展望[J]. 自然资源学报, 2024 , 39(5) : 1160 -1173 . DOI: 10.31497/zrzyxb.20240511
The systematic study of the spatio-temporal coupling relationship between construction land and population serves as a theoretical basis for optimizing and adjusting policies related to construction land and population, ultimately enhancing the efficiency of land resource utilization. Utilizing four sets of census data since 1990 and multi-temporal land use remote sensing monitoring data, this study analyzes the spatial and temporal changes and coupling relationships between construction land area and population in Shanghai's urban area and its 16 administrative districts from 1990 to 2020, based on the population-construction land change rate model. The research findings are as follows: (1) Over the past 30 years, both construction land and population in Shanghai have expanded significantly, marked by intense change intensities, and exhibiting typical sprawl characteristics. (2) The population and land use changes in all 16 districts of the city simultaneously show spatial differentiation and geographic adjacency features. (3) While the intensity of changes in the suburban and outer suburban areas first increases and then decreases, some central urban areas experience a decrease in both population and land use. The results of the study reflect a phased characteristic of "compensatory initiation, expansive development, and contraction equilibrium" in the population and land use changes in Shanghai over the past 30 years. The study introduces concepts and calculation methods such as change intensity and elasticity for the first time, and incorporates geographic information to enhance result visualization. The research conclusions provide an evaluation method and value orientation for the relationship between people and land in mega-cities, offering reference for relevant policy formulation and planning.
表1 1990—2020年上海市行政区划调整一览表Table 1 Tabulation of administrative division adjustments in Shanghai from 1990 to 2020 |
| 1990—2000年 | 2000—2010年 | 2010—2020年 | 2020年 |
|---|---|---|---|
| — | 2000年黄浦区与南市区合并 | 2011年黄浦区与卢湾区合并 | 黄浦区 |
| — | — | 2015年静安区与闸北区合并 | 静安区 |
| 1992年将上海县华泾镇并入 | — | — | 徐汇区 |
| 1992年划出彭浦乡并入闸北区 | 2005年划出横沙、长兴并入崇明区 | — | 宝山区 |
| 1992年闵行区和上海县(除去华泾镇和三林乡)合并 | — | — | 闵行区 |
| 1992年川沙县与黄浦、南市、杨浦三个区的浦东部分和原上海县三林乡合并成立浦东新区 | 2009年将南汇区并入 | — | 浦东新区 |
| — | 2005年将横沙、长兴并入 | — | 崇明区 |
表2 1990—2020年上海市分区人口与建设用地面积数据Table 2 Population and land area data by subdivision for Shanghai from 1990 to 2020 |
| 行政区 | 人口数/万人 | 建设用地面积/km2 | |||||||
|---|---|---|---|---|---|---|---|---|---|
| 1990年 | 2000年 | 2010年 | 2020年 | 1990年 | 2000年 | 2010年 | 2020年 | ||
| 浦东 | 209.41 | 318.74 | 504.44 | 568.15 | 168.30 | 306.85 | 510.96 | 727.34 | |
| 黄浦 | 141.39 | 90.35 | 67.87 | 66.20 | 18.29 | 18.27 | 18.28 | 18.22 | |
| 徐汇 | 78.42 | 106.46 | 108.51 | 111.31 | 46.55 | 51.67 | 51.83 | 51.71 | |
| 长宁 | 58.54 | 70.22 | 69.06 | 69.31 | 28.39 | 36.53 | 36.85 | 37.21 | |
| 静安 | 119.95 | 110.39 | 107.73 | 97.57 | 35.55 | 36.77 | 36.77 | 36.77 | |
| 普陀 | 79.62 | 105.17 | 128.89 | 123.98 | 42.18 | 52.48 | 54.23 | 55.09 | |
| 虹口 | 87.97 | 86.07 | 85.25 | 75.75 | 22.79 | 22.79 | 22.80 | 22.80 | |
| 杨浦 | 104.88 | 124.38 | 131.32 | 124.25 | 55.40 | 55.40 | 55.40 | 55.26 | |
| 闵行 | 55.45 | 121.73 | 242.94 | 265.35 | 87.38 | 161.89 | 255.64 | 294.37 | |
| 宝山 | 57.41 | 116.48 | 190.49 | 223.52 | 115.12 | 161.01 | 228.46 | 245.53 | |
| 嘉定 | 53.66 | 75.31 | 147.12 | 183.43 | 62.98 | 111.08 | 233.13 | 268.28 | |
| 金山 | 55.41 | 58.04 | 73.24 | 82.28 | 52.32 | 63.45 | 130.88 | 162.82 | |
| 松江 | 51.15 | 64.12 | 158.24 | 190.97 | 60.31 | 98.72 | 219.30 | 282.15 | |
| 青浦 | 46.16 | 59.59 | 108.10 | 127.14 | 59.39 | 81.89 | 160.38 | 218.52 | |
| 奉贤 | 52.67 | 62.43 | 108.35 | 114.09 | 54.79 | 64.41 | 149.06 | 203.85 | |
| 崇明 | 82.10 | 71.29 | 70.37 | 63.79 | 82.40 | 123.48 | 182.50 | 189.98 | |
| 全市 | 1334.19 | 1640.97 | 2302.12 | 2487.29 | 992.14 | 1446.70 | 2346.46 | 2869.90 | |
表3 1990—2020年上海市及分区用地人口变迁状态、强度及弹性Table 3 Land use and population transition status, intensity, and elasticity in Shanghai from 1990 to 2020 (%) |
| 行政区 | 1990—2000年 | 行政区 | 2000—2010年 | 行政区 | 2010—2020年 | ||||||||||||
|---|---|---|---|---|---|---|---|---|---|---|---|---|---|---|---|---|---|
| Ra | Rs | 状态 | 强度↓ | 弹性 | Ra | Rs | 状态 | 强度↓ | 弹性 | Ra | Rs | 状态 | 强度↓ | 弹性 | |||
| 闵行 | 119.53 | 85.26 | 膨胀 | 146.82 | 0.7133 | 松江 | 146.80 | 122.15 | 膨胀 | 190.98 | 0.8321 | 嘉定 | 24.68 | 15.08 | 膨胀 | 28.92 | 0.6111 |
| 宝山 | 102.91 | 39.86 | 110.36 | 0.3874 | 闵行 | 99.57 | 57.91 | 115.18 | 0.5816 | 宝山 | 17.34 | 7.47 | 18.88 | 0.4307 | |||
| 普陀 | 32.09 | 24.42 | 40.33 | 0.7609 | 宝山 | 63.54 | 41.89 | 76.10 | 0.6594 | 浦东 | 12.63 | 42.35 | 蔓延 | 44.19 | 3.3531 | ||
| 徐汇 | 35.76 | 11.01 | 37.42 | 0.3079 | 普陀 | 22.56 | 3.33 | 22.80 | 0.1478 | 青浦 | 17.61 | 36.25 | 40.30 | 2.0581 | |||
| 奉贤 | 18.53 | 17.56 | 25.53 | 0.948 | 徐汇 | 1.92 | 0.29 | 1.95 | 0.1524 | 奉贤 | 5.30 | 36.76 | 37.14 | 6.9372 | |||
| 浦东 | 52.21 | 82.33 | 蔓延 | 97.49 | 1.5768 | 奉贤 | 73.55 | 131.43 | 蔓延 | 150.61 | 1.7869 | 松江 | 20.68 | 28.66 | 35.35 | 1.3857 | |
| 嘉定 | 40.35 | 76.39 | 86.39 | 1.8932 | 嘉定 | 95.36 | 109.87 | 145.49 | 1.1522 | 金山 | 12.34 | 24.41 | 27.35 | 1.9781 | |||
| 松江 | 25.34 | 63.69 | 68.54 | 2.5137 | 青浦 | 81.42 | 95.84 | 125.76 | 1.1771 | 全市 | 8.04 | 22.31 | 23.71 | 2.7731 | |||
| 全市 | 22.98 | 45.82 | 51.26 | 1.9938 | 金山 | 26.20 | 106.26 | 109.44 | 4.0565 | 闵行 | 9.23 | 15.15 | 17.74 | 1.6423 | |||
| 青浦 | 29.09 | 37.88 | 47.76 | 1.3021 | 浦东 | 58.26 | 66.52 | 88.42 | 1.1417 | 长宁 | 0.36 | 0.97 | 1.04 | 2.7096 | |||
| 长宁 | 19.96 | 28.66 | 34.93 | 1.4364 | 全市 | 40.29 | 62.19 | 74.11 | 1.5435 | 虹口 | -11.14 | 0.01 | 稀释 | 11.14 | -0.0005 | ||
| 金山 | 4.74 | 21.28 | 21.80 | 4.4913 | 崇明 | -1.29 | 47.80 | 稀释 | 47.82 | -36.941 | 崇明 | -9.35 | 4.10 | 10.21 | -0.4385 | ||
| 崇明 | -13.16 | 49.85 | 稀释 | 51.56 | -0.4302 | 黄浦 | -24.88 | 0.08 | 24.88 | -0.0031 | 普陀 | -3.81 | 1.60 | 4.13 | -0.4196 | ||
| 静安 | -7.97 | 3.43 | 8.68 | -0.0115 | 长宁 | -1.66 | 0.87 | 1.87 | -0.5221 | 静安 | -9.43 | 0 | 萎缩 | 9.43 | 0 | ||
| 虹口 | -2.15 | 0.02 | 2.15 | -3.7876 | 虹口 | -0.96 | 0.01 | 0.96 | -0.0081 | 杨浦 | -5.38 | -0.25 | 5.39 | 0.0469 | |||
| 黄浦 | -36.10 | -0.11 | 萎缩 | 36.10 | 0.0029 | 静安 | -2.42 | 0 | 萎缩 | 2.42 | 0 | 黄浦 | -2.45 | -0.35 | 2.48 | 0.1424 | |
| 杨浦 | 18.59 | -0.01 | 紧缩 | 18.59 | -0.0005 | 杨浦 | 5.59 | 0 | 紧缩 | 5.59 | -0.0002 | 徐汇 | 2.58 | -0.22 | 紧缩 | 2.59 | -0.0866 |
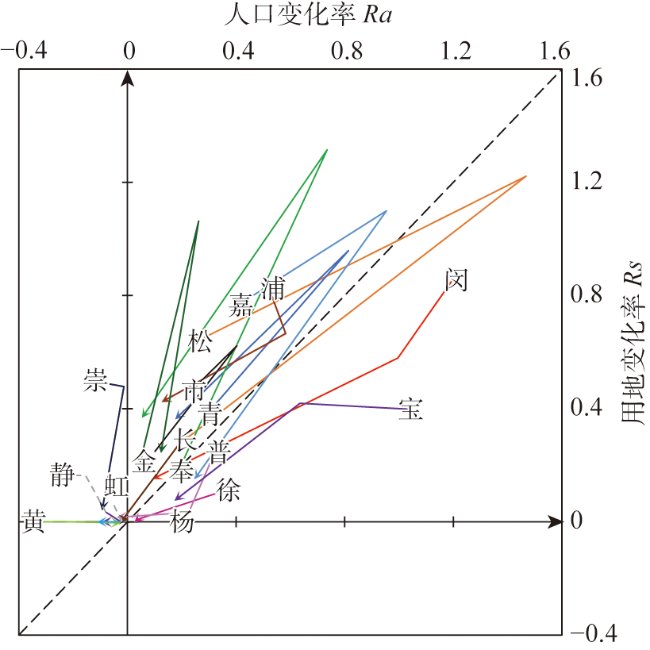
图3 1990—2020年上海市及分区人口用地变化率散点图Fig. 3 Scatter plot of population and land use change rates by subdivision in Shanghai from 1990 to 2020 |
表4 1990—2020年上海市及分区人居空间变迁状态、强度及弹性Table 4 Land use and population transition status, intensity, and elasticity in Shanghai from 1990 to 2020 (%) |
| 行政区 | Ra | Rs | 状态 | 强度↓ | 弹性 |
|---|---|---|---|---|---|
| 闵行 | 378.53 | 236.87 | 膨胀 | 446.54 | 0.6258 |
| 宝山 | 289.37 | 113.28 | 310.75 | 0.3915 | |
| 普陀 | 55.72 | 30.62 | 63.59 | 0.5496 | |
| 徐汇 | 41.93 | 11.09 | 43.38 | 0.2644 | |
| 松江 | 273.32 | 367.86 | 蔓延 | 458.29 | 1.3459 |
| 嘉定 | 241.84 | 326.01 | 405.92 | 1.3480 | |
| 浦东 | 171.32 | 332.18 | 373.76 | 1.9390 | |
| 青浦 | 175.45 | 267.92 | 320.26 | 1.5270 | |
| 奉贤 | 116.61 | 272.08 | 296.02 | 2.3334 | |
| 金山 | 48.48 | 211.20 | 216.69 | 4.3562 | |
| 全市 | 86.41 | 189.26 | 208.06 | 2.1903 | |
| 长宁 | 18.39 | 31.04 | 36.08 | 1.6884 | |
| 崇明 | -22.30 | 130.55 | 132.44 | -5.8546 | |
| 静安 | -18.66 | 3.43 | 稀释 | 18.97 | -0.1837 |
| 虹口 | -13.89 | 0.04 | 13.89 | -0.0027 | |
| 黄浦 | -53.18 | -0.38 | 萎缩 | 53.18 | 0.0071 |
| 杨浦 | 18.47 | -0.26 | 紧缩 | 18.48 | -0.0142 |
| [1] |
邹利林, 章丽君, 梁一凡, 等. 新时代国土空间功能的科学认知与研究框架. 自然资源学报, 2022, 37(12): 3060-3072.
[
|
| [2] |
尹旭, 李裕瑞, 袁涛, 等. 镇域经济发展与土地集约利用水平综合测度及其关联特征分析: 以江苏省109个抽样乡镇为例. 自然资源学报, 2020, 35(3): 614-625.
[
|
| [3] |
《上海统计年鉴》编辑委员会. 上海统计年鉴(2021). 北京:中国统计出版社, 2021: 4-5.
[ Editorial Committee of Shanghai Statistical. Shanghai Statistical Yearbook (2021). Beijing: China Statistical Publishing House, 2021: 4-5.]
|
| [4] |
刘纪远, 宁佳, 匡文慧, 等. 2010—2015年中国土地利用变化的时空格局与新特征. 地理学报, 2018, 73(5): 789-802.
[
|
| [5] |
李晓文, 方精云, 朴世龙. 上海城市用地扩展强度、模式及其空间分异特征. 自然资源学报, 2003, 18(4): 412-422.
[
|
| [6] |
张心怡, 刘敏, 孟飞. 基于RS和GIS的上海城建用地扩展研究. 长江流域资源与环境, 2006, 15(1): 29-33.
[
|
| [7] |
|
| [8] |
|
| [9] |
廖邦固, 徐建刚, 韩雪培, 等. 1990—2000年上海中心城区人口密度模拟与时空变化分析. 华东师范大学学报: 自然科学版, 2008, (4): 130-139.
[
|
| [10] |
|
| [11] |
|
| [12] |
陶纪明, 徐珺, 浦亦稚. 上海人地关系现状、情景与对策研究. 上海经济研究, 2013, (4): 109-118.
[
|
| [13] |
刘乃全, 耿文才. 上海市人口空间分布格局的演变及其影响因素分析: 基于空间面板模型的实证研究. 财经研究, 2015, 41(2): 99-110.
[
|
| [14] |
李裕瑞, 刘彦随, 龙花楼. 中国农村人口与农村居民点用地的时空变化. 自然资源学报, 2010, 25(10): 1629-1638.
[
|
| [15] |
王婧, 方创琳, 李裕瑞. 中国城乡人口与建设用地的时空变化及其耦合特征研究. 自然资源学报, 2014, 29(8): 1271-1281.
[
|
| [16] |
吴一凡, 刘彦随, 李裕瑞. 中国人口与土地城镇化时空耦合特征及驱动机制. 地理学报, 2018, 73(10): 1865-1879.
[
|
| [17] |
刘继来, 刘彦随, 李裕瑞, 等. 2007—2015年中国农村居民点用地与农村人口时空耦合关系. 自然资源学报, 2018, 33(11): 1861-1871.
[
|
| [18] |
张飞, 孔伟. 我国土地城镇化的时空特征及机理研究. 地域研究与开发, 2014, 33(5): 144-148.
[
|
| [19] |
郄瑞卿. 中国城市人口与城市建设用地的时空变化. 城市规划, 2014, 38(5): 22-28.
[
|
| [20] |
刘燕, 杨庆媛, 何星. 重庆农村居民点用地与农村人口变化耦合关系研究. 农业工程学报, 2019, 35(15): 266-274.
[
|
| [21] |
路昌, 周浩. 城市人口与建设用地空间格局及耦合特征分析. 城市问题, 2020, (5): 28-37.
[
|
| [22] |
赵民, 游猎, 陈晨. 论农村人居空间的“精明收缩”导向和规划策略. 城市规划, 2015, 39(7): 9-18, 24.
[
|
| [23] |
游猎, 赵民. 中国农村人居空间变迁探索:精明收缩规划理论与实践. 北京: 中国建筑工业出版社, 2020.
[
|
| [24] |
游猎, 陈晨. 农村人居空间“精明收缩”的实践探索: 以Q市全域农村新型社区总体规划实施为例. 城市规划, 2018, 42(4): 113-118.
[
|
| [25] |
游猎. 农村人居空间的“收缩”和“精明收缩”之道: 实证分析、理论解释与价值选择. 城市规划, 2018, 42(2): 61-69.
[
|
| [26] |
游猎. 中国农村人居空间变迁态势及“精明收缩”概念诠释与规划框架研究. 上海: 同济大学, 2017.
[
|
| [27] |
李红波, 刘美豆, 胡晓亮, 等. 精明收缩视角下乡村人居空间变化特征及类型划分: 以江苏省常熟市为例. 地理研究, 2020, 39(4): 939-955.
[
|
| [28] |
吴菊, 郑俊, 张峰松. 2009年以来苏南地区乡村聚落空间变化特征与影响因素研究: 以常熟市为例. 杭州师范大学学报: 自然科学版, 2022, 21(2): 204-212.
[
|
| [29] |
李弘正, 王婧, 汪涛, 等. 常州市武进区乡村建设用地的渐进式整理策略. 规划师, 2020, 36(23): 82-89.
[
|
| [30] |
吴传钧. 论地理学的研究核心: 人地关系地域系统. 经济地理, 1991, 11(3): 1-6.
[
|
| [31] |
徐新良, 刘纪远, 张树文, 等. 中国多时期土地利用土地覆被遥感监测数据集 (CNLUCC). 中国科学院资源环境科学数据中心数据注册与出版系统, 2018, http://www.resdc.cn.
[
|
| [32] |
刘纪远, 宁佳, 匡文慧, 等. 2010—2015年中国土地利用变化的时空格局与新特征. 地理学报, 2018, 73(5): 789-802.
[
|
| [33] |
万勇. 上海旧区改造三十年: 中国式现代化进程的样本、缩影与宝贵经验, https://www.jfdaily.com/news/detail?id=517577, 2022-08-15.
[
|
| [34] |
叶继涛. 上海PPP实践探索及启示建议. 中国招标, 2016, (10): 7-11.
[
|
| [35] |
田莉, 陶然. 土地改革、住房保障与城乡转型发展: 集体土地建设租赁住房改革的机遇与挑战. 城市规划, 2019, 43(9): 53-60.
[
|
/
| 〈 |
|
〉 |


