
基于生态安全格局的东北典型黑土区生态保护红线划定与优化
|
冯琳(1997- ),女,黑龙江伊春人,博士研究生,研究方向为土地利用规划与管理。E-mail: 2210008@stu.neu.edu.cn |
收稿日期: 2023-07-03
修回日期: 2023-08-20
网络出版日期: 2024-01-24
基金资助
国家自然科学基金项目(41671520)
Research on the delineation and optimization of ecological protection redline based on the perspective of ecological security pattern in typical black soil areas of Northeast China
Received date: 2023-07-03
Revised date: 2023-08-20
Online published: 2024-01-24
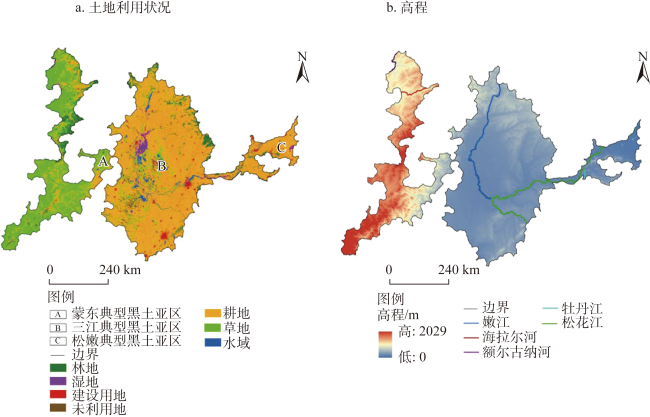
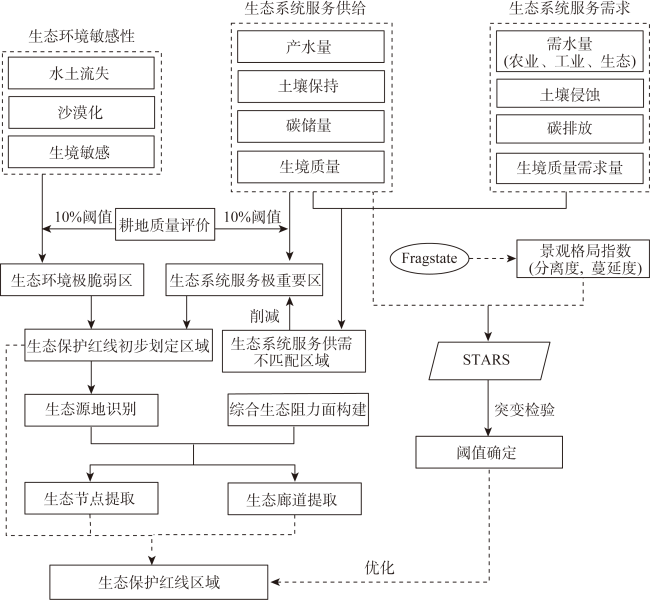
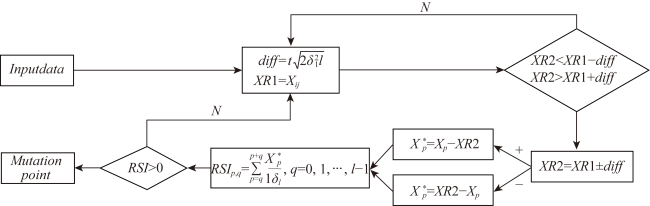
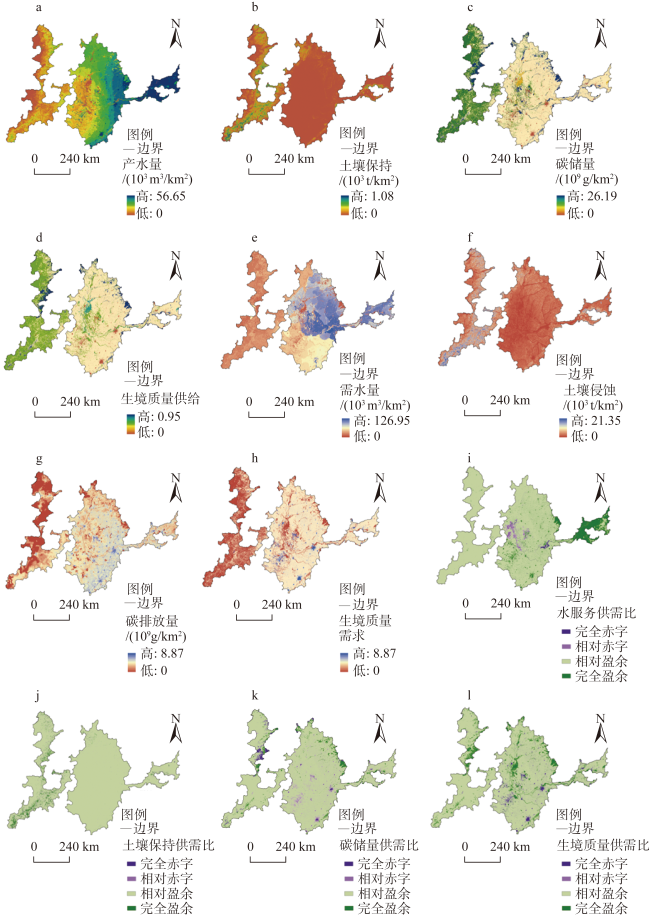
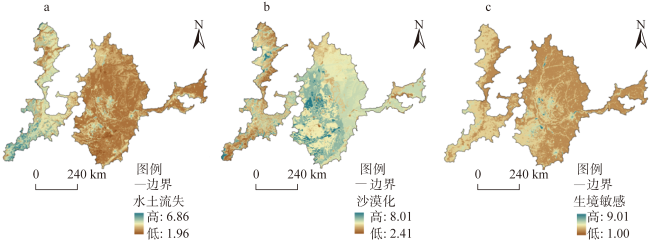
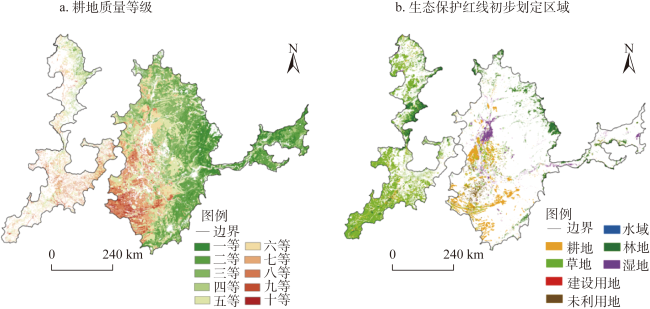
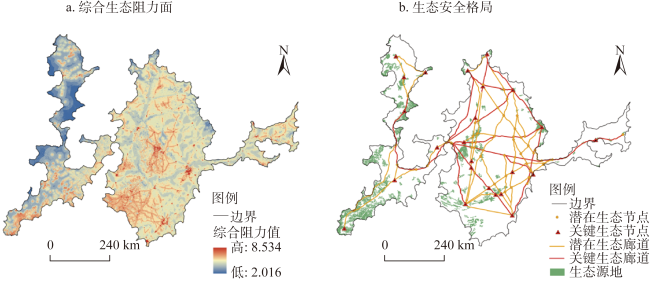
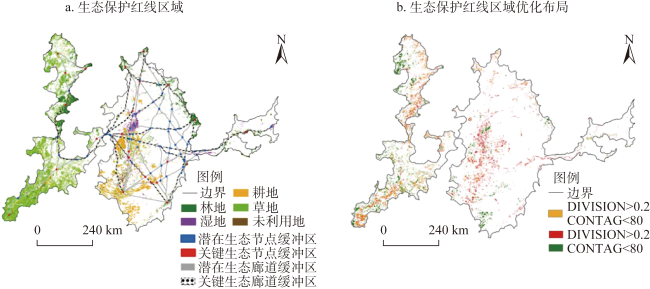
东北典型黑土区面临生态系统服务功能退化、景观格局破碎以及农业与生态空间冲突等问题,科学制定具有指导性的黑土区生态保护红线划定与优化框架,对于保障粮食安全与生态安全具有重要意义。基于生态安全格局视角明晰生态保护红线内涵,在考虑生态保护重要性、农业与生态空间协调、自然与社会系统协调的基础上,提出“点—线—面”多层次空间要素的系统性生态保护红线划定思路,考虑生态系统完整性与连通性识别生态保护红线优化区域。结果表明:(1)在保障不划入优质耕地的前提下(阈值为10%),叠加生态系统服务极重要区、生态环境极敏感区、生态系统服务供需不匹配区域确定生态保护红线初步划定区域69646.00 km2,并提取生态源地34760.16 km2;(2)基于生态源地与构建的综合生态阻力面识别生态廊道10980.90 km与生态节点77个,其缓冲区与生态保护红线初步划定区域共同构成生态保护红线区域76234.54 km2;(3)基于破碎度(0.20)和连通度(80)优化阈值,25.48%的生态保护红线区域亟需优化。研究结果提高了生态保护红线划定与优化的科学性和系统性,为东北典型黑土区国土空间精准管控与生态系统可续性管理提供重要依据,且对土地高度集约化利用、生态空间稀缺的中小尺度区域具有重要指导意义。

冯琳 , 雷国平 . 基于生态安全格局的东北典型黑土区生态保护红线划定与优化[J]. 自然资源学报, 2024 , 39(2) : 426 -445 . DOI: 10.31497/zrzyxb.20240212
The typical black soil areas of Northeast China is facing problems such as degradation of ecosystem service functions, fragmented landscape patterns and conflicts between agriculture and ecological space. The scientific formulation of guiding framework for the delineation and optimization of ecological protection redline in black soil areas is of great significance in ensuring food security and ecological safety. This study clarified the meaning of ecological protection redline based on the perspective of ecological security pattern, and proposed the idea of systemic ecological protection redline delineation based on the importance of ecological protection, coordination of agriculture and ecological space, and coordination of natural and social system, and identified ecological protection redline optimization areas by considering the fragmentation and connectivity of ecosystem. The results show that: (1) On the premise of guaranteeing that no high-quality cropland was allocated (the threshold value was 10%), 69646.00 km2 of the preliminary delineation area of the ecological protection redline were determined by overlaying extremely important areas for ecosystem services, extremely sensitive areas for ecological environment, and areas with mismatch between supply and demand of ecosystem services, and extracting 34760.16 km2 of ecological source land; (2) A total of 10980.90 km2 of ecological corridors and 77 ecological nodes were identified based on the ecological source and construction of a comprehensive ecological resistance surface, and their buffer zones and ecological protection areas together constituted an ecological protection redline area of 76234.54 km2; (3) Based on the optimization thresholds of fragmentation (0.20) and connectivity (80), approximately 25.48% of the ecological redline area was in urgent need of optimization. The results of the study improve the scientific and systematic nature of ecological protection redline delineation and optimization, and provide an important basis for the precise control of land space and strengthening ecosystem sustainability management in typical black soil areas of Northeast China, as well as important guidance for small and medium-scale regions with highly intensive land use and scarce ecological space.
表1 生态系统服务供给与需求计算公式表Table 1 Equations of calculating supplies and demands of ecosystem services |
| ES | 供/需 | 方法 | 公式 | 备注 |
|---|---|---|---|---|
| 产水量 /(m3/km2) | 供 | 基于水量平衡法的InVEST模型 产水模块[27] | 为栅格单元x上的水生产服务供给量(mm); 为土地利用类型j上栅格单元x的年均蒸散量(mm); 为栅格单元x的年均降水量(mm) | |
| 需 | 实际用水量[28] | 为栅格单元x上的水生产服务需求量(m3/km2); 为农业用水量(m3/km2); 为工业用水量(m3/km2); 为生活用水量(m3/km2); 为生态用水量(m3/km2) | ||
| 土壤保持 /(103 t/km2) | 供 | InVEST模型土壤保持模块[27] | 为栅格单元x上的土壤保持供给量(103 t/km2); 为降雨侵蚀力因子; 为土壤可侵蚀因子; 为坡长坡度因子,无量纲; 为植被覆盖因子,无量纲; 为水土保持因子,无量纲 | |
| 需 | 修正的土壤流失通用方程[2] | 为栅格单元x上的土壤保持服务需求量(103 t/km2) | ||
| 碳储量 /(109 g/km2) | 供 | InVEST模型 碳固持模块[27] | 为栅格单元x上的碳固持服务需求量(109 g/km2); 、 、 、 分别代表地上物质、地下物质、土壤碳储量、枯枝落叶碳储量(109 g/km2) | |
| 需 | 碳排放量[29] | 为栅格单元x上的碳固持服务需求量(109 g/km2); 为人均碳排放量(109 g/人); 为栅格单元x人口密度(人/km2) | ||
| 生境质量 | 供 | InVEST模型 生境质量模块[27] | 为栅格单元x的生境质量服务供给量; 为土地利用类型j中生境适宜度; 为土地利用类型j中栅格x的生境退化度; 为半饱和参数 | |
| 需 | 生境质量需求[30] | 为栅格单元x的生境质量服务需求量; 为生境质量平均水平; 为栅格单元x的生境质量供给量 |
表2 耕地质量评价指标体系Table 2 Cultivated land quality evaluation index system |
| 准则层 | 指标层 | 权重 | 得分 | ||||||||||
|---|---|---|---|---|---|---|---|---|---|---|---|---|---|
| 0 | 10 | 20 | 30 | 40 | 50 | 60 | 70 | 80 | 90 | 100 | |||
| 自然 条件 | 降水 /mm | 0.1117 | <300 | 300~350 | 350~400 | 400~450 | 450~500 | 500~550 | 550~600 | 600~650 | 650~700 | 700~750 | >750 |
| 积温 /103 ℃ | 0.1076 | >12 | 12~14 | 14~16 | 16~18 | 18~20 | 20~22 | 22~24 | 24~26 | 26~28 | 28~30 | >30 | |
| 坡度/(°) | 0.0928 | >25 | 15~25 | 6~15 | 2-6 | <2 | |||||||
| 有效土层厚度/cm | 0.0772 | <30 | 30~40 | 40~50 | 50~60 | 60~70 | 70~80 | 80~90 | >90 | ||||
| 土壤 条件 | 土壤质地 | 0.0845 | 基岩 | 粘质 | 砾质 | 壤质 | |||||||
| pH | 0.0676 | >9 | 8.5~9.0 | 8.0~8.5 | 7.5~8.0 | 7.0~7.5 | 6.5~7.0 | ||||||
| 有机质/(g/kg) | 0.1136 | <10 | 10~15 | 15~20 | 20~30 | 30~40 | >40 | ||||||
| 土壤容重 | 0.0596 | >1.4 | 1.3~1.4 | 1.2~1.3 | 1.1~1.2 | 1.0~1.1 | <1.0 | ||||||
| 土壤利用水分 | 0.0767 | <0.1 | 0.1~0.2 | 0.2~0.3 | 0.3~0.4 | 0.4~0.5 | >0.5 | ||||||
| 土壤 管理 | 灌溉能力 | 0.1174 | 无 | 一般 | 良好 | 极好 | |||||||
| 排水能力 | 0.0913 | 无 | 一般 | 良好 | 极好 | ||||||||
表3 数据说明Table 3 Data description |
| 数据类型 | 数据名称 | 分辨率 | 数据来源 |
|---|---|---|---|
| 气象数据 | 月降水 | 1 km | the National Earth System Science Data Center(http://www.geodata.cn) |
| 月潜在蒸散量 | |||
| 土壤数据 | 根系深度 | 1 km | the Harmonized World Dataset ver 1.2 of the National Tibetan Plateau Third Pole Enviornment Data Center(http://data.tpdc.ac.cn/) |
| 土壤质地 | |||
| 有机碳 | |||
| 土壤容重 | |||
| 遥感数据 | DEM数据 | 30 m | NASA Earthdata Center (https://earthdata.nasa.gov/) |
| NDVI数据 | 250 m | MOD13Q1 of Land Process Distributed Active Archive Centre (https://lpdaac.usgs.gov/) | |
| 社会经济数据 | 人口数据 | 1 km | the Data Center for Resources and Enviornment Sciences of the Chinese Academy of Sciences (http://www.resdc.cn) |
| GDP数据 | |||
| 道路数据 | — | the National Earth System Science Data Center (http://www.geodata.cn) | |
| 河流数据 |
| [1] |
邵宇婷, 肖轶, 桑卫国. 南方丘陵地区生态系统服务变化对国土空间规划的指示意义. 生态学报, 2022, 42(21): 8702-8712.
[
|
| [2] |
|
| [3] |
|
| [4] |
姚岚, 丁庆龙, 俞振宁, 等. 生态保护红线研究评述及框架体系构建. 中国土地科学, 2019, 33(7): 11-18.
[
|
| [5] |
|
| [6] |
|
| [7] |
|
| [8] |
中华人民共和国生态环境部. 生态保护红线划定指南. www mee.gov.cn/gkml/hbb/bgt/201707/t20170728_418679.html(2017-07-20/2021-10-10).
[ Ministry of Ecology and Enviornment of the People's Republic of China. Technical guidelines for the delineation of ecological protection redline. www mee.gov.cn/gkml/hbb/bgt/201707/t20170728_418679.html(2017-07-20/2021-10-10).]
|
| [9] |
孔令桥, 王雅晴, 郑华, 等. 流域生态空间与生态保护红线规划方法: 以长江流域为例. 生态学报, 2019, 39(3): 835-843.
[
|
| [10] |
范小杉, 高吉喜, 何萍, 等. 基于生态安全问题的生态保护红线管控方案. 中国环境科学, 2018, 38(12): 4749-4754.
[
|
| [11] |
马克明, 傅伯杰, 黎晓亚, 等. 区域生态安全格局: 概念与理论基础. 生态学报, 2004, 24(4): 761-768.
[
|
| [12] |
傅伯杰. 国土空间生态修复亟待把握的几个要点. 中国科学院院刊, 2021, 36(1): 64-69.
[
|
| [13] |
俞孔坚. 生物保护的景观生态安全格局. 生态学报, 1999, 19(1): 10-17.
[
|
| [14] |
彭建, 赵会娟, 刘焱序, 等. 区域生态安全格局构建研究进展与展望. 地理研究, 2017, 36(3): 407-419.
[
|
| [15] |
马晓武, 徐昔保. 区域尺度生态保护红线连通性优化与管控: 以长三角为例. 自然资源学报, 2022, 37(12): 3088-3101.
[
|
| [16] |
李玉恒, 黄惠倩, 郭桐冰, 等. 多重压力胁迫下东北黑土区耕地韧性研究及其启示: 以黑龙江省拜泉县为例. 中国土地科学, 2022, 36(5): 71-79.
[
|
| [17] |
张佳宝, 孙波, 朱教君, 等. 黑土地保护利用与山水林田湖草沙系统的协调及生态屏障建设战略. 中国科学院院刊, 2021, 36(10): 1155-1164.
[
|
| [18] |
|
| [19] |
|
| [20] |
王子琳, 李志刚, 方世明. 基于遗传算法和图论法的生态安全格局构建与优化: 以武汉市为例. 地理科学, 2022, 42(10): 1685-1694.
[
|
| [21] |
陈立顶, 傅伯杰, 赵文武. “源”“汇”景观理论及其生态学含义. 生态学报, 2006, 26(5): 1444-1449.
[
|
| [22] |
|
| [23] |
赵诚诚, 潘竟虎. 基于供需视角的黄河流域甘肃段生态安全格局识别与优化. 生态学报, 2022, 42(17): 6973-6984.
[
|
| [24] |
刘宝元, 张甘霖, 谢云, 等. 东北黑土区和东北典型黑土区的范围与划界. 科学通报, 2021, 66(1): 96-106.
[
|
| [25] |
|
| [26] |
|
| [27] |
|
| [28] |
王壮壮, 张立伟, 李旭谱, 等. 区域生态系统服务供需风险时空演变特征: 以陕西省产水服务为例. 生态学报, 2020, 40(6): 1887-1900.
[
|
| [29] |
|
| [30] |
杨宜男, 李敬, 王立, 等. 长三角地区城市化对典型生态系统服务供需的影响. 自然资源学报, 2022, 37(6): 1555-1571.
[
|
| [31] |
赵雪雁, 马平易, 李文青, 等. 黄土高原生态系统服务供需关系的时空变化. 地理学报, 2021, 76(11): 2780-2796.
[
|
| [32] |
刘军会, 高吉喜, 马苏, 等. 内蒙古生态环境敏感性综合评价. 中国环境科学, 2015, 35(2): 591-598.
[
|
| [33] |
|
| [34] |
|
| [35] |
卫新东, 林良国, 冯小龙, 等. 神木市生态安全格局构建与生态问题定量诊断. 生态学报, 2023, 43(1): 1-13.
[
|
| [36] |
|
| [37] |
|
| [38] |
|
| [39] |
|
| [40] |
|
| [41] |
高歆. 基于线性GSI二维半变异函数各向异性结构建模及估计研究: 以DEM数据为例. 地理研究, 2020, 39(11): 2607-2625.
[
|
| [42] |
|
| [43] |
|
| [44] |
|
| [45] |
|
| [46] |
于成龙, 刘丹, 冯锐, 等. 基于最小累积阻力模型的东北地区生态安全格局构建. 生态学报, 2021, 41(1): 290-301.
[
|
| [47] |
杨志鹏, 许嘉巍, 冯兴华, 等. 基于InVEST模型的东北地区土地利用变化对生境的影响研究. 生态科学, 2018, 37(6): 139-147.
[
|
| [48] |
|
| [49] |
|
| [50] |
|
| [51] |
|
| [52] |
|
/
| 〈 |
|
〉 |