
“国家的碳源”抑或“国家的碳汇”?——基于武夷山国家公园碳均衡分析
|
曹辉(1973- ),男,福建长汀人,博士,副教授,研究方向为生态旅游。E-mail: fjch2000@gmail.com |
收稿日期: 2022-02-01
修回日期: 2022-07-11
网络出版日期: 2023-04-11
基金资助
国家社会科学基金项目(19BJY204)
"National carbon source" or "national carbon sink"?Based on the carbon balance analysis of Wuyi Mountain National Park
Received date: 2022-02-01
Revised date: 2022-07-11
Online published: 2023-04-11
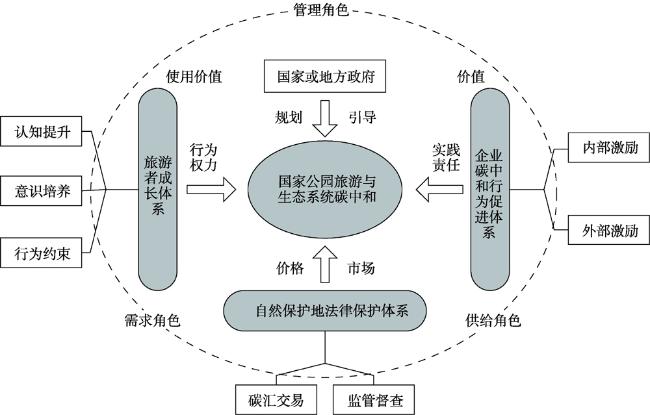
以国家公园为主体的自然保护地体系是中国陆地和海洋生态系统碳汇的重要来源。利用生命周期评估(LCA法)和武夷山国家公园GIS平台数据,研究了武夷山国家公园全周期旅游碳足迹测算、不同土地类型的碳吸存能力、碳源碳汇的路径和均衡、碳中和策略等四个方面内容,结果表明:(1)2019年国家公园总碳排放为2864481.86 t,其中旅游碳足迹为2836467.58 t,交通、餐饮和住宿是碳足迹最高的三个环节;(2)2019年国家公园碳吸存量为126862.61 t,乔木林地、竹林地、灌木林地是碳吸存能力最高的三种土地类型;(3)国家公园区内可实现碳中和,净碳汇值为88241.86 t,综合全生命周期结果却是显著的碳源,碳吸排比为4.48%,净碳源值为2737619.25 t;(4)构建游客、企业和法律三方面体系是国家公园重要的碳中和路径选择。
曹辉 , 吴慧珍 , 沈珊珊 , 詹欣滢 , 闫淑君 . “国家的碳源”抑或“国家的碳汇”?——基于武夷山国家公园碳均衡分析[J]. 自然资源学报, 2023 , 38(4) : 934 -950 . DOI: 10.31497/zrzyxb.20230407
The nature reserve system, mainly national parks, is an important source of carbon sinks for China's terrestrial and marine ecosystems. Taking the Wuyi Mountain National Park tourism-ecosystem as the main research object, using a bottom-up approach and the whole life cycle (lca) tourism carbon footprint analysis method, and using data from the national park's land geographic information system (GIS) platform, we focused on the Wuyi Mountain National Park's full-cycle carbon footprint measurement, the carbon sequestration capacity and analysis of different land types, the carbon source and carbon sink. The results show that: (1) The total carbon emission of the national park in 2019 was 2864481.86 t, of which the carbon footprint of tourism was 2836467.58 t. Transportation, catering and accommodation were the three segments with the highest carbon footprint, accounting for 65.28%, 28.58% and 3.04% respectively, and the overall carbon emission of tourism in general showed a more obvious upward trend between 2015 and 2019, but the growth rate of carbon emissions was not entirely consistent with the trend of changes in the growth of the number of tourists. (2) The carbon sequestration in national parks in 2019 was 126862.61 t. Tree woodland, bamboo woodland and shrub woodland were the three land types with the highest carbon sequestration capacity, at 103664.98 t, 219035.11 t and 1054.87 t, hard broad species and horsetail pine are the forest types with the most important carbon sink capacity. (3) Wuyi Mountain National Park tourism-ecosystem is a carbon sink with an average annual net carbon sink of 88241.86 t. However, the national park is a significant carbon source based on the analysis of the whole life cycle results, with the ratio of ecosystem carbon uptake to total carbon emission of 4.48% and the net carbon source value of 2737619.25 t. The carbon footprint efficiency of ecotourism in national parks in 2019 was 12698.28 yuan/t, which is a high efficiency level globally. (4) Building a tourist growth system, developing a carbon neutral behaviour promotion system for enterprises and improving the legal protection system for nature reserves are important carbon neutrality path options for national parks.
Key words: national park; carbon source; carbon sink; carbon balance; Wuyi Mountains
表1 能源强度系数Table 1 Energy intensity coefficient |
| 年份 | 2015 | 2016 | 2017 | 2018 | 2019 |
|---|---|---|---|---|---|
| 第三产业 | 0.2868 | 0.2708 | 0.2451 | 0.2376 | 0.2298 |
| 交通运输业 | 0.6855 | 0.6596 | 0.6373 | 0.9352 | 0.9362 |
| 住宿餐饮业 | 0.7097 | 0.7244 | 0.7175 | 0.6200 | 0.6266 |
注:数据来源于2016—2020年《福建省统计年鉴》。 |
表2 不同等级酒店的碳足迹量表Table 2 Carbon footprint scale for different classes of hotels |
| 等级 | 床位数/个 | 平均出租率/% | 每床耗能量/MJ | 能源消耗的CO2因子/(kg/MJ) | 可循环用品碳排放/t | 一次性用品碳排放/t | 住宿碳足迹/t |
|---|---|---|---|---|---|---|---|
| 五星级 | 970 | 65 | 150 | 11.51 | 4.60 | 5487.51 | |
| 四星级 | 2466 | 75 | 70 | 0.1585 | 33.75 | 13.50 | 7537.13 |
| 三星级及以下 | 40007 | 79 | 40 | 576.80 | 230.72 | 73945.88 | |
| 总计 | 43443 | 73 | 86970.52 |
表3 武夷山旅游者外部交通碳排放量表Table 3 Carbon emission statistics for external transportation of tourists in Wuyi Mountains |
| 省份 | 航空 | 火车 | 汽车 | 私家车 | 总碳排放量/t | 人均碳排放/kg | ||||||||
|---|---|---|---|---|---|---|---|---|---|---|---|---|---|---|
| 航线距离/km | 碳排放量/t | 路程距离/km | 碳排放量/t | 路程距离/km | 碳排放量/t | 路程距离/km | 碳排放量/t | |||||||
| 江西 | 237 | 0 | 314 | 1029.91 | 309 | 5568.99 | 309 | 7202.55 | 13801.45 | 20.91 | ||||
| 福建 | 232 | 1319.17 | 304 | 3768.70 | 348 | 16658.07 | 348 | 21544.44 | 43290.38 | 22.65 | ||||
| 浙江 | 500 | 94885.16 | 495 | 6183.27 | 438 | 28919.52 | 438 | 37402.58 | 167390.55 | 65.79 | ||||
| 安徽 | 462 | 0 | 776 | 1747.90 | 625 | 6379.96 | 625 | 8251.41 | 16379.27 | 42.03 | ||||
| 湖北 | 932 | 27833.45 | 651 | 1297.99 | 658 | 3874.34 | 658 | 5010.81 | 38016.59 | 136.52 | ||||
| 江苏 | 481 | 40186.32 | 998 | 6882.33 | 709 | 10304.77 | 709 | 13327.50 | 70700.92 | 87.51 | ||||
| 湖南 | 496 | 21324.30 | 674 | 1934.60 | 647 | 5484.26 | 647 | 7092.98 | 35836.15 | 86.48 | ||||
| 上海 | 600 | 169114.34 | 679 | 6388.63 | 611 | 25330.77 | 611 | 32761.14 | 233594.89 | 118.32 | ||||
| 广东 | 650 | 37793.73 | 1079 | 9696.29 | 945 | 10902.04 | 945 | 14099.97 | 72492.03 | 95.92 | ||||
| 河南 | 952 | 0 | 1289 | 8599.39 | 1245 | 24528.22 | 1245 | 31723.17 | 64850.79 | 76.62 | ||||
| 山东 | 978 | 86541.03 | 1843 | 10922.44 | 1250 | 22224.17 | 1250 | 28743.26 | 148430.90 | 172.91 | ||||
| 广西 | 819 | 0 | 1549 | 2080.49 | 1070 | 4244.04 | 1070 | 5488.95 | 11813.48 | 69.70 | ||||
| 陕西 | 1153 | 0 | 1551 | 10788.50 | 1386 | 0 | 1386 | 0 | 10788.50 | 40.71 | ||||
| 贵州 | 1138 | 0 | 1498 | 1316.03 | 1406 | 624.10 | 1406 | 807.17 | 2747.31 | 57.17 | ||||
| 重庆 | 1142 | 0 | 1982 | 1473.18 | 1544 | 1721.44 | 1544 | 2226.39 | 5421.01 | 86.79 | ||||
| 海南 | 1168 | 4596.68 | 1760 | 462.44 | 1539 | 0 | 1539 | 0 | 5059.12 | 289.66 | ||||
| 河北 | 1205 | 0 | 1607 | 12047.68 | 1530 | 0 | 1530 | 0 | 12047.68 | 42.18 | ||||
| 山西 | 1237 | 0 | 1838 | 23496.53 | 1590 | 0 | 1590 | 0 | 23496.53 | 48.25 | ||||
| 天津 | 1266 | 108685.43 | 1566 | 0 | 1553 | 0 | 1553 | 0 | 108685.43 | 577.85 | ||||
| 北京 | 1383 | 354350.59 | 1763 | 29560.77 | 1649 | 0 | 1649 | 0 | 383911.36 | 338.76 | ||||
| 四川 | 1396 | 11231.88 | 1949 | 7286.07 | 1848 | 2987.46 | 1848 | 3863.78 | 25369.18 | 128.64 | ||||
| 黑龙 | 2159 | 36024.91 | 2982 | 11420.72 | 2712 | 0 | 2712 | 0 | 47445.63 | 305.07 | ||||
| 云南 | 1547 | 5816.16 | 2157 | 2681.73 | 1906 | 1439.80 | 1906 | 1862.14 | 11799.83 | 161.18 | ||||
| 内蒙 | 1592 | 0 | 2174 | 3421.89 | 2027 | 0 | 2027 | 0 | 3421.89 | 57.07 | ||||
| 宁夏 | 1623 | 0 | 2592 | 1813.26 | 2111 | 0 | 2111 | 0 | 1813.26 | 68.04 | ||||
| 甘肃 | 1628 | 33014.65 | 1998 | 7971.44 | 2037 | 0 | 2037 | 0 | 40986.09 | 225.10 | ||||
| 辽宁 | 2044 | 70780.85 | 2442 | 19409.59 | 2160 | 0 | 2160 | 0 | 90190.44 | 281.32 | ||||
| 青海 | 1822 | 14885.98 | 2185 | 1195.62 | 2276 | 0 | 2276 | 0 | 16081.59 | 444.49 | ||||
| 吉林 | 1905 | 0 | 2596 | 27881.64 | 2458 | 0 | 2458 | 0 | 27881.64 | 68.15 | ||||
| 香港 | 727 | 85478.96 | 0 | 0 | 0 | 0 | 0 | 0 | 85478.96 | 331.83 | ||||
| 合计 | 1203863.62 | 222759.03 | 171191.95 | 221408.25 | 1819222.85 | 71.74 | ||||||||
| 比例/% | 66.17 | 12.24 | 9.41 | 12.17 | 100.00 | |||||||||
表4 国家公园碳排放汇总表Table 4 Summary of carbon emissions from national parks |
| 类别 | 碳排放分类 | 碳排放量/(TCF/t) | ||||
|---|---|---|---|---|---|---|
| 2015年 | 2016年 | 2017年 | 2018年 | 2019年 | ||
| 本地居民 | 食物碳排放 | 26281.42 | 26902.98 | 26262.62 | 25853.54 | 24436.92 |
| 交通碳排放 | 55.91 | 56.64 | 57.37 | 58.11 | 58.84 | |
| 能源碳排放 | 2845.35 | 3067.00 | 3287.42 | 3390.65 | 3518.52 | |
| 居民总碳排 | 29182.68 | 30026.63 | 29607.41 | 29302.30 | 28014.28 | |
| 人均碳排放 | 8.71 | 8.96 | 8.83 | 8.74 | 8.36 | |
| 旅游者 | 餐饮碳排放 | 893348.00 | 1028781.86 | 1186181.23 | 741359.33 | 818603.78 |
| 住宿碳排放 | 74160.25 | 79861.62 | 81567.87 | 84210.34 | 86970.52 | |
| 交通碳排放 | 1090589.01 | 1332369.97 | 1587483.51 | 1722541.19 | 1869946.67 | |
| 游览碳排放 | 10783.19 | 12087.92 | 14179.01 | 8969.09 | 10395.91 | |
| 娱乐碳排放 | 2579.64 | 2891.77 | 3392.01 | 4004.21 | 4364.59 | |
| 购物碳排放 | 27297.76 | 30600.70 | 35894.31 | 42372.63 | 46186.11 | |
| 人均碳排 | 218.07 | 230.06 | 229.00 | 173.82 | 173.50 | |
| 总计 | 碳排总量 | 2127940.53 | 2516620.47 | 2938305.36 | 2632759.09 | 2864481.86 |
| 变化率/% | — | 18.27 | 16.76 | -10.40 | 8.80 | |
表5 非林地碳汇测算Table 5 Non-forest land carbon sink measurement |
| 土地类型 | 面积/hm2 | 系数 | 碳汇/t |
|---|---|---|---|
| 耕地 | 898.7109 | 0.1721 | 154.6681 |
| 草地 | 0.9641 | 0.1380 | 0.1330 |
| 水域 | 57.3009 | 0.6710 | 38.4489 |
| 未利用地、建设用地、无林地 | 471.5549 | 0.0005 | 0.2358 |
表6 乔木林地碳汇测算表Table 6 Tree woodland carbon sink estimation |
| 优势树种 | 面积/hm2 | 林分蓄积/m3 | 系数a | 系数b | 生物量/t | 碳汇/t |
|---|---|---|---|---|---|---|
| 马尾松 | 27380.81 | 3909395 | 0.5101 | 1.0451 | 2022798.07 | 1011399.04 |
| 黄山松(Pinus taiwanensis Hayata) | 179.87 | 14898 | 0.5101 | 1.0451 | 7787.45 | 3893.72 |
| 杉木 | 5337.13 | 1036452 | 0.3999 | 22.5410 | 534781.37 | 267390.68 |
| 柳杉(Cryptomeria fortunei Hooibrenk ex Otto et Dietr) | 1.35 | 112 | 0.4158 | 41.3318 | 102.29 | 51.14 |
| 水杉(Metasequoia glyptostroboides Hu & W. C. Cheng) | 0.51 | 81 | 0.5168 | 33.2378 | 58.81 | 29.40 |
| 刺柏(Juniperus formosana Hayata) | 1.64 | 16 | 0.6129 | 46.1451 | 85.40 | 42.70 |
| 红豆杉类 | 0.30 | 4 | 0.5168 | 33.2378 | 12.01 | 6.01 |
| 其他杉类 | 1.16 | 106 | 0.5168 | 33.2378 | 93.32 | 46.66 |
| 栎类 | 1013.25 | 144219 | 1.1453 | 8.5473 | 173834.58 | 86917.29 |
| 赛山梅(Styrax confusus Hemsl. var. confusus) | 0.12 | 15 | 1.0357 | 8.0591 | 16.49 | 8.24 |
| 樟树类 | 0.17 | 3 | 1.0357 | 8.0591 | 4.47 | 2.24 |
| 木荷(Schima superba Gardn. et Champ.) | 6.29 | 128 | 1.0357 | 8.0591 | 183.24 | 91.62 |
| 其他硬阔类 | 48037.40 | 6783604 | 0.6255 | 91.0013 | 8614609.71 | 4307304.85 |
| 无患子(Sapindus mukorossi Gaertn.) | 0.15 | 0.11 | 1.0357 | 8.0591 | 1.34 | 0.67 |
| 其他软阔类 | 44.66 | 5521 | 0.6255 | 91.0013 | 7517.83 | 3758.92 |
| 碳汇总和 | 5680943.18 | |||||
| 年碳汇 | 103664.98 | |||||
| [1] |
|
| [2] |
周迪, 王雪芹. 中国碳排放效率与产业结构升级的耦合度及耦合路径. 自然资源学报, 2019, 34(11): 2305-2316.
[
|
| [3] |
方精云, 郭兆迪, 朴世龙, 等. 1981—2000年中国陆地植被碳汇的估算. 中国科学(D辑: 地球科学), 2007, 37(6): 804-812.
[
|
| [4] |
谢高地, 李士美, 肖玉, 等. 碳汇价值的形成和评价. 自然资源学报, 2011, 26(1): 1-10.
[
|
| [5] |
薛龙飞, 罗小锋, 李兆亮, 等. 中国森林碳汇的空间溢出效应与影响因素: 基于大陆31个省(市、区)森林资源清查数据的空间计量分析. 自然资源学报, 2017, 32(10): 1744-1754.
[
|
| [6] |
黄贤金, 张秀英, 卢学鹤, 等. 面向碳中和的中国低碳国土开发利用. 自然资源学报, 2021, 36(12): 2995-3006.
[
|
| [7] |
|
| [8] |
李鹏, 黄继华, 莫延芬, 等. 昆明市四星级酒店住宿产品碳足迹计算与分析. 旅游学刊, 2010, 25(3): 27-34.
[
|
| [9] |
鉴英苗, 罗艳菊, 毕华, 等. 海南环东线旅游路线碳足迹计算与分析. 海南师范大学学报: 自然科学版, 2012, 25(1): 99-103.
[
|
| [10] |
石培华, 吴普. 中国旅游业能源消耗与CO2排放量的初步估算. 地理学报, 2011, 66(2): 235-243.
[
|
| [11] |
肖建红, 于爱芬, 王敏. 旅游过程碳足迹评估: 以舟山群岛为例. 旅游科学, 2011, 25(4): 58-66.
[
|
| [12] |
窦银娣, 刘云鹏, 李伯华, 等. 旅游风景区旅游交通系统碳足迹评估: 以南岳衡山为例. 生态学报, 2012, 32(17): 5532-5541.
[
|
| [13] |
马慧强, 刘嘉乐, 弓志刚. 山西省旅游交通碳排放测度及其演变机理. 经济地理, 2019, 39(4): 223-231.
[
|
| [14] |
郑伯铭, 张宣, 明庆忠. “一带一路”沿线省份旅游经济与碳排放脱钩态势及影响因素研究. 生态经济, 2021, 37(11): 136-143.
[
|
| [15] |
UNWTO-UNEP-WMO. Climate change and tourism: Responding to global challenges: Madrid: UNWTO, UNEP& WMO, 2008: 169-172.
|
| [16] |
|
| [17] |
李威, 黄玫, 张远东, 等. 中国国家森林公园碳储量及固碳速率的时空动态. 应用生态学报, 2021, 32(3): 799-809.
[
|
| [18] |
|
| [19] |
|
| [20] |
|
| [21] |
张瑞英, 席建超, 葛全胜. 基于生命周期理论的旅游者碳足迹分析: 一种"低碳旅游"测度框架及其实证研究. 干旱区资源与环境, 2015, 29(6): 169-175.
[
|
| [22] |
周年兴, 黄震方, 梁艳艳. 庐山风景区碳源、碳汇的测度及均衡. 生态学报, 2013, 33(13): 4134-4145.
[
|
| [23] |
IPCC. 2006 IPCC guidelines for national greenhouse gas inventories, 2006.
|
| [24] |
|
| [25] |
|
| [26] |
郑聚锋, 程琨, 潘根兴, 等. 关于中国土壤碳库及固碳潜力研究的若干问题. 科学通报, 2011, 56(26): 2162-2173.
[
|
| [27] |
|
| [28] |
孔东升, 张灏. 张掖黑河湿地自然保护区生态服务功能价值评估. 生态学报, 2015, 35(4): 972-983.
[
|
| [29] |
赖力, 黄贤金, 刘伟良, 等. 基于投入产出技术的区域生态足迹调整分析: 以2002年江苏省经济为例. 生态学报, 2006, 26(4): 1285-1292.
[
|
| [30] |
|
| [31] |
胡会峰, 王志恒, 刘国华, 等. 中国主要灌丛植被碳储量. 植物生态学报, 2006, 30(4): 539-544.
[
|
| [32] |
周国模, 姜培坤. 毛竹林的碳密度和碳贮量及其空间分布. 林业科学, 2004, (6): 20-24.
[
|
| [33] |
|
| [34] |
曹辉, 林施琦, 张静娴, 等. 福利值与异质性:武夷山国家公园旅游者的选择实验分析. 生态与农村环境学报, 2022, 38(1): 126-135.
[
|
| [35] |
汤姿, 毕克新. 旅游业能源消耗与碳排放研究进展及启示. 世界地理研究, 2014, 23(3): 158-168.
[
|
| [36] |
范月君, 侯向阳, 石红霄, 等. 气候变暖对草地生态系统碳循环的影响. 草业学报, 2012, 21(3): 294-302.
[
|
| [37] |
徐冰, 郭兆迪, 朴世龙, 等. 2000—2050年中国森林生物量碳库: 基于生物量密度与林龄关系的预测. 中国科学: 生命科学, 2010, 40(7): 587-594.
[
|
| [38] |
田云, 林子娟. 巴黎协定下中国碳排放权省域分配及减排潜力评估研究. 自然资源学报, 2021, 36(4): 921-933.
[
|
| [39] |
黄和平, 王智鹏, 宋伊瑶. 乡村振兴背景下乡村旅游目的地碳足迹与生态效率研究: 以江西婺源篁岭景区为例. 农业现代化研究, 2019, 40(4): 683-691.
[
|
| [40] |
王立国, 廖为明, 黄敏, 等. 基于终端消费的旅游碳足迹测算: 以江西省为例. 生态经济, 2011, (5): 121-124.
[
|
/
| 〈 |
|
〉 |