
长江经济带种植业碳排放效率空间关联网络结构及动因
|
吉雪强(1996- ),男,江西吉安人,博士研究生,研究方向为农业生态经济、土地经济与政策。E-mail: 252358980@qq.com |
收稿日期: 2022-01-24
修回日期: 2022-04-09
网络出版日期: 2023-03-08
基金资助
国家社会科学基金项目(17BRK023)
Spatial correlation network structure and motivation of carbon emission efficiency in planting industry in the Yangtze River Economic Belt
Received date: 2022-01-24
Revised date: 2022-04-09
Online published: 2023-03-08
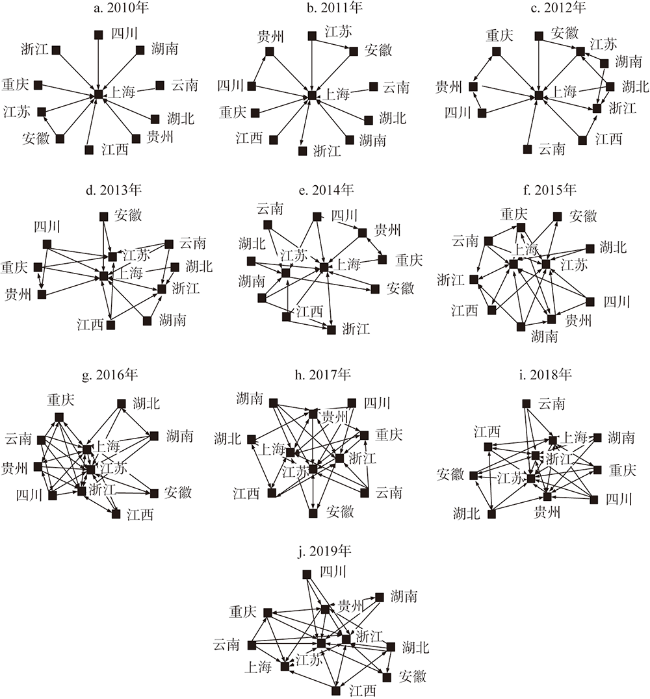
基于长江经济带11省市数据,利用非期望产出SBM模型测度种植业碳排放效率,通过修改的引力模型构建空间关联网络,应用社会网络分析法剖析空间关联网络结构,利用QAP模型分析空间关联网络驱动因素。研究表明:(1)长江经济带种植业碳排放效率提升较快,效率较高,但仍有提升空间,且存在地区差距,整体呈现出复杂空间网络特征;(2)长江经济带种植业碳排放效率空间关联网络关联性增强,网络结构稳定性提升,空间关联网络由上海单极主导演变为江苏、浙江、贵州、上海多中心协同发展格局;(3)农民人均收入、交通运输水平、空间邻接关系、科技水平、政府农业重视水平对长江经济带种植业碳排放效率空间关联网络具有重要影响。提升种植业碳排放效率时应考虑空间关联网络结构及其动因影响,采取有效措施增强种植业碳排放效率空间关联。
吉雪强 , 张跃松 . 长江经济带种植业碳排放效率空间关联网络结构及动因[J]. 自然资源学报, 2023 , 38(3) : 675 -693 . DOI: 10.31497/zrzyxb.20230308
Based on the data of 11 provincial-level regions in the Yangtze River Economic Belt (YREB), this paper uses the undesired output SBM model to measure the carbon emission efficiency of planting industry, constructs the spatial correlation network through the modified gravitational model, applies the social network analysis method to analyze the spatial correlation network structure, and uses the QAP model to examine the driving factors of the spatial correlation network. The research shows that: (1) The carbon emission efficiency of planting industry in the YREB is improved rapidly, the overall efficiency value reaches a high level, but there is still some room for improvement, and the gap still exists between provincial-level regions. Moreover, the spatial effect of the carbon emission efficiency of planting industry in the YREB breaks the traditional spatial geographical proximity and presents complex spatial network characteristics. (2) During the study period, the correlation and structure stability of the spatial nnetwork of carbon emission efficiency of planting industry in the YREB showed an overall growing trend. During this period, the spatial correlation network evolved from the unipolar dominance of Shanghai to the multi-center collaborative development pattern of Jiangsu, Zhejiang, Guizhou and Shanghai. (3) Farmer per capita income, transportation level, spatial proximity relationship, science and technology level, and government agriculture attention level have an important influence on the spatial correlation network of carbon emission efficiency of planting industry in the YREB. It is suggested that when improving the carbon emission efficiency of the planting industry in the YREB, we should consider the spatial association network structure and its driving factors, and take measures to enhance the spatial correlation of the carbon emission efficiency of the planting industry.
表1 种植业碳排放效率投入—产出指标体系Table 1 The input-output index system for planting industry carbon output efficiency |
| 一级指标 | 二级指标 | 变量及说明 |
|---|---|---|
| 投入指标 | 种植业劳动力投入 | 第一产业从业人员×农业总产值/农林牧渔业总产值 |
| 土地投入 | 农作物总播种面积 | |
| 化肥投入 | 化肥施用量 | |
| 农药投入 | 农药使用量 | |
| 农膜投入 | 农膜使用量 | |
| 农业机械动力投入 | 农业机械总动力 | |
| 灌溉投入 | 有效灌溉面积 | |
| 期望产出指标 | 种植业总产值 | 农业总产值(以2010年为基期,狭义农业) |
| 非期望产出指标 | 种植业碳排放量 | 种植业碳排放 |
表2 网络整体结构与个体结构特征指标Table 2 Index of overall structure and individual structure characteristics of networks |
| 整体结构特征 | 公式 | 个体结构特征 | 公式 |
|---|---|---|---|
| 网络密度D | 点度中心度CRD | ||
| 网络关联度C | 接近中心度CAP | ||
| 网络等级度H | 中介中心度CRB | ||
| 网络效率NE |
注:N表示种植业碳排放效率空间关联网络中的节点总数(个);L表示实际关联数(个);V表示网络内部不可达点对数(个);K与maxK分别表示对称可达点对数及最大对称可达点对数(个);M与maxM分别表示节点间多余联系数及最大可能多余联系数;n表示网络中与某特定节点相连的其他节点的数目(个);dij表示成员i与成员j之间的捷径距离,j≠k≠i且j<k;bjk(i)=gik(i)/gik,表示经过节点i并且连接节点j与成员k的捷径数gik(i) 与这两节点之间捷径总数gik之比。 |
表3 长江经济带种植业碳排放效率值Table 3 Carbon emission efficiency value of planting industry in the Yangtze River Economic Belt |
| 省市 | 2010年 | 2011年 | 2012年 | 2013年 | 2014年 | 2015年 | 2016年 | 2017年 | 2018年 | 2019年 |
|---|---|---|---|---|---|---|---|---|---|---|
| 安徽 | 0.326 | 0.327 | 0.341 | 0.337 | 0.355 | 0.375 | 0.392 | 0.427 | 0.443 | 0.465 |
| 贵州 | 0.366 | 0.337 | 0.365 | 0.416 | 0.440 | 0.468 | 0.525 | 0.576 | 0.759 | 1.000 |
| 湖北 | 0.526 | 0.541 | 0.556 | 0.577 | 0.594 | 0.638 | 0.704 | 0.791 | 0.880 | 1.000 |
| 湖南 | 0.522 | 0.540 | 0.528 | 0.524 | 0.547 | 0.581 | 0.602 | 0.653 | 0.704 | 1.000 |
| 江苏 | 0.562 | 0.582 | 0.608 | 0.635 | 0.663 | 0.726 | 0.757 | 0.837 | 0.891 | 1.000 |
| 江西 | 0.295 | 0.305 | 0.306 | 0.360 | 0.371 | 0.386 | 0.414 | 0.450 | 0.500 | 0.557 |
| 上海 | 1.000 | 1.000 | 1.000 | 1.000 | 1.000 | 0.907 | 0.822 | 0.874 | 1.000 | 1.000 |
| 四川 | 0.564 | 0.583 | 0.604 | 0.629 | 0.653 | 0.669 | 0.776 | 0.816 | 0.893 | 1.000 |
| 云南 | 0.314 | 0.321 | 0.318 | 0.331 | 0.342 | 0.360 | 0.384 | 0.409 | 0.472 | 0.537 |
| 浙江 | 0.588 | 0.596 | 0.589 | 0.601 | 0.637 | 0.673 | 0.755 | 0.826 | 0.890 | 1.000 |
| 重庆 | 0.503 | 0.515 | 0.542 | 0.574 | 0.598 | 0.649 | 0.728 | 0.804 | 0.848 | 1.000 |
| 均值 | 0.506 | 0.513 | 0.523 | 0.544 | 0.564 | 0.585 | 0.623 | 0.678 | 0.753 | 0.869 |
表4 长江经济带种植业碳排放效率空间关联网络整体结构特征指标Table 4 Overall structure characteristic index of carbon emission efficiency of planting industry in Yangtze River Economic Belt |
| 年份 | 网络关系数/个 | 网络密度 | 网络关联度 | 网络等级度 | 网络效率 |
|---|---|---|---|---|---|
| 2010 | 13 | 0.118 | 1 | 0.900 | 0.978 |
| 2011 | 14 | 0.127 | 1 | 0.905 | 0.956 |
| 2012 | 21 | 0.191 | 1 | 0.889 | 0.822 |
| 2013 | 26 | 0.236 | 1 | 0.744 | 0.733 |
| 2014 | 23 | 0.209 | 1 | 0.744 | 0.800 |
| 2015 | 29 | 0.264 | 1 | 0.571 | 0.689 |
| 2016 | 38 | 0.346 | 1 | 0.569 | 0.556 |
| 2017 | 39 | 0.355 | 1 | 0.462 | 0.556 |
| 2018 | 39 | 0.355 | 1 | 0.462 | 0.556 |
| 2019 | 37 | 0.336 | 1 | 0.333 | 0.578 |
表5 长江经济带种植业碳排放效率空间关联网络点度中心度Table 5 Degree centrality of spatial correlation network of carbon emission efficiency of planting industry in Yangtze River Economic Belt |
| 省市 | 2010年 | 2011年 | 2012年 | 2013年 | 2014年 | 2015年 | 2016年 | 2017年 | 2018年 | 2019年 |
|---|---|---|---|---|---|---|---|---|---|---|
| 安徽 | 20.000 | 20.000 | 20.000 | 20.000 | 20.000 | 20.000 | 30.000 | 30.000 | 40.000 | 30.000 |
| 贵州 | 10.000 | 20.000 | 30.000 | 30.000 | 30.000 | 50.000 | 50.000 | 70.000 | 70.000 | 70.000 |
| 湖北 | 10.000 | 10.000 | 30.000 | 30.000 | 20.000 | 20.000 | 30.000 | 40.000 | 40.000 | 50.000 |
| 湖南 | 10.000 | 10.000 | 30.000 | 30.000 | 30.000 | 40.000 | 40.000 | 40.000 | 40.000 | 30.000 |
| 江苏 | 20.000 | 20.000 | 40.000 | 70.000 | 60.000 | 80.000 | 90.000 | 90.000 | 100.000 | 90.000 |
| 江西 | 10.000 | 10.000 | 20.000 | 30.000 | 30.000 | 30.000 | 30.000 | 40.000 | 40.000 | 40.000 |
| 上海 | 100.000 | 100.000 | 100.000 | 90.000 | 90.000 | 90.000 | 90.000 | 80.000 | 80.000 | 60.000 |
| 四川 | 10.000 | 20.000 | 20.000 | 30.000 | 30.000 | 30.000 | 50.000 | 40.000 | 40.000 | 30.000 |
| 云南 | 10.000 | 10.000 | 10.000 | 30.000 | 20.000 | 40.000 | 50.000 | 40.000 | 30.000 | 40.000 |
| 浙江 | 10.000 | 10.000 | 40.000 | 50.000 | 30.000 | 40.000 | 90.000 | 80.000 | 80.000 | 90.000 |
| 重庆 | 10.000 | 10.000 | 20.000 | 30.000 | 20.000 | 40.000 | 50.000 | 50.000 | 40.000 | 50.000 |
| 均值 | 20.000 | 21.818 | 32.727 | 40.000 | 34.545 | 43.636 | 54.545 | 54.545 | 54.545 | 52.727 |
表6 长江经济带种植业碳排放效率空间关联网络接近中心度Table 6 Closeness centrality of spatial correlation network of carbon emission efficiency of planting industry in Yangtze River Economic Belt |
| 省市 | 2010年 | 2011年 | 2012年 | 2013年 | 2014年 | 2015年 | 2016年 | 2017年 | 2018年 | 2019年 |
|---|---|---|---|---|---|---|---|---|---|---|
| 安徽 | 10.000 | 10.000 | 12.195 | 43.478 | 38.462 | 45.455 | 55.556 | 52.632 | 58.824 | 58.824 |
| 贵州 | 9.091 | 10.000 | 11.111 | 11.111 | 11.111 | 58.824 | 55.556 | 66.667 | 66.667 | 41.667 |
| 湖北 | 9.091 | 9.091 | 9.091 | 9.091 | 9.091 | 9.091 | 10.000 | 37.037 | 37.037 | 35.714 |
| 湖南 | 9.091 | 9.091 | 9.091 | 9.091 | 9.091 | 9.091 | 10.000 | 9.091 | 9.091 | 30.303 |
| 江苏 | 10.000 | 10.000 | 12.500 | 71.429 | 58.824 | 76.923 | 90.909 | 90.909 | 100.000 | 90.909 |
| 江西 | 9.091 | 9.091 | 9.091 | 50.000 | 50.000 | 50.000 | 52.632 | 55.556 | 55.556 | 52.632 |
| 上海 | 100.000 | 100.000 | 100.000 | 90.909 | 90.909 | 90.909 | 90.909 | 83.333 | 76.923 | 71.429 |
| 四川 | 9.091 | 9.091 | 9.091 | 9.091 | 9.091 | 9.091 | 10.000 | 9.091 | 9.091 | 9.091 |
| 云南 | 9.091 | 9.091 | 9.091 | 9.091 | 9.091 | 9.091 | 9.091 | 9.091 | 9.091 | 9.091 |
| 浙江 | 52.632 | 52.632 | 62.500 | 62.500 | 55.556 | 58.824 | 71.429 | 76.923 | 76.923 | 90.909 |
| 重庆 | 9.091 | 9.091 | 10.989 | 10.989 | 10.989 | 41.667 | 55.556 | 55.556 | 52.632 | 32.258 |
| 均值 | 21.479 | 21.562 | 23.159 | 34.253 | 32.020 | 41.724 | 46.513 | 49.626 | 50.167 | 47.530 |
表7 长江经济带种植业碳排放效率空间关联网络中介中心度Table 7 Betweenness centrality of spatial correlation network of carbon emission efficiency of planting industry in Yangtze River Economic Belt |
| 省市 | 2010年 | 2011年 | 2012年 | 2013年 | 2014年 | 2015年 | 2016年 | 2017年 | 2018年 | 2019年 |
|---|---|---|---|---|---|---|---|---|---|---|
| 安徽 | 0.000 | 0.000 | 0.000 | 3.333 | 3.333 | 5.556 | 5.556 | 7.037 | 7.778 | 3.704 |
| 贵州 | 0.000 | 0.000 | 1.111 | 1.111 | 1.111 | 11.111 | 0.833 | 4.815 | 4.815 | 19.907 |
| 湖北 | 0.000 | 0.000 | 0.000 | 0.000 | 0.000 | 0.000 | 0.000 | 0.370 | 0.741 | 17.037 |
| 湖南 | 0.000 | 0.000 | 0.000 | 0.000 | 0.000 | 0.000 | 0.556 | 0.000 | 0.000 | 0.000 |
| 江苏 | 0.000 | 0.000 | 2.222 | 10.000 | 10.000 | 10.000 | 4.444 | 5.000 | 4.259 | 5.278 |
| 江西 | 0.000 | 0.000 | 0.000 | 4.444 | 8.889 | 2.222 | 0.278 | 12.037 | 11.481 | 23.981 |
| 上海 | 10.000 | 10.000 | 6.667 | 17.778 | 24.444 | 30.556 | 23.148 | 14.630 | 15.370 | 3.704 |
| 四川 | 0.000 | 0.000 | 0.000 | 0.000 | 0.000 | 0.000 | 0.370 | 0.000 | 0.000 | 0.000 |
| 云南 | 0.000 | 0.000 | 0.000 | 0.000 | 0.000 | 0.000 | 0.000 | 0.000 | 0.000 | 0.000 |
| 浙江 | 0.000 | 0.000 | 0.000 | 0.000 | 0.000 | 0.000 | 7.500 | 13.519 | 12.963 | 33.056 |
| 重庆 | 0.000 | 0.000 | 0.000 | 2.222 | 0.000 | 0.556 | 0.648 | 1.481 | 0.370 | 2.222 |
| 均值 | 0.909 | 0.909 | 0.909 | 3.535 | 4.343 | 5.455 | 3.939 | 5.354 | 5.252 | 9.899 |
表8 长江经济带种植业碳排放效率空间关联网络QAP相关性分析Table 8 QAP correlation analysis of spatial correlation network of carbon emission efficiency in Yangtze River Economic Belt |
| 自变量 | 2010年 | 2011年 | 2012年 | 2013年 | 2014年 | 2015年 | 2016年 | 2017年 | 2018年 | 2019年 |
|---|---|---|---|---|---|---|---|---|---|---|
| J | -0.510** | -0.249 | -0.303 | -0.413** | -0.293 | -0.365** | -0.451** | -0.345* | -0.414* | -0.606*** |
| T | 0.165 | 0.184 | 0.072 | -0.041 | -0.046 | -0.082 | -0.177 | -0.065 | -0.153 | -0.302* |
| X | -0.408* | -0.383 | -0.450** | -0.514** | -0.448** | -0.360* | -0.567*** | -0.303* | -0.272 | -0.601* |
| S | -0.535** | -0.501** | -0.585*** | -0.668*** | -0.572*** | -0.606** | -0.628*** | -0.570*** | -0.570*** | -0.307*** |
| G | 0.337 | 0.374 | 0.479*** | 0.162 | 0.199 | 0.366* | 0.479** | 0.474** | 0.458** | 0.211** |
| C | 0.030 | 0.067 | 0.085 | -0.044 | 0.003 | -0.044 | 0.035 | -0.019 | 0.061 | 0.361** |
注:***、**、*分别表示P<0.01、P<0.05、P<0.1;本文假设P<0.1,便是显著。自变量为科技水平差异矩阵(J)、交通运输水平差异矩阵(T)、信息化水平差异矩阵(X)、农民人均收入差异矩阵(S)、政府农业重视水平差异矩阵(G)、空间邻接矩阵(C),下同。 |
表9 长江经济带种植业碳排放效率空间关联网络QAP回归分析Table 9 QAP regression analysis of the spatial correlation network of carbon emission efficiency in planting industry in the Yangtze River Economic Belt |
| 自变量 | 2010年 | 2011年 | 2012年 | 2013年 | 2014年 | 2015年 | 2016年 | 2017年 | 2018年 | 2019年 |
|---|---|---|---|---|---|---|---|---|---|---|
| J | -0.054 | 0.333** | 0.239** | 0.140 | 0.180* | 0.044 | -0.086 | -0.014 | -0.003 | -0.440*** |
| T | 0.257* | 0.209** | 0.167** | 0.098 | 0.126* | 0.108 | 0.087 | 0.082 | 0.002 | 0.006 |
| X | -0.181 | -0.118 | -0.137 | 0.005 | 0.024 | 0.122 | 0.213 | 0.226 | 0.055 | 0.117 |
| S | -0.295* | -0.656*** | -0.513*** | -0.778*** | -0.791*** | -0.733*** | -0.810*** | -0.764*** | -0.605** | -0.371** |
| G | -0.048 | -0.062 | 0.166** | -0.051 | -0.156** | 0.084 | 0.058 | 0.027 | 0.049 | 0.037 |
| C | 0.064 | 0.114** | 0.129** | 0.021 | 0.081 | 0.007 | 0.059 | 0.036 | 0.097 | 0.198** |
| R2 | 0.382*** | 0.408*** | 0.442*** | 0.445*** | 0.360*** | 0.382*** | 0.382*** | 0.325*** | 0.305*** | 0.429*** |
| [1] |
黄贤金, 张秀英, 卢学鹤, 等. 面向碳中和的中国低碳国土开发利用. 自然资源学报, 2021, 36(12): 2995-3006.
[
|
| [2] |
董又铭, 郭炎, 李志刚, 等. 长江经济带乡村性的时空分异格局及驱动机制. 自然资源学报, 2022, 37(2): 378-395.
[
|
| [3] |
黄国华, 刘传江, 赵晓梦. 长江经济带碳排放现状及未来碳减排. 长江流域资源与环境, 2016, 25(4): 638-644.
[
|
| [4] |
杜耘. 保护长江生态环境, 统筹流域绿色发展. 长江流域资源与环境, 2016, 25(2): 171-179.
[
|
| [5] |
林而达. 气候变化与农业可持续发展. 北京: 北京出版社, 2001.
[
|
| [6] |
赵文晋, 李都峰, 王宪恩. 低碳农业的发展思路. 环境保护, 2010, (12): 38-39.
[
|
| [7] |
李波, 张俊飚, 李海鹏. 中国农业碳排放时空特征及影响因素分解. 中国人口·资源与环境, 2011, 21(8): 80-86.
[
|
| [8] |
田云, 张俊飚. 中国省级区域农业碳排放公平性研究. 中国人口·资源与环境, 2013, 23(11): 39-47.
[
|
| [9] |
李波, 张俊飚. 基于投入视角的我国农业碳排放与经济发展脱钩研究. 经济经纬, 2012, (4): 27-31.
[
|
| [10] |
吴贤荣, 张俊飚, 程文能. 中国种植业低碳生产效率及碳减排成本文. 环境经济研究, 2017, 2(1): 57-69.
[
|
| [11] |
戴小文, 杨雨欣. 2007—2016年中国省域种植业碳排放测算、驱动效应与时空特征. 四川农业大学学报, 2020, 38(2): 241-250.
[
|
| [12] |
董明涛. 我国农业碳排放与产业结构的关联研究. 干旱区资源与环境, 2016, 30(10): 7-12.
[
|
| [13] |
吴昊玥, 何宇, 黄瀚蛟, 等. 中国种植业碳补偿率测算及空间收敛性. 中国人口·资源与环境, 2021, 31(6): 113-123.
[
|
| [14] |
丁宝根, 杨树旺, 赵玉. 长江经济带种植业碳排放时空特征及驱动因素研究. 生态与农村环境学报, 2019, 35(10): 1252-1258.
[
|
| [15] |
吴传清, 宋子逸. 长江经济带农业绿色发展报告. 北京: 社会科学文献出版社, 2018.
[
|
| [16] |
吴昊玥, 黄瀚蛟, 何宇, 等. 中国农业碳排放效率测度、空间溢出与影响因素. 中国生态农业学报: 中英文, 2021, 29(10): 1762-1773.
[
|
| [17] |
田云, 王梦晨. 湖北省农业碳排放效率时空差异及影响因素. 中国农业科学, 2020, 53(24): 5063-5072.
[
|
| [18] |
王帅, 赵荣钦, 杨青林, 等. 碳排放约束下的农业生产效率及其空间格局: 基于河南省65个村庄的调查. 自然资源学报, 2020, 35(9): 2092-2104.
[
|
| [19] |
雷振丹, 陈子真, 李万明. 农业技术进步对农业碳排放效率的非线性实证. 统计与决策, 2020, 36(5): 67-71.
[
|
| [20] |
张广胜, 王珊珊. 中国农业碳排放的结构、效率及其决定机制. 农业经济问题, 2014, 35(7): 18-26, 110.
[
|
| [21] |
王劼, 朱朝枝. 农业部门碳排放效率的国际比较及影响因素研究: 基于32个国家1995—2011年的数据研究. 生态经济, 2018, 34(7): 25-32.
[
|
| [22] |
刘其涛. 中国农业碳排放效率的区域差异: 基于Malmquist-Luenberger指数的实证分析. 江苏农业科学, 2015, 43(9): 497-501.
[
|
| [23] |
|
| [24] |
郭四代, 钱昱冰, 赵锐. 西部地区农业碳排放效率及收敛性分析: 基于SBM-Undesirable模型. 农村经济, 2018, (11): 80-87.
[
|
| [25] |
高鸣, 宋洪远. 中国农业碳排放绩效的空间收敛与分异: 基于Malmquist-luenberger指数与空间计量的实证分析. 经济地理, 2015, 35(4): 142-148, 185.
[
|
| [26] |
李波, 王春妤, 张俊飚. 中国农业净碳汇效率动态演进与空间溢出效应. 中国人口·资源与环境, 2019, 29(12): 68-76.
[
|
| [27] |
伍国勇, 孙小钧, 于福波, 等. 中国种植业碳生产率空间关联格局及影响因素分析. 中国人口·资源与环境, 2020, 30(5): 46-57.
[
|
| [28] |
马歆, 高煜昕, 李俊朋. 中国碳排放结构信息熵空间网络关联及影响因素研究. 软科学, 2021, 35(7): 25-30, 37.
[
|
| [29] |
李爱, 王雅楠, 李梦, 等. 碳排放的空间关联网络结构特征与影响因素研究: 以中国三大城市群为例. 环境科学与技术, 2021, 44(6): 186-193.
[
|
| [30] |
何艳秋, 陈柔, 朱思宇, 等. 中国农业碳排放空间网络结构及区域协同减排. 江苏农业学报, 2020, 36(5): 1218-1228.
[
|
| [31] |
刘华军, 刘传明, 孙亚男. 中国能源消费的空间关联网络结构特征及其效应研究. 中国工业经济, 2015, (5): 83-95.
[
|
| [32] |
谭灵芝. 我国土地要素产出空间关联网络特征及其效应研究. 商业研究, 2018, (6): 41-51.
[
|
| [33] |
王兆峰, 刘庆芳. 中国省域旅游效率空间网络结构演化及其影响因素. 地理科学, 2021, 41(3): 397-406.
[
|
| [34] |
王婧, 杜广杰. 中国城市绿色创新空间关联网络及其影响效应. 中国人口·资源与环境, 2021, 31(5): 21-27.
[
|
| [35] |
|
| [36] |
林江彪, 王亚娟, 张小红, 等. 黄河流域城市资源环境效率时空特征及影响因素. 自然资源学报, 2021, 36(1): 208-222.
[
|
| [37] |
|
| [38] |
王群伟, 周鹏, 周德群. 我国二氧化碳排放绩效的动态变化、区域差异及影响因素. 中国工业经济, 2010, (1): 45-54.
[
|
| [39] |
尚杰, 杨果, 于法稳. 中国农业温室气体排放量测算及影响因素研究. 中国生态农业学报, 2015, 23(3): 354-364.
[
|
| [40] |
闵继胜, 胡浩. 中国农业生产温室气体排放量的测算. 中国人口·资源与环境, 2012, 22(7): 21-27.
[
|
| [41] |
田成诗, 陈雨. 中国省际农业碳排放测算及低碳化水平评价: 基于衍生指标与TOPSIS法的运用. 自然资源学报, 2021, 36(2): 395-410.
[
|
| [42] |
|
| [43] |
刘军. 整体网分析. 上海: 格致出版社, 2014.
[
|
| [44] |
程慧, 徐琼, 赵梦亚. 中国旅游生态效率的空间关联网络结构及其影响因素研究. 生态科学, 2020, 39(5): 169-178.
[
|
| [45] |
刘军. 社会网络分析导论. 北京: 社会科学文献出版社, 2004.
[
|
| [46] |
|
/
| 〈 |
|
〉 |