
中国居民能源消费的间接回弹效应分析及双碳目标下的政策启示
|
许光清(1969- ),女,山东潍坊人,博士,副教授,硕士生导师,主要从事能源与气候变化经济学等研究。E-mail: xugqing@ruc.edu.cn |
收稿日期: 2022-02-10
修回日期: 2022-04-28
网络出版日期: 2023-03-08
基金资助
国家电网公司总部管理科技项目(1400-202224242A-1-1-ZN)
Indirect rebound effect analysis of Chinese residential energy consumption and policy recommendations for the carbon peak and carbon neutrality goals
Received date: 2022-02-10
Revised date: 2022-04-28
Online published: 2023-03-08
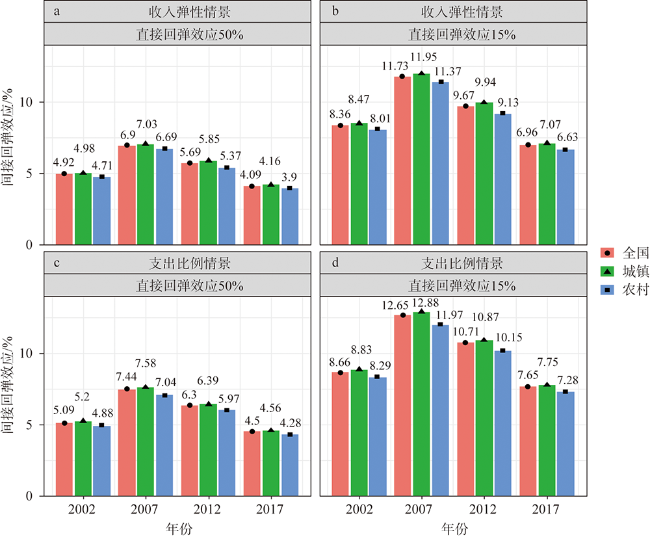
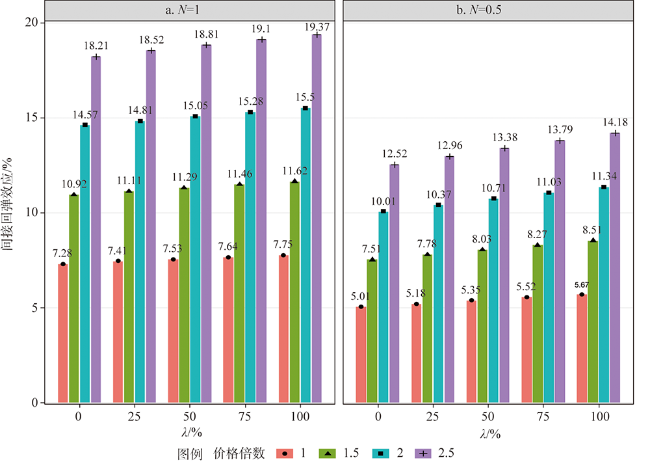
鉴于居民能源消费的间接回弹效应影响广泛但现有研究不充分,使用碳排放量结合再分配模型和20部门环境投入产出表,测算了2002年、2007年、2012年和2017年中国居民能源消费的间接回弹效应。实证结果显示:间接回弹效应在3.90%~12.88%之间;间接回弹效应在时间上呈倒“U”型,在空间上城镇大于农村。针对双碳目标可能导致三种重要因素的变化进行模拟,分析得出间接回弹效应受居民单位碳排放的能源支出提升而增大的幅度最大,随后向关联系数降低而减小的幅度次之,受城镇化影响的变动最小;在一般政策情景和长期低碳转型情景中,2030年的间接回弹效应均>13%,2060年的间接回弹效应在一般政策情景高达46.55%,在长期低碳转型情景为11.77%。持续推进能源结构和整个经济系统的低碳化转型以及促进居民消费低碳化,应是在双碳目标下降低间接回弹效应的关键对策。
关键词: 居民能源消费; 间接回弹效应; 环境投入产出表; 居民单位碳排放的能源支出; 后向关联系数
许光清 , 张文丹 , 刘海博 . 中国居民能源消费的间接回弹效应分析及双碳目标下的政策启示[J]. 自然资源学报, 2023 , 38(3) : 658 -674 . DOI: 10.31497/zrzyxb.20230307
The residential energy consumption indirect rebound effect has a wide impact but limited research. This paper estimates the indirect rebound effect of China's residential energy consumption in 2002, 2007, 2012, and 2017 using a combination of the redistribution model and the 20 sectors' environmental Input-Output table, with CO2 emission being the measure. The results show that the indirect rebound effect of residential energy consumption is between 3.90% and 12.88%. The indirect rebound effect shows an inverse U-shape across the time dimension. Besides, the urban indirect rebound effect is consistently higher than the rural indirect rebound effect. This study conducts simulations focusing on three important factors that may change under the carbon peak and carbon neutrality goals to compare their impact on the indirect rebound effect. The analyses show that the indirect rebound effect increases the most when the residential unit carbon emission expenses increase. The indirect rebound effect decreases but not as much when the backward relating coefficients decrease and is affected the least by the simulated urbanization rate. In both general policy scenario and long-term low-carbon transition scenario, the indirect rebound effect in 2030 is greater than 13%, the general policy scenario in 2060 is as high as 46.55%, and the long-term low-carbon transition scenario is 11.77%. We discussed key policy recommendations for the carbon peak and carbon neutrality goals, including pushing forward policies to transform the energy structure as well as the whole economic system, and promote low-carbon residential consumption to offset the increasing trend of indirect rebound effect.
表1 中国20部门投入产出行业分类Table 1 China's 20 sector input-output table |
| 部门代码 | 部门 | 部门代码 | 部门 |
|---|---|---|---|
| 1 | 农林牧渔业 | 11 | 交通运输设备制造业 |
| 2 | 采选业 | 12 | 电气机械、电子及通信设备制造业 |
| 3 | 食品和烟草加工制造业 | 13 | 废弃资源利用、修理和其他制造业 |
| 4 | 纺织服装制造业 | 14 | 电力、热力生产和供应业 |
| 5 | 木材和家具制造业 | 15 | 燃气生产和供应业 |
| 6 | 造纸和文教用品制造业 | 16 | 水的生产和供应业 |
| 7 | 石油、炼焦和核燃料加工业 | 17 | 建筑业 |
| 8 | 化学工业和非金属制品业 | 18 | 批发零售和住宿餐饮业 |
| 9 | 金属压延加工和金属制品业 | 19 | 交通运输、仓储和邮政业 |
| 10 | 专用和通用设备制造业 | 20 | 第三产业其他服务业 |
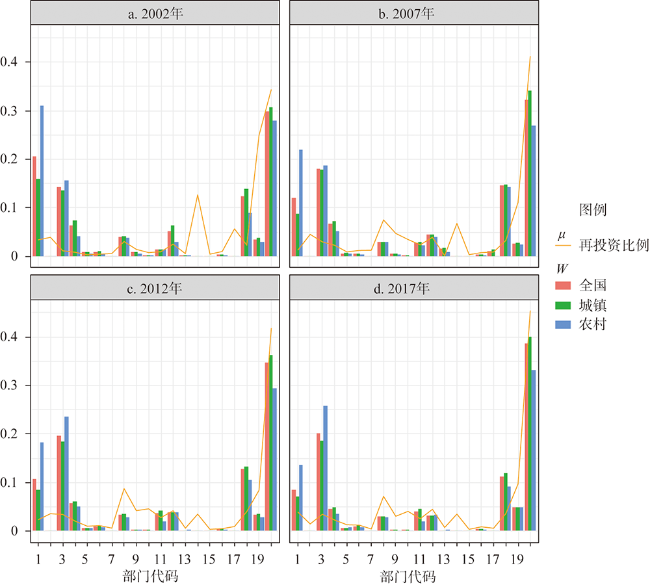
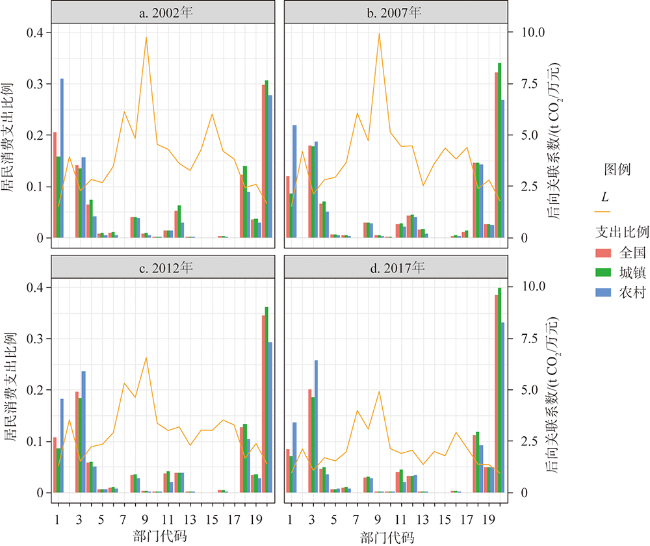
表2 居民单位碳排放的能源支出及中间变量Table 2 Residential unit carbon emission expenses and intermediary variables |
| 能源支出 | 2002年 | 2007年 | 2012年 | 2017年 | |
|---|---|---|---|---|---|
| 煤炭及制品 | 价格/(万元/tce) | 0.039 | 0.057 | 0.074 | 0.061 |
| 消费比例 | 0.378 | 0.246 | 0.187 | 0.123 | |
| 油类 | 价格/(万元/tce) | 0.106 | 0.229 | 0.269 | 0.251 |
| 消费比例 | 0.133 | 0.145 | 0.158 | 0.198 | |
| 天然气 | 价格/(万元/tce) | 0.148 | 0.171 | 0.181 | 0.167 |
| 消费比例 | 0.034 | 0.058 | 0.089 | 0.096 | |
| 电力 | 价格/(万元/tce) | 0.168 | 0.146 | 0.129 | 0.124 |
| 消费比例 | 0.358 | 0.450 | 0.460 | 0.474 | |
| 热力 | 价格/(万元/tce) | 0.047 | 0.070 | 0.095 | 0.094 |
| 消费比例 | 0.050 | 0.060 | 0.063 | 0.063 | |
| 其他能源 | 价格/(万元/tce) | 0.039 | 0.057 | 0.074 | 0.061 |
| 消费比例 | 0.049 | 0.042 | 0.043 | 0.047 | |
| 电力的碳排放因子/[万t CO2/(亿kW·h)] | 7.825 | 7.435 | 6.339 | 5.676 | |
| 热力的碳排放因子/(万t CO2/万百万kJ) | 0.115 | 0.120 | 0.123 | 0.117 | |
| 加权能源价格/(万元/tce) | 0.098 | 0.129 | 0.141 | 0.141 | |
| 居民生活碳排放量/亿t CO2 | 4.245 | 7.332 | 9.347 | 12.027 | |
| 居民碳排放中电力热力的间接排放占比 | 0.398 | 0.507 | 0.526 | 0.531 | |
| 居民单位碳排放的能源支出/(万元/t CO2) | 0.042 | 0.058 | 0.064 | 0.068 | |
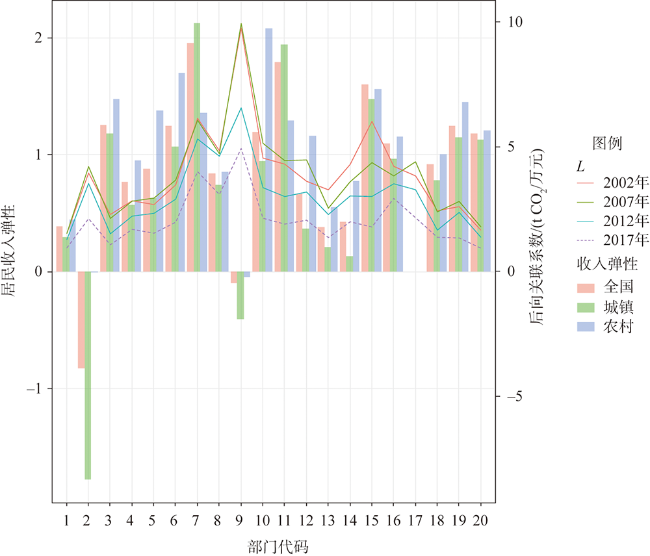
表3 部门碳排放强度c和后向关联系数L (t CO2/万元)Table 3 CO2 emission intensity c and the backward relating coefficient L by sector |
| 部门代码 | 2002年 | 2007年 | 2012年 | 2017年 | |||||||
|---|---|---|---|---|---|---|---|---|---|---|---|
| c | L | c | L | c | L | c | L | ||||
| 1 | 0.387 | 1.528 | 0.418 | 1.527 | 0.314 | 1.279 | 0.309 | 0.941 | |||
| 2 | 2.174 | 3.958 | 1.818 | 4.214 | 1.764 | 3.532 | 1.057 | 2.118 | |||
| 3 | 0.731 | 2.296 | 0.506 | 2.137 | 0.269 | 1.518 | 0.183 | 1.072 | |||
| 4 | 0.636 | 2.845 | 0.494 | 2.829 | 0.371 | 2.226 | 0.301 | 1.689 | |||
| 5 | 0.325 | 2.692 | 0.323 | 2.951 | 0.26 | 2.337 | 0.139 | 1.534 | |||
| 6 | 1.067 | 3.485 | 0.803 | 3.679 | 0.453 | 2.906 | 0.329 | 1.978 | |||
| 7 | 2.872 | 6.153 | 2.589 | 6.073 | 2.392 | 5.314 | 2.319 | 3.998 | |||
| 8 | 1.798 | 4.849 | 1.313 | 4.73 | 1.585 | 4.623 | 1.175 | 3.084 | |||
| 9 | 4.833 | 9.767 | 4.534 | 9.951 | 2.64 | 6.561 | 2.414 | 4.926 | |||
| 10 | 0.565 | 4.556 | 0.414 | 5.147 | 0.203 | 3.366 | 0.154 | 2.133 | |||
| 11 | 0.666 | 4.313 | 0.302 | 4.452 | 0.148 | 3.009 | 0.11 | 1.9 | |||
| 12 | 0.176 | 3.627 | 0.123 | 4.482 | 0.09 | 3.19 | 0.067 | 2.056 | |||
| 13 | 1.951 | 3.284 | 0.319 | 2.545 | 0.593 | 2.289 | 0.362 | 1.36 | |||
| 14 | 2.402 | 4.301 | 0.859 | 3.606 | 0.721 | 3.033 | 0.681 | 1.991 | |||
| 15 | 2.84 | 6.027 | 1.077 | 4.372 | 0.465 | 3.014 | 0.325 | 1.785 | |||
| 16 | 2.168 | 4.223 | 1.854 | 3.841 | 1.986 | 3.52 | 1.849 | 2.929 | |||
| 17 | 0.191 | 3.841 | 0.18 | 4.407 | 0.162 | 3.282 | 0.14 | 2.153 | |||
| 18 | 1.091 | 2.45 | 1.2 | 2.399 | 1.002 | 1.665 | 0.888 | 1.371 | |||
| 19 | 0.616 | 2.609 | 0.559 | 2.818 | 0.484 | 2.375 | 0.378 | 1.345 | |||
| 20 | 0.275 | 1.663 | 0.319 | 1.796 | 0.272 | 1.376 | 0.233 | 0.934 | |||
表4 各部门居民消费的收入弹性Table 4 Residential income elasticity by sector |
| 部门代码 | 是否能源部门 | 全国 | 城镇 | 农村 |
|---|---|---|---|---|
| 1 | NE | 0.381 | 0.291 | 0.441 |
| 2 | E | -0.827 | -1.781 | -0.009 |
| 3 | NE | 1.250 | 1.177 | 1.472 |
| 4 | NE | 0.765 | 0.569 | 0.947 |
| 5 | NE | 0.875 | 0.624 | 1.373 |
| 6 | NE | 1.244 | 1.068 | 1.696 |
| 7 | E | 1.949 | 2.124 | 1.358 |
| 8 | NE | 0.839 | 0.740 | 0.847 |
| 9 | NE | -0.100 | -0.412 | -0.047 |
| 10 | NE | 1.194 | 0.939 | 2.079 |
| 11 | NE | 1.791 | 1.942 | 1.291 |
| 12 | NE | 0.658 | 0.367 | 1.160 |
| 13 | NE | 0.376 | 0.205 | 0.546 |
| 14 | E | 0.422 | 0.129 | 0.771 |
| 15 | E | 1.600 | 1.475 | 1.561 |
| 16 | NE | 1.096 | 0.960 | 1.150 |
| 17 | NE | 0.000 | 0.000 | 0.000 |
| 18 | NE | 0.914 | 0.775 | 0.998 |
| 19 | NE | 1.243 | 1.147 | 1.449 |
| 20 | NE | 1.178 | 1.126 | 1.205 |
| [1] |
邓祥征, 蒋思坚, 刘冰, 等. 全球二氧化碳浓度非均匀分布条件下碳排放与升温关系的统计分析. 自然资源学报, 2021, 36(4): 934-947.
[
|
| [2] |
田云, 林子娟. 巴黎协定下中国碳排放权省域分配及减排潜力评估研究. 自然资源学报, 2021, 36(4): 921-933.
[
|
| [3] |
庄贵阳. 碳中和目标引领下的消费责任与政策建议. 人民论坛·学术前沿, 2021, (14): 62-68.
[
|
| [4] |
钟茂初. “双碳”目标有效路径及误区的理论分析. 中国地质大学学报: 社会科学版, 2022, 22(1): 10-21.
[
|
| [5] |
刘伟, 蔡志洲. 经济周期与长期经济增长: 中国的经验和特点(1978—2018). 经济学动态, 2019, (7): 20-36.
[
|
| [6] |
|
| [7] |
|
| [8] |
|
| [9] |
|
| [10] |
|
| [11] |
|
| [12] |
|
| [13] |
|
| [14] |
|
| [15] |
|
| [16] |
|
| [17] |
|
| [18] |
|
| [19] |
|
| [20] |
|
| [21] |
|
| [22] |
|
| [23] |
|
| [24] |
|
| [25] |
孙涵, 申俊, 成金华. 基于LA-AIDS模型的中国居民能源消费回弹效应研究. 软科学, 2016, 30(3): 94-97.
[
|
| [26] |
|
| [27] |
|
| [28] |
刘朝, 周宵宵, 张欢, 等. 中国居民能源消费间接回弹效应测算: 基于投入产出和再分配模型的研究. 中国软科学, 2018, (10): 142-157.
[
|
| [29] |
|
| [30] |
王长建, 汪菲, 叶玉瑶, 等. 基于供需视角的中国煤炭消费演变特征及其驱动机制. 自然资源学报, 2020, 35(11): 2708-2723.
[
|
| [31] |
王兆华, 卢密林. 基于省际面板数据的中国城镇居民用电直接回弹效应研究. 系统工程理论与实践, 2014, 34(7): 1678-1686.
[
|
| [32] |
|
| [33] |
|
| [34] |
|
| [35] |
|
| [36] |
唐要家. 电价管制刚性的政治经济学逻辑. 中国地质大学学报: 社会科学版, 2014, 14(4): 1-6, 139.
[
|
| [37] |
叶泽, 袁玮志, 李湘祁. 低电价陷阱: 电价水平与经济发展的关系实证研究. 中国工业经济, 2013, (11): 44-56.
[
|
| [38] |
何凌云, 程怡, 金里程, 等. 国内外能源价格对中国能源消耗的综合调节作用比较研究. 自然资源学报, 2016, 31(1): 1-16.
[
|
| [39] |
项目综合报告编写组. 《中国长期低碳发展战略与转型路径研究》综合报告. 中国人口·资源与环境, 2020, 30(11): 1-25.
[Project Synthesis Report Writing Team. Comprehensive report on China's Long-term Low-carbon Development Strategy and Transformation Path. China Population, Resources and Environment, 2020, 30(11): 1-25.]
|
| [40] |
谢伏瞻, 刘伟, 王国刚, 等. 奋进新时代开启新征程:学习贯彻党的十九届五中全会精神笔谈(上). 经济研究, 2020, 55(12): 4-45.
[
|
| [41] |
赵茜. 国际能源比价分析. 商业经济, 2016, (10): 30-31, 42.
[
|
/
| 〈 |
|
〉 |