
行政等级与城市规模对生态福利绩效的影响研究
|
臧漫丹(1970- ),女,辽宁黑山人,博士,副教授,硕士生导师,主要从事可持续发展与管理研究。E-mail: zmd@tongji.edu.cn |
收稿日期: 2021-09-13
修回日期: 2021-12-17
网络出版日期: 2022-12-28
基金资助
国家自然科学基金项目(72174145)
The influence of administrative hierarchy and urban scale on ecological well-being performance
Received date: 2021-09-13
Revised date: 2021-12-17
Online published: 2022-12-28
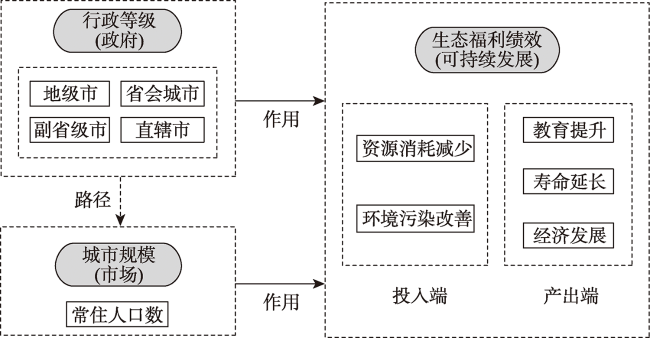
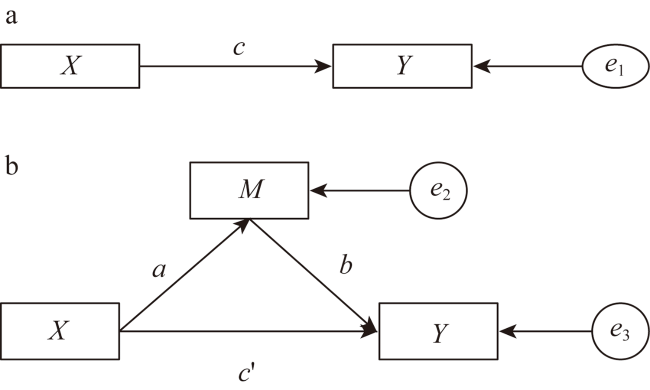
基于广义数据包络分析法(DEA)和随机抽样Bootstrap法,使用2015—2018年全国288个地级及以上城市的面板数据,研究行政等级、城市规模对生态福利绩效的影响,分析城市规模在行政等级影响生态福利绩效中的路径作用。结果表明:我国288个地级及以上城市的生态福利绩效水平整体均值不高,但随时间推移呈上升趋势且近年来增速逐渐加快;行政等级和城市规模均对生态福利绩效起显著正向影响,技术进步显著提升城市的生态福利绩效,外资依存度显著降低城市的生态福利绩效;城市规模是城市行政等级影响生态福利绩效的重要路径,行政等级越高,城市规模越大,生态福利绩效水平越高。基于以上结论,为协调经济、环境、社会实现可持续发展提出政策建议。
臧漫丹 , 高易 , 李金 . 行政等级与城市规模对生态福利绩效的影响研究[J]. 自然资源学报, 2022 , 37(12) : 3201 -3216 . DOI: 10.31497/zrzyxb.20221212
As the urbanization process accelerates, more and more urban population continues to release kinetic energy for social development. But at the same time, they bring many resource and environmental problems, intensifying the contradiction between the rapid urban development and the natural environment. Nowadays, it is inevitably an important period of in-depth development of urbanization, alleviating resource and environmental contradictions, economic transformation and upgrading, and accelerating the promotion of socialist modernization. How to achieve sustainable urban development has become a very urgent and important issue. This paper, from the perspective of Chinese characteristic administrative level, explores the impact of administrative level and city size on ecological welfare performance. This study is helpful to understand the change trend of ecological welfare performance and the formation of its heterogeneity under the "government intervention + market promotion" model. It can also provide useful policy implications for the choice of urban sustainable development strategies in China, which is of great significance to deepen sustainable development research. Based on the generalized data envelopment analysis (DEA) method and random sampling bootstrap method, using the panel data of 288 prefecture level and above cities in China from 2015 to 2018, this paper studies the impact of administrative hierarchy and urban scale on ecological well-being performance, and analyzes the path role of urban scale in the impact of administrative hierarchy on ecological well-being performance. Main conclusions are as follows: (1) 288 prefecture level and above cities in China are at overall low level of ecological well-being performance, but show an upward trend over time, and the growth rate has gradually accelerated in recent years. (2) Both administrative hierarchy and urban scale have a significant positive impact on ecological well-being performance. Technological progress significantly improves urban ecological well-being performance, and FDI dependence significantly reduces urban ecological well-being performance. (3) Urban scale is an important path for administrative hierarchy to affect ecological well-being performance. The higher administrative level will bring larger urban scale and higher level of ecological well-being performance. Finally, based on the above conclusions, policy suggestions are provided for coordinating the sustainable development of economy, environment and society.
表1 生态福利绩效评价指标体系Table 1 Evaluation index system of ecological well-being performance |
| 类别 | 指标大类 | 一级指标 | 二级指标 | 单位 |
|---|---|---|---|---|
| 投入指标 | 资源消耗 | 能源消耗① | 人均能源消耗总量 | kg/人 |
| 水资源消耗 | 人均供水量 | m3/人 | ||
| 土地占用 | 人均建成区面积 | km2/万人 | ||
| 环境污染 | 水污染 | 人均废水排放量 | t/人 | |
| 大气污染 | 人均工业二氧化硫排放量 | t/人 | ||
| 人均工业烟粉尘排放量 | t/人 | |||
| 固体废物污染 | 人均城市生活垃圾清运量 | t/人 | ||
| 工业固体废物未综合利用率 | % | |||
| 产出指标 | 客观福利 | 经济产出 | 人均地区实际生产总值② | 亿元 |
| 社会产出 | 平均预期寿命 | 年 | ||
| 平均受教育水平③ | 年 |
① 注:由于地级市层面的能源消耗数据缺失,本文借鉴GB/T2589-2020《综合能耗计算通则》,采用用电量、供气总量、液化石油气、居民生活用水等数据,通过系数转换为标准煤,用以表示能源消耗量。具体折算公式为 (用电量×0.1229×10000+供气总量×1.33×10000+液化石油气×1.7143×1000+居民生活用水×0.0857×1000)/常住人口。 ② 注:以2015年为计算基期,运用城市GDP平减指数进行平减,计算地区实际生产总值。 ③ 注:平均受教育年限=(P小学×6+P初中×9+P高中×12+P大专以上×16)/(P小学+P初中+P高中+P大专以上),式中:P代表各教育学历人口数(人)。 |
表2 不同行政等级城市生态福利绩效均值Table 2 Average value of urban ecological well-being performance at different administrative levels |
| 年份 | 地级市 | 省会城市 | 副省级市 | 直辖市 | 均值 |
|---|---|---|---|---|---|
| 2015 | 0.522 | 0.361 | 0.497 | 0.471 | 0.463 |
| 2016 | 0.555 | 0.408 | 0.625 | 0.598 | 0.547 |
| 2017 | 0.551 | 0.413 | 0.694 | 0.760 | 0.604 |
| 2018 | 0.594 | 0.457 | 0.725 | 0.819 | 0.649 |
表3 不同行政等级城市生态福利绩效增速Table 3 Growth rate of urban ecological well-being performance at different administrative levels (%) |
| 年份 | 地级市 | 省会城市 | 副省级市 | 直辖市 | 均值 |
|---|---|---|---|---|---|
| 2015 | -1.363 | 9.300 | 0.544 | 8.599 | 4.270 |
| 2016 | 4.841 | 23.786 | 26.441 | 37.919 | 23.247 |
| 2017 | 3.953 | 25.065 | 40.454 | 75.367 | 36.210 |
| 2018 | 12.061 | 38.643 | 46.689 | 88.855 | 46.562 |
表4 基准模型回归结果(被解释变量:生态福利绩效)Table 4 Regression results (Explained variable: ecological well-being performance |
| 变量 | 模型(1) | 模型(2) | |||
|---|---|---|---|---|---|
| (1) | (2) | (3) | (4) | ||
| 0.015 (0.11) | 0.024* (0.014) | ||||
| 0.093*** (0.009) | 0.102*** (0.01) | ||||
| -0.001 (0.001) | -0.002*** (0.001) | ||||
| 0.055*** (0.019) | 0.039** (0.019) | ||||
| -0.014*** (0.004) | -0.016*** (0.003) | ||||
| -0.002 (0.001) | 0.001 (0.001) | ||||
| 0.0003 (0.003) | -0.0001 (0.003) | ||||
注:*、**、***分别表示在10%、5%、1%的水平上显著,括号里的值为稳健标准误,下同。 |
表5 行政等级、城市规模与生态福利绩效的中介效应分析结果Table 5 Analysis results of mediating effects of administrative level, city size and ecological well-being performance |
| 行政等级对城市规模的影响 | ||||||
|---|---|---|---|---|---|---|
| R | R2 | MSE | F | df1 | df2 | p |
| 0.4636 | 0.2149 | 0.3928 | 52.2506 | 6 | 1145 | 0 |
| coeff | se | t | p | LLCI | ULCI | |
| 常数项 | 5.9879*** | 0.1239 | 48.3329 | 0 | 5.7449 | 6.2310 |
| 行政等级 | 0.4664*** | 0.0391 | 11.9428 | 0 | 0.3898 | 0.5430 |
| 产业结构 | 0.0017 | 0.0026 | 0.6568 | 0.5115 | -0.0033 | 0.0067 |
| 技术进步 | 0.1076** | 0.0541 | 1.9882 | 0.0470 | 0.0014 | 0.2139 |
| 外资依存度 | 0.0028 | 0.0101 | 0.2746 | 0.7837 | -0.0170 | 0.0225 |
| 城市绿化 | -0.0240*** | 0.0039 | -6.1351 | 0 | -0.0317 | -0.0163 |
| 城市紧凑度 | 0.0031 | 0.0076 | 0.4109 | 0.6812 | -0.0118 | 0.0180 |
| 行政等级、城市规模对生态福利绩效的影响 | ||||||
| R | R2 | MSE | F | df1 | df2 | p |
| 0.3289 | 0.1082 | 0.0464 | 19.8199 | 7 | 1144 | 0 |
| coeff | se | t | p | LLCI | ULCI | |
| 常数项 | -0.0163 | 0.0743 | -0.2189 | 0.8267 | -0.1620 | 0.1294 |
| 行政等级 | -0.0261* | 0.0142 | -1.8309 | 0.0674 | -0.0540 | 0.0019 |
| 城市规模 | 0.1078*** | 0.0102 | 10.6135 | 0 | 0.0879 | 0.1278 |
| 产业结构 | -0.0014 | 0.0009 | -1.6055 | 0.1087 | -0.0031 | 0.0003 |
| 技术进步 | 0.0430** | 0.0186 | 2.3039 | 0.0214 | 0.0064 | 0.0795 |
| 外资依存度 | -0.0146*** | 0.0035 | -4.2209 | 0 | -0.0214 | -0.0078 |
| 城市绿化 | 0.0010 | 0.0014 | 0.7054 | 0.4807 | -0.0017 | 0.0036 |
| 城市紧凑度 | -0.0002 | 0.0026 | -0.0104 | 0.9917 | -0.0051 | 0.0051 |
| 总效应 | Effect | se | t | p | LLCI | ULCI |
| 0.0242 | 0.0141 | 1.7223 | 0.0853 | -0.0034 | 0.0518 | |
| 直接效应 | Effect | se | t | p | LLCI | ULCI |
| -0.0261 | 0.0142 | -1.8309 | 0.0674 | -0.0540 | 0.0019 | |
| 间接(中介)效应 | Effect | BootSE | BootLLCI | BootULCI | ||
| 0.0503 | 0.0060 | 0.0388 | 0.0624 | |||
注:表中数据coeff为各解释变量对应的的回归系数;Effect表示效应的大小;LLCI和ULCI分别表示判断中介效应是否显著的上下界,置信度为95%,下同。 |
表6 分地区行政等级、城市规模与生态福利绩效的中介效应分析结果Table 6 Analysis results of mediating effect between administrative level, city size and ecological well-being performance by region |
| 行政等级对城市规模的影响 | |||||||||||
|---|---|---|---|---|---|---|---|---|---|---|---|
| 东部 | 中部 | 西部 | |||||||||
| coeff | LLCI | ULCI | coeff | LLCI | ULCI | coeff | LLCI | ULCI | |||
| 常数项 | 5.6084 | 5.2088 | 6.0079 | 6.3383 | 5.9201 | 6.7564 | 6.4185 | 6.0135 | 6.8236 | ||
| 行政等级 | 0.3965 | 0.2996 | 0.4933 | 0.5191 | 0.3616 | 0.6766 | 0.9367 | 0.7549 | 1.1186 | ||
| 产业结构 | -0.0007 | -0.0089 | 0.0075 | -0.0034 | -0.0116 | 0.0047 | -0.0091 | -0.0184 | 0.0002 | ||
| 技术进步 | -0.0395 | -0.2293 | 0.1450 | 0.1572 | 0.0011 | 0.3134 | 0.0655 | -0.1360 | 0.2669 | ||
| 外资依存度 | 0.0027 | -0.0335 | 0.0389 | 0.0126 | -0.0122 | 0.0374 | -0.1029 | -0.1606 | -0.0453 | ||
| 城市绿化 | 0.0148 | 0.0015 | 0.0282 | -0.0381 | -0.0504 | -0.0259 | -0.0379 | -0.0510 | -0.0248 | ||
| 城市紧凑度 | 0.0544 | 0.0279 | 0.0809 | 0.0054 | -0.0167 | 0.0275 | -0.0059 | -0.0413 | 0.0294 | ||
| 行政等级、城市规模对生态福利绩效的影响 | |||||||||||
| 东部 | 中部 | 西部 | |||||||||
| coeff | LLCI | ULCI | coeff | LLCI | ULCI | coeff | LLCI | ULCI | |||
| 常数项 | 0.2166 | -0.0364 | 0.4696 | -0.1525 | -0.3852 | 0.0801 | -0.0815 | -0.3825 | 0.2196 | ||
| 行政等级 | 0.0006 | -0.0395 | 0.0406 | -0.0409 | -0.0933 | 0.0116 | -0.1910 | -0.2653 | -0.1185 | ||
| 城市规模 | 0.0565 | 0.0208 | 0.0922 | 0.1516 | 0.1214 | 0.1817 | 0.1247 | 0.0829 | 0.1666 | ||
| 产业结构 | -0.0014 | -0.0045 | 0.0018 | -0.0047 | -0.0073 | -0.0021 | -0.0010 | -0.0042 | 0.0021 | ||
| 技术进步 | 0.2337 | 0.1624 | 0.3051 | -0.0956 | -0.1454 | -0.0458 | -0.0206 | -0.0882 | 0.0470 | ||
| 外资依存度 | -0.0260 | -0.0400 | -0.0120 | -0.0044 | -0.0123 | 0.0035 | -0.0021 | -0.0219 | 0.0177 | ||
| 城市绿化 | 0.0023 | -0.0029 | 0.0075 | 0.0032 | -0.0009 | 0.0072 | -0.0027 | -0.0074 | 0.0020 | ||
| 城市紧凑度 | 0.0110 | 0.0005 | 0.0214 | -0.0027 | -0.0098 | -0.0043 | 0.0085 | -0.0034 | 0.0204 | ||
| 总效应 | Effect | LLCI | ULCI | Effect | LLCI | ULCI | Effect | LLCI | ULCI | ||
| 0.0230 | -0.0149 | 0.0608 | 0.0378 | -0.0176 | 0.0932 | -0.0741 | -0.1391 | -0.0092 | |||
| 直接效应 | Effect | LLCI | ULCI | Effect | LLCI | ULCI | Effect | LLCI | ULCI | ||
| 0.0006 | -0.0395 | 0.0406 | -0.0409 | -0.0933 | 0.0116 | -0.1910 | -0.2635 | -0.1185 | |||
| 间接(中 介)效应 | Effect | BootLLCI | BootULCI | Effect | BootLLCI | BootULCI | Effect | BootLLCI | BootULCI | ||
| 0.0224 | 0.0083 | 0.0367 | 0.0787 | 0.0567 | 0.1009 | 0.1168 | 0.0658 | 0.1677 | |||
表7 逐步检验中介效应回归结果Table 7 Regression results of stepwise test mediating effect |
| 变量 | 模型(1) EWP | 模型(6) InPOP | 模型(7) EWP |
|---|---|---|---|
| 0.108*** (0.01) | |||
| 0.024* (0.014) | 0.466*** (0.039) | -0.026* (0.014) | |
| 控制变量 | 控制 | 控制 | 控制 |
| 1152 | 1152 | 1152 | |
| 0.02 | 0.215 | 0.108 |
表8 分地区逐步检验中介效应回归结果Table 8 Regression results of mediating effect by region |
| 变量 | 东部 | 中部 | 西部 | ||||||||
|---|---|---|---|---|---|---|---|---|---|---|---|
| (1) | (2) | (3) | (4) | (5) | (6) | (7) | (8) | (9) | |||
| 0.056*** (0.018) | 0.152*** (0.015) | 0.125*** (0.021) | |||||||||
| 0.023 (0.019) | 0.396*** (0.049) | 0.001 (0.020) | 0.038 (0.028) | 0.519*** (0.080) | -0.041 (0.027) | -0.074** (0.033) | 0.937*** (0.092) | -0.191*** (0.037) | |||
| 控制变量 | 控制 | 控制 | 控制 | 控制 | 控制 | 控制 | 控制 | 控制 | 控制 | ||
| 460 | 460 | 460 | 436 | 436 | 436 | 256 | 256 | 256 | |||
| 0.126 | 0.251 | 0.145 | 0.046 | 0.211 | 0.223 | 0.149 | 0.428 | 0.253 | |||
表9 行政等级、城市规模与生态福利绩效的中介效应分析结果(替代指标)Table 9 Mediating effect analysis results of administrative level, city size and ecological wel-being performance (alternative indicators) |
| 行政等级对城市规模的影响 | ||||||
|---|---|---|---|---|---|---|
| R | R2 | MSE | F | df1 | df2 | p |
| 0.3889 | 0.1512 | 0.4225 | 33.5850 | 6 | 1131 | 0 |
| coeff | se | t | p | LLCI | ULCI | |
| 常数项 | 6.3040*** | 0.1298 | 48.5543 | 0 | 6.0492 | 6.5587 |
| 行政等级 | 0.4143*** | 0.0413 | 10.0358 | 0 | 0.3333 | 0.4953 |
| 产业结构 | -0.0040 | 0.0027 | -1.5100 | 0.1313 | -0.0093 | 0.0012 |
| 技术进步 | 0.0455 | 0.0563 | 0.8082 | 0.4191 | -0.0650 | 0.1559 |
| 外资依存度 | -0.0030 | 0.0105 | -0.2814 | 0.7785 | -0.0237 | 0.0177 |
| 城市绿化 | -0.0253*** | 0.0041 | -6.4620 | 0 | -0.0343 | -0.0183 |
| 城市紧凑度 | -0.0103 | 0.0198 | -0.5221 | 0.6021 | -0.0494 | 0.0287 |
| 行政等级、城市规模对生态福利绩效的影响 | ||||||
| R | R2 | MSE | F | df1 | df2 | p |
| 0.3126 | 0.0977 | 0.0470 | 17.4812 | 7 | 1130 | 0 |
| coeff | se | t | p | LLCI | ULCI | |
| 常数项 | 0.0158 | 0.0761 | 0.2084 | 0.8350 | -0.1334 | 0.1651 |
| 行政等级 | -0.0169 | 0.0144 | -1.1782 | 0.2390 | -0.0451 | 0.0113 |
| 城市规模 | 0.0984*** | 0.0099 | 9.9169 | 0 | 0.0789 | 0.1178 |
| 产业结构 | -0.0010 | 0.0009 | -1.0753 | 0.2825 | -0.0027 | 0.0008 |
| 技术进步 | 0.0488*** | 0.0188 | 2.5976 | 0.0095 | 0.0119 | 0.0856 |
| 外资依存度 | -0.0134*** | 0.0035 | -3.7995 | 0.0002 | -0.0203 | -0.0065 |
| 城市绿化 | 0.0009 | 0.0014 | 0.6178 | 0.5369 | -0.0019 | 0.0036 |
| 城市紧凑度 | 0.0089 | 0.0061 | 1.4542 | 0.1472 | 0.0031 | 0.0209 |
| 总效应 | Effect | se | t | p | LLCI | ULCI |
| 0.0238 | 0.0143 | 1.6599 | 0.0972 | -0.0043 | 0.0520 | |
| 直接效应 | Effect | se | t | p | LLCI | ULCI |
| -0.0169 | 0.0144 | -1.1782 | 0.2390 | -0.0451 | 0.0113 | |
| 间接(中介)效应 | Effect | BootSE | BootLLCI | BootULCI | ||
| 0.0407 | 0.0056 | 0.0302 | 0.0519 | |||
表10 分地区行政等级、城市规模与生态福利绩效的中介效应分析结果(替代指标)Table 10 Mediating effect analysis results of administrative level, city size and ecological well-being performance by region (alternative indicators) |
| 行政等级对城市规模的影响 | |||||||||||
|---|---|---|---|---|---|---|---|---|---|---|---|
| 东部 | 中部 | 西部 | |||||||||
| coeff | LLCI | ULCI | coeff | LLCI | ULCI | coeff | LLCI | ULCI | |||
| 常数项 | 6.0474 | 5.6529 | 6.4419 | 6.4859 | 6.0361 | 6.9357 | 6.6183 | 6.1678 | 7.0687 | ||
| 行政等级 | 0.3840 | 0.2876 | 0.4804 | 0.4039 | 0.2232 | 0.5847 | 0.8834 | 0.6809 | 1.0860 | ||
| 产业结构 | -0.0075 | -0.0156 | 0.0005 | -0.0073 | -0.0160 | 0.0015 | -0.0114 | -0.0217 | -0.0011 | ||
| 技术进步 | -0.2293 | -0.4116 | -0.0471 | 0.1897 | 0.0232 | 0.3561 | 0.0711 | -0.1495 | 0.2916 | ||
| 外资依存度 | -0.0191 | -0.0550 | 0.0167 | 0.0067 | -0.0197 | 0.0332 | -0.0956 | -0.1645 | -0.0267 | ||
| 城市绿化 | 0.0104 | -0.0028 | 0.0237 | -0.0377 | -0.0507 | -0.0247 | -0.0418 | -0.0563 | -0.0273 | ||
| 城市紧凑度 | 0.0646 | 0.0384 | 0.0909 | 0.0175 | -0.0063 | 0.0414 | -0.0103 | -0.0494 | 0.0287 | ||
| 行政等级、城市规模对生态福利绩效的影响 | |||||||||||
| 东部 | 中部 | 西部 | |||||||||
| coeff | LLCI | ULCI | coeff | LLCI | ULCI | coeff | LLCI | ULCI | |||
| 常数项 | 0.2314 | -0.0369 | 0.4996 | -0.1366 | -0.3653 | 0.0920 | -0.0384 | -0.3308 | 0.2540 | ||
| 行政等级 | -0.0001 | -0.0404 | 0.0402 | -0.0101 | -0.0653 | 0.0450 | -0.1857 | -0.2569 | -0.1146 | ||
| 城市规模 | 0.0500 | 0.0137 | 0.0862 | 0.1482 | 0.1197 | 0.1768 | 0.1167 | 0.0778 | 0.1556 | ||
| 产业结构 | -0.0010 | -0.0042 | 0.0022 | -0.0044 | -0.0070 | -0.0017 | -0.0011 | -0.0043 | 0.0021 | ||
| 技术进步 | 0.2449 | 0.1730 | 0.3169 | -0.1029 | -0.1528 | -0.0529 | -0.0206 | -0.0885 | 0.0474 | ||
| 外资依存度 | -0.0241 | -0.0382 | -0.0101 | -0.0042 | -0.0121 | 0.0036 | 0.0036 | -0.0179 | 0.0251 | ||
| 城市绿化 | 0.0024 | -0.0028 | 0.0076 | 0.0028 | -0.0012 | 0.0069 | -0.0031 | -0.0078 | 0.0017 | ||
| 城市紧凑度 | 0.0111 | 0.0006 | 0.0217 | -0.0045 | -0.0117 | 0.0026 | 0.0089 | -0.0031 | 0.0209 | ||
| 总效应 | Effect | LLCI | ULCI | Effect | LLCI | ULCI | Effect | LLCI | ULCI | ||
| 0.0190 | -0.0190 | 0.0571 | 0.0497 | -0.0104 | 0.1099 | -0.0827 | -0.1492 | -0.0161 | |||
| 直接效应 | Effect | LLCI | ULCI | Effect | LLCI | ULCI | Effect | LLCI | ULCI | ||
| -0.0001 | -0.0404 | 0.0402 | -0.0101 | -0.0653 | 0.0450 | -0.1857 | -0.2569 | -0.1146 | |||
| 间接(中 介)效应 | Effect | BootLLCI | BootULCI | Effect | BootLLCI | BootULCI | Effect | BootLLCI | BootULCI | ||
| 0.0192 | 0.0053 | 0.0333 | 0.0599 | 0.0397 | 0.0805 | 0.1031 | 0.0557 | 0.1509 | |||
| [1] |
刘传明, 刘一丁, 马青山. 环境规制与经济高质量发展的双向反馈效应研究. 经济与管理评论, 2021, 37(3): 111-122.
[
|
| [2] |
彭程, 陈志芬, 吴华瑞, 等. 基于ESDA的城市可持续发展能力时空分异格局研究. 中国人口·资源与环境, 2016, 26(2): 144-151.
[
|
| [3] |
肖周燕. 政府调控、市场机制与城市发展. 中国人口·资源与环境, 2016, 26(4): 40-47.
[
|
| [4] |
乐云, 李永奎, 胡毅, 等. “政府—市场”二元作用下我国重大工程组织模式及基本演进规律. 管理世界, 2019, 35(4): 17-27.
[
|
| [5] |
刘志彪, 凌永辉. 结构转换、全要素生产率与高质量发展. 管理世界, 2020, 36(7): 15-29.
[
|
| [6] |
程承坪, 朱明达. 大数据时代的政府与市场关系探讨. 中国软科学, 2019, (9): 185-192.
[
|
| [7] |
中华人民共和国民政部编. 中华人民共和国行政区划简册2020. 北京: 中国地图出版社, 2020.
[ Ministry of Civil Affairs of the People's Republic of China. Summary of Administrative Divisions of the People's Republic of China 2020. Beijing: Sinomap Press, 2020.]
|
| [8] |
王开泳, 陈田, 刘毅. “行政区划本身也是一种重要资源”的理论创新与应用. 地理研究, 2019, 38(2): 195-206.
[
|
| [9] |
李澎, 刘若阳, 李健. 中国城市行政等级与资源配置效率. 经济地理, 2016, 36(10): 46-51, 59.
[
|
| [10] |
王志锋, 王优容, 王云亭, 等. 城市行政等级与经济增长: 基于开发区的视角. 宏观经济研究, 2017, (11): 115-127.
[
|
| [11] |
魏海涛, 刘玲. 基于数据包络分析方法的城市生态效率研究. 区域经济评论, 2016, (4): 152-160.
[
|
| [12] |
罗楚亮, 薛进军. 城市层级与城镇居民收入差距. 劳动经济研究, 2015, 3(5): 69-92.
[
|
| [13] |
刘修岩, 贺小海, 殷醒民. 市场潜能与地区工资差距: 基于中国地级面板数据的实证研究. 管理世界, 2007, 23(9): 48-55.
[
|
| [14] |
傅鸿鹏, 单楠, 苏健婷, 等. 我国地级市卫生服务供需特点及其对社区卫生发展的影响. 中华医院管理杂志, 2011, (5): 331-334.
[
|
| [15] |
NORMAN, MYERS. Financing Change, the Financial Community, Eco-efficiency and Sustainable Development. Cambridge: MIT Press, 1996.
|
| [16] |
|
| [17] |
方时姣, 肖权. 中国区域生态福利绩效水平及其空间效应研究. 中国人口·资源与环境, 2019, 29(3): 1-10.
[
|
| [18] |
臧漫丹, 诸大建, 刘国平. 生态福利绩效: 概念, 内涵及G20实证. 中国人口·资源与环境, 2013, 23(5): 118-124.
[
|
| [19] |
李佳佳, 罗能生. 城市规模对生态效率的影响及区域差异分析. 中国人口·资源与环境, 2016, 26(2): 129-136.
[
|
| [20] |
王珍珍, 穆怀中. 城市规模、门槛效应与人力资本外部性. 上海行政学院学报, 2018, 19(2): 88-99.
[
|
| [21] |
郭晓丹, 张军, 吴利学. 城市规模、生产率优势与资源配置. 管理世界, 2019, 35(4): 77-89.
[
|
| [22] |
林永然, 耿楚宇. 城市人口规模对流动人口教育回报率的影响. 城市问题, 2019, (2): 89-95.
[
|
| [23] |
许诺, 吕拉昌, 黄茹, 等. 中国城市人口迁移和创新. 地域研究与开发, 2016, 35(2): 165-169.
[
|
| [24] |
武俊奎. 城市规模、结构与碳排放. 上海: 复旦大学, 2012.
[
|
| [25] |
刘习平, 宋德勇. 城市产业集聚对城市环境的影响. 城市问题, 2013, (3): 9-15.
[
|
| [26] |
|
| [27] |
文雯, 王奇. 城市人口规模与环境污染之间的关系: 基于中国285个城市面板数据的分析. 城市问题, 2017, (9): 32-38.
[
|
| [28] |
KRUGMAN. Increasing return sand economic geography. Journal of Political Economy, 1991, 99(3): 483-499.
|
| [29] |
陆铭. 城市发展如何达到高效且包容. 中国青年社会科学, 2018, 37(1): 30-34.
[
|
| [30] |
余吉祥, 沈坤荣. 跨省迁移、经济集聚与地区差距扩大. 经济科学, 2013, (2): 33-44.
[
|
| [31] |
李成宇, 张士强, 张伟, 等. 中国省际生态福利绩效测算及影响因素研究. 地理科学, 2019, 39(12): 1875-1883.
[
|
| [32] |
杨国梁, 刘文斌, 郑海军. 数据包络分析方法(DEA)综述. 系统工程学报, 2013, 28(6): 840-860.
[
|
| [33] |
王冉, 孙涛. 基于超效率DEA模型的环境规制对中国区域绿色经济效率影响研究. 生态经济, 2019, 35(11): 131-136.
[
|
| [34] |
马占新. 广义参考集DEA模型及其相关性质. 系统工程与电子技术, 2012, 34(4): 709-714.
[
|
| [35] |
温忠麟, 叶宝娟. 中介效应分析: 方法和模型发展. 心理科学进展, 2014, 22(5): 731-745.
[
|
| [36] |
成金华, 孙琼, 郭明晶, 等. 中国生态效率的区域差异及动态演化研究. 中国人口·资源与环境, 2014, 24(1): 47-54.
[
|
| [37] |
付丽娜, 陈晓红, 冷智花. 基于超效率DEA模型的城市群生态效率研究: 以长株潭“3+5”城市群为例. 中国人口·资源与环境, 2013, 23(4): 169-175.
[
|
| [38] |
龙亮军, 王霞. 上海市生态福利绩效评价研究. 中国人口·资源与环境, 2017, 27(2): 84-92.
[
|
| [39] |
徐维祥, 徐志雄, 刘程军. 黄河流域地级城市土地集约利用效率与生态福利绩效的耦合性分析. 自然资源学报, 2021, 36(1): 114-130.
[
|
| [40] |
肖黎明, 吉荟茹. 绿色技术创新视域下中国生态福利绩效的时空演变及影响因素: 基于省域尺度的数据检验. 科技管理研究, 2018, 38(17): 243-251.
[
|
| [41] |
肖黎明, 张仙鹏. 强可持续理念下绿色创新效率与生态福利绩效耦合协调的时空特征. 自然资源学报, 2019, 34(2): 312-324.
[
|
| [42] |
徐昱东, 亓朋, 童临风. 中国省级地区生态福利绩效水平时空分异格局研究. 区域经济评论, 2017, (4): 123-131.
[
|
| [43] |
联合国开发计划署. 中国人类发展报告2013. 北京: 中国对外翻译出版公司, 2013.
[ United Nations Development Programme. China Human Development Report 2013. Beijing: China International Translation and Publishing Corporation, 2013.]
|
| [44] |
龙亮军, 王霞, 郭兵. 基于改进DEA模型的城市生态福利绩效评价研究: 以我国35个大中城市为例. 自然资源学报, 2017, 32(4): 595-605.
[
|
| [45] |
孙钰, 王坤岩, 姚晓东. 基于DEA交叉效率模型的城市公共基础设施经济效益评价. 中国软科学, 2015, (1): 172-183.
[
|
| [46] |
光明日报. 增强中心城市辐射带动力, 2019-01-22.
[ Guangming Daily. Enhance the power of radiation belt in central cities, 2019-01-22.]
|
| [47] |
光明日报: 提高中心城市和城市群综合承载能力,2020-01-13.
[ Guangming Daily: Improve the comprehensive carrying capacity of central cities and urban agglomerations, 2020-01-13.]
|
/
| 〈 |
|
〉 |