
东北典型黑土区耕地轮作休耕的空间重构
|
宋戈(1969- ),女,黑龙江庆安人,博士,教授,博士生导师,研究方向为土地利用与管理。E-mail: songgelaoshi@163.com |
收稿日期: 2021-10-25
修回日期: 2022-03-23
网络出版日期: 2022-12-28
基金资助
国家自然科学基金项目(41971247)
国家自然科学基金项目(41571165)
国家社会科学基金重大项目(19ZDA096)
Spatial reconstruction of farmland rotation and fallow in the typical black soil region of Northeast China
Received date: 2021-10-25
Revised date: 2022-03-23
Online published: 2022-12-28
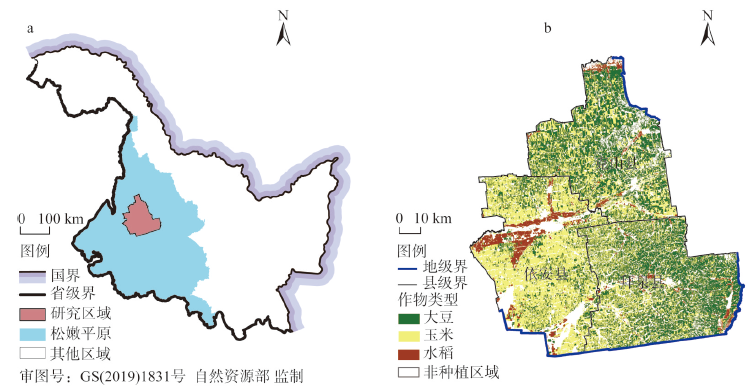
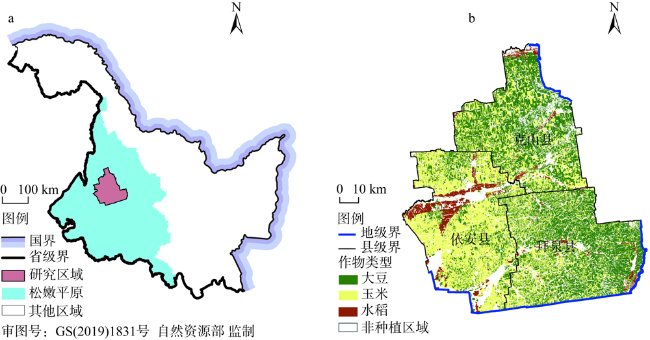
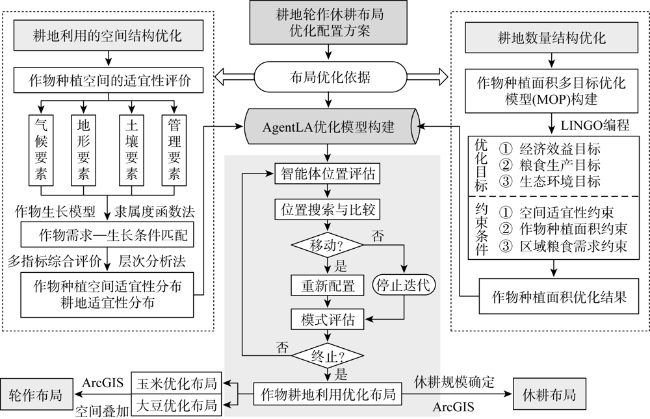
轮作休耕是保障黑土区耕地资源可持续利用的重要手段。科学合理确定粮食作物轮作休耕的耕地利用规模及空间分布,对实现黑土区耕地修养生息、提升地力和平衡粮食供求结构具有重要意义。以东北典型黑土区——克山县、拜泉县和依安县为研究区,运用作物种植空间适宜性评价模型、多目标优化(MOP)模型和智能体土地布局优化配置(AgentLA)模型,基于地块尺度构建耕地轮作和休耕布局,适度调整轮作休耕规模及分布。结果发现:(1)研究区主要作物种植适宜性高值和低值区存在明显空间差异。玉米和大豆种植适宜性高值区交汇于依安县北部和克山县西部,是玉米—大豆轮作优势区域。主要作物种植适宜性低值区交汇于依安县南部和拜泉县西南部,是休耕的重点区域。(2)基于种植结构优化的轮作规模实现了大豆种植比例增加和玉米种植比例减少,缓解了目前玉米阶段性供大于求、大豆供给不足的现实矛盾。通过设定多种粮食供求情景确定休耕规模有利于灵活应对粮食市场变动。(3)兼顾耕地空间适宜性和集聚性的轮作休耕布局有利于充分利用耕地资源禀赋比较优势、发展规模化经营,对提高耕地利用效率具有重要作用。研究通过科学重构黑土区耕地轮作和休耕空间布局,实现了耕地空间适宜性、空间集聚性、种植结构合理性和粮食供求稳定性的同步提升,为实现黑土区耕地资源合理可持续利用和粮食安全提供政策参考。
宋戈 , 张红梅 . 东北典型黑土区耕地轮作休耕的空间重构[J]. 自然资源学报, 2022 , 37(9) : 2231 -2246 . DOI: 10.31497/zrzyxb.20220903
Rotation and fallow are important means to ensure the sustainable utilization of cultivated land resources in black soil regions. Determining the scale and spatial distribution of cultivated land for crop rotation and fallow scientifically is of great significance for undertaking land reclamation, improving soil fertility, and balancing the structure of food supply and demand in the black soil regions. Taking the typical black soil regions in Northeast China: Keshan county, Baiquan county, and Yi'an county as the research area, this paper reconstructs the farmland rotation and fallow layout at the plot scale by using the crop planting suitability evaluation model, multi-objective optimization (MOP) model, and agent-based land layout optimization allocation (AgentLA) model. Findings show that: (1) There are obvious spatial differences between high-value and low-value areas of the planting suitability of main crops. The high-value areas of corn and soybean planting suitability intersect in the north of Yi'an and the west of Keshan, which are the dominant areas of corn-soybean rotation. And the low-value areas converge in the south of Yi'an and the southwest of Baiquan, which are the key areas for fallow farming. (2) The crop rotation scale based on the optimization of the planting structure has achieved an increase in the proportion of soybean planting and a decrease in corn planting, alleviating the contradiction between the current phased oversupply of corn and insufficient supply of soybeans. Determining the scale of fallow by setting a variety of food supply and demand scenarios is conducive to flexibly responding to changes in the food market. (3) A rotation and fallow layout that takes into account the planting suitability and agglomeration of cultivated land is conducive to making full use of the comparative advantages of cultivated land resource endowments, developing large-scale operations, and playing an important role in improving the efficiency of cultivated land use. This research has helped to realize the simultaneous improvement of the spatial suitability, spatial agglomeration, rationality of planting structure, and the stability of food supply and demand of cultivated land, by rationally reconstructing the farmland rotation and fallow space in the black soil region, which provides policy reference for realizing sustainable utilization of cultivated land resources and food security in black soil regions.
表1 作物种植空间适宜性评价指标体系、量化标准与权重Table 1 Crop planting suitability evaluation index system, suitability standards and weights |
| 要素层 | 指标层 | 标准与权重 (a~b, c, d, w) | ||
|---|---|---|---|---|
| 大豆 | 玉米 | 水稻 | ||
| 气候 | 生育期日平均气温/℃ | 20~23, 15, 25, 0.0941 | 20~23, 16, 28, 0.0797 | 22~24, 16, 28, 0.0678 |
| 生育期降水量/mm | 450~500, 270, 680, 0.1078 | 450~500, 220, 630, 0.1448 | —, —, —, 0.1231 | |
| ≥10 ℃积温/℃ | >2500, 2000, —, 0.2467 | >2800, 2300, —, 0.2630 | >2600, 2300, —, 0.2237 | |
| 地形 | 坡度/% | 0~8, —, 30, 0.0419 | 0~8, —, 30, 0.0295 | 0~2, —, 8, 0.1827 |
| 地貌类型 | —, —, —, 0.0839 | —, —, —, 0.0886 | —, —, —, 0.0609 | |
| 土壤 | 土壤质地 | —, —, —, 0.0613 | —, —, —, 0.0727 | —, —, —, 0.0121 |
| 土层厚度/cm | >50, —, —, 0.0568 | > 50, —, —, 0.0340 | >100, —, —, 0.0383 | |
| 有机质/(g/kg) | —, —, —, 0.0305 | —, —, —, 0.0340 | —, —, —, 0.0121 | |
| 速效钾/(mg/kg) | —, —, —, 0.0146 | —, —, —, 0.0139 | —, —, —, 0.0050 | |
| 有效磷/(mg/kg) | —, —, —, 0.0146 | —, —, —, 0.0139 | —, —, —, 0.0050 | |
| pH | 6.0~6.5, 5.2, 7.5, 0.1101 | 5.0~7.0, 5.2, 8.0, 0.1076 | 5.5~6.0, 5.2, 8.2, 0.0258 | |
| 管理 | 灌溉潜力 | —, —, —, 0.0386 | —, —, —, 0.0259 | —, —, —, 0.0841 |
| 排涝能力 | —, —, —, 0.0551 | —, —, —, 0.0445 | —, —, —, 0.0841 | |
| 耕作便利度 | —, —, —, 0.0092 | —, —, —, 0.0075 | —, —, —, 0.0146 | |
| 田块形状系数 | —, —, —, 0.0183 | —, —, —, 0.0201 | —, —, —, 0.0319 | |
| 防护林密度 | —, —, —, 0.0165 | —, —, —, 0.0201 | —, —, —, 0.0290 | |
注:各指标适宜性标准参考值分别按照a~b, c, d, w的顺序列出,其中a~b为指标最适范围;c、d分别为指标最低和最高阈值;w为指标权重;“—”表示相应指标无标准限制值。 |
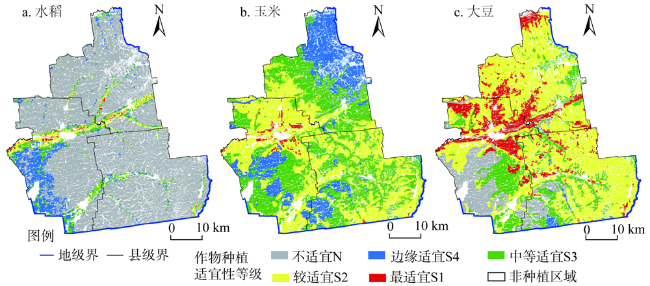
表2 研究区主要作物种植空间适宜性分级统计Table 2 Classification statistics of main crop planting suitability in the study area |
| 作物 类型 | 适宜性等级 | N | S4 | S3 | S2 | S1 |
|---|---|---|---|---|---|---|
| 适宜性分值 | 0 | (0, 75] | (75, 80] | (80, 85] | (85, 100] | |
| 水稻 | 面积/km2 | 6798.41 | 694.89 | 475.09 | 286.37 | 52.66 |
| 比例/% | 81.84 | 8.36 | 5.72 | 3.45 | 0.63 | |
| 玉米 | 面积/km2 | 0.02 | 1572.16 | 3317.53 | 3318.62 | 99.10 |
| 比例/% | 0 | 18.93 | 39.93 | 39.95 | 1.19 | |
| 大豆 | 面积/km2 | 1051.28 | 62.13 | 1375.34 | 4671.95 | 1146.73 |
| 比例/% | 12.65 | 0.75 | 16.56 | 56.24 | 13.80 |
表3 研究区耕地现状数量结构与优化结果的效益损失比较Table 3 Comparison of the benefit loss between current cultivated land use structure and the optimization results in the study area |
| 经济效益损失 | 粮食总产量效益损失 | 大豆总产量效益损失 | 环境效益损失 | 生态效益损失 | 整体效益损失 | |
|---|---|---|---|---|---|---|
| 现状 | 0.31 | 0.19 | 0.45 | 0.12 | 0.14 | 0.24 |
| 优化 | 0.26 | 0.25 | 0.06 | 0.06 | 0.09 | 0.15 |
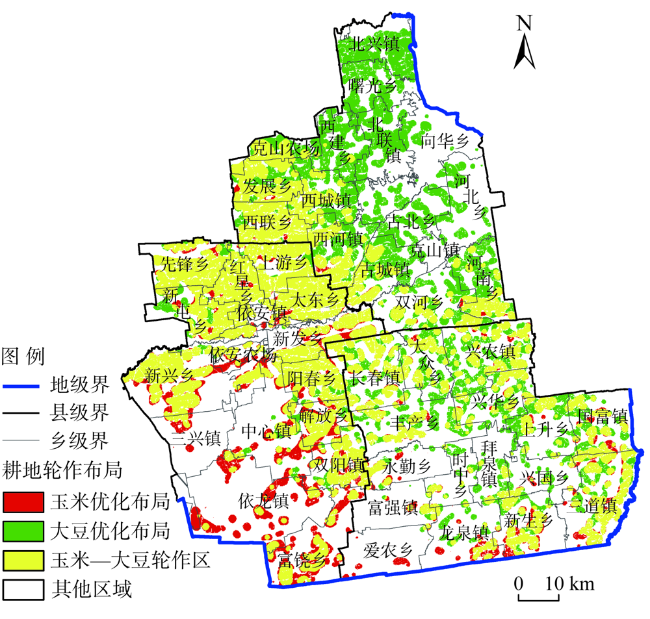
表4 研究区耕地轮作布局面积统计及与现状对比Table 4 Statistics on the area of cultivated land rotation layout in the study area and its comparison with the status quo |
| 县名 | 2018年轮作实施现状 | 2019年轮作实施现状 | 耕地轮作布局优化结果 | ||||||
|---|---|---|---|---|---|---|---|---|---|
| 面积/km2 | 占耕地总 面积比例/% | 面积/km2 | 占耕地总 面积比例/% | 栅格个数 (100 m×100 m) | 面积/km2 | 占耕地总 面积比例/% | |||
| 克山 | 435.60 | 5.24 | 488.27 | 5.88 | 65483 | 654.83 | 7.88 | ||
| 依安 | 181.42 | 2.18 | 288.16 | 3.47 | 139023 | 1390.23 | 16.73 | ||
| 拜泉 | 442.94 | 5.33 | 509.60 | 6.13 | 73908 | 739.08 | 8.89 | ||
| 合计 | 1059.96 | 12.76 | 1286.04 | 15.48 | 278414 | 2784.14 | 33.51 | ||
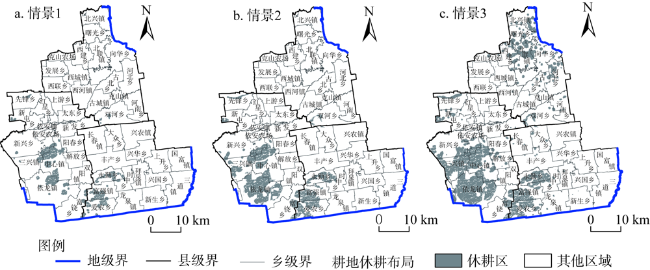
表5 不同情景下研究区耕地休耕布局面积统计Table 5 Statistics on the area of cultivated land fallow layout in different scenarios in the study area |
| 县名 | 情景1 | 情景2 | 情景3 | |||||
|---|---|---|---|---|---|---|---|---|
| 栅格个数 (100 m×100 m) | 占耕地总 面积比例/% | 栅格个数 (100 m×100 m) | 占耕地总 面积比例/% | 栅格个数 (100 m×100 m) | 占耕地总 面积比例/% | |||
| 克山 | 980 | 0.12 | 1584 | 0.19 | 36202 | 4.36 | ||
| 依安 | 26445 | 3.18 | 58085 | 6.99 | 96025 | 11.56 | ||
| 拜泉 | 14121 | 1.70 | 23423 | 2.82 | 33957 | 4.09 | ||
| 合计 | 41546 | 5.00 | 83092 | 10.00 | 166184 | 20.00 | ||
| [1] |
赵其国, 滕应, 黄国勤. 中国探索实行耕地轮作休耕制度试点问题的战略思考. 生态环境学报, 2017, 26(1): 1-5.
[
|
| [2] |
陈展图, 杨庆媛. 中国耕地休耕制度基本框架构建. 中国人口·资源与环境, 2017, 27(12): 126-136.
[
|
| [3] |
黄国勤, 赵其国. 中国典型地区轮作休耕模式与发展策略. 土壤学报, 2018, 55(2): 283-292.
[
|
| [4] |
石飞, 杨庆媛, 王成, 等. 行动者网络视角的生态退化区耕地休耕管护模式: 以贵州省松桃县为例. 自然资源学报, 2021, 36(11): 2892-2912.
[
|
| [5] |
王盼, 阎建忠, 杨柳, 等. 轮作休耕对劳动力转移的影响: 以河北、甘肃、云南三省为例. 自然资源学报, 2019, 34(11): 2348-2362.
[
|
| [6] |
杨人豪, 杨庆媛, 印文, 等. 基于结构方程模型的休耕地管护意愿及行为分析: 以河北省邢台市为例. 干旱区地理, 2020, 43(1): 260-270.
[
|
| [7] |
吴萍. 构建耕地轮作休耕生态补偿制度的思考. 农村经济, 2017, (10): 112-117.
[
|
| [8] |
石飞, 杨庆媛, 王成, 等. 基于耕地能值—生态足迹的耕地休耕规模研究: 以贵州省松桃县为例. 生态学报, 2021, 41(14): 5747-5763.
[
|
| [9] |
|
| [10] |
杨庆媛, 毕国华, 陈展图, 等. 喀斯特生态脆弱区休耕地的空间配置研究: 以贵州省晴隆县为例. 地理学报, 2018, 73(11): 2250-2266.
[
|
| [11] |
赵雲泰, 黄贤金, 钟太洋, 等. 区域虚拟休耕规模与空间布局研究. 水土保持通报, 2011, 31(5): 103-107.
[
|
| [12] |
|
| [13] |
FAO. Land evaluation towards a revised framework. Rome: Food and Agriculture Organization of the United Nations, 2007: 107.
|
| [14] |
|
| [15] |
任意, 黄健, 薛彦东. 东北玉米优势区耕地质量专题评价. 北京: 中国农业出版社, 2017.
[
|
| [16] |
全国农业技术推广服务中心, 农业部耕地质量监测保护中心, 东北农业大学. 东北水稻优势区耕地质量专题评价. 北京: 中国农业出版社, 2017.
[National Agro-Tech Extension and Service Center, Cultivated Land Quality Monitoring and Protection Ceter, Ministry of Agriculture and Rural Affairs, PRC, Northeast Agricultural University. Thematic Evaluation of Cultivated Land Quality in Rice Superiority Areas in Northeast China. Beijing: China Agriculture Press, 2017.]
|
| [17] |
全国农业技术推广服务中心, 农业部耕地质量监测保护中心, 黑龙江省农业科学院. 东北大豆优势区耕地质量专题评价. 北京: 中国农业出版社, 2017.
[National Agro-Tech Extension and Service Center, Cultivated Land Quality Monitoring and Protection Ceter, Ministry of Agriculture and Rural Affairs, PRC, Heilongjiang Academy of Agricultural Sciences. Thematic Evaluation of Cultivated Land Quality in Soybean Superiority Areas in Northeast China. Beijing: China Agriculture Press, 2017.]
|
| [18] |
刘东辉. 主要作物气候适宜性评价指标体系的研究. 黑龙江农业科学, 1991, (4): 9-14.
[
|
| [19] |
孙扬越, 申双和. 作物生长模型的应用研究进展. 中国农业气象, 2019, 40(7): 444-459.
[
|
| [20] |
|
| [21] |
周浩, 雷国平, 杨雪昕, 等. 基于AgentLA模型的农田精准灌溉管理分区研究. 水土保持学报, 2018, 32(1): 274-279, 285.
[
|
| [22] |
谭术魁, 韩思雨, 张路. 粮食安全视角下粮食主产区耕地休耕规模及动态仿真研究. 中国土地科学, 2020, 34(2): 9-17.
[
|
| [23] |
刘卫柏, 杨胜苏, 李中, 等. 重金属污染治理试点地区农户对耕地休耕政策的满意度及其影响因素. 经济地理, 2021, 41(1): 158-164.
[
|
/
| 〈 |
|
〉 |