
基于函数极值条件下的中国碳达峰碳中和情景分析
|
唐志鹏(1978- ),男,四川成都人,博士,副研究员,研究方向为经济地理与区域可持续发展。E-mail: tangzp@igsnrr.ac.cn |
收稿日期: 2021-07-18
修回日期: 2021-09-22
网络出版日期: 2022-07-28
基金资助
国家自然科学基金项目(42042027)
国家自然科学基金项目(41771135)
The scenario analysis of China's carbon emission peak and carbon neutrality based on extremum condition of function
Received date: 2021-07-18
Revised date: 2021-09-22
Online published: 2022-07-28
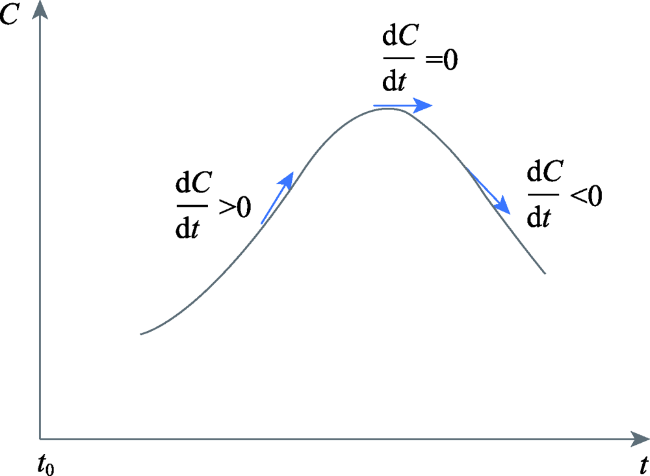
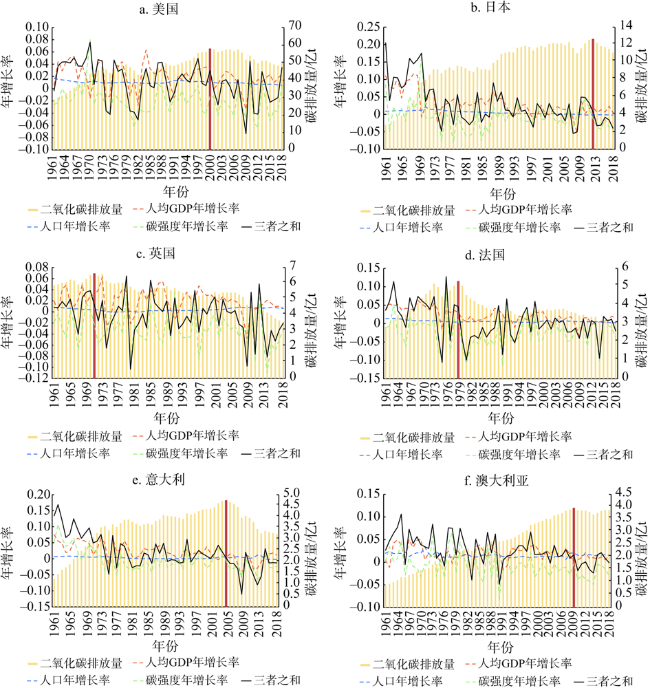
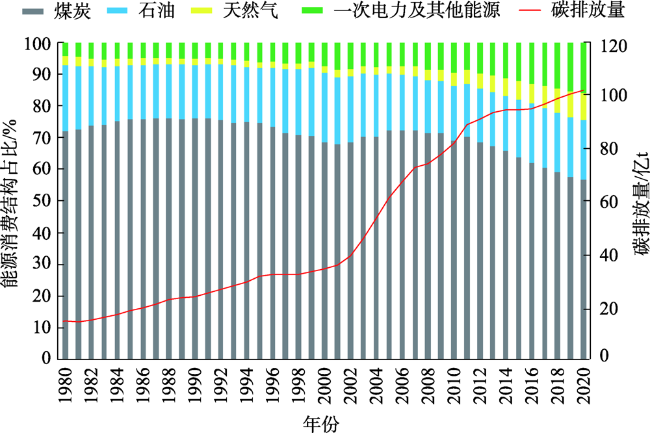
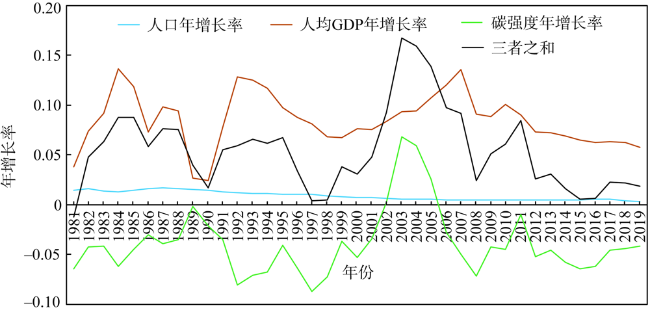
基于函数极值条件提出了碳达峰出现时间和需要满足的理论条件,并对主要发达国家作了验证,同时对中国现状做了分析,最后采用了基准和强化两种情景分析了中国实现2030年碳达峰后进入2060年碳中和时期的二氧化碳排放量。研究结果显示:(1)根据IPAT恒等式将碳排放函数分解成人口、人均GDP和碳强度三个因素时,碳峰值出现时间为三个因素年增长率之和由正转负的正数值年度,发达国家的历史数据证实了这一条件。(2)中国三个因素年增长率之和自2003年起已经开始降低,最近几年一直在0.01~0.02徘徊,表明总体上朝着有利于碳达峰的方向发展,同时按照三个因素的预期发展目标计算得出中国2030年碳排放峰值的上限为112.2亿t,若2021—2035年保持相同的人均GDP年均复合增长率,碳强度年均复合增长率的绝对值需要比人均GDP年均复合增长率高0.14个百分点。(3)在能源消费总量逐渐回落的前提条件下,2060年基准情景下非化石能源占比约为65%,产生的二氧化碳量约为31.4亿t,强化情景下非化石能源占比约为70%,二氧化碳排放约为26.6亿t,而碳汇和CCUS等固碳技术还存在不确定性,碳中和任务依然艰巨。实现碳达峰碳中和最终需要控制能源消费,践行低碳消费行为。
唐志鹏 , 于浩杰 , 陈明星 , 程嘉梵 . 基于函数极值条件下的中国碳达峰碳中和情景分析[J]. 自然资源学报, 2022 , 37(5) : 1247 -1260 . DOI: 10.31497/zrzyxb.20220510
To respond to global climate change, reducing carbon dioxide emissions is one of the vital goals of China's medium- to long-term development. Based on the extremum condition of function, this paper studies the theoretical conditions of carbon peak, and verifies the results based on examples of some main developed countries. It also analyzes present situation in China according to the above conditions, and finally forecasts China's carbon dioxide emissions during the process of carbon neutrality in 2060 after carbon emission peak in 2030 under baseline and enhanced scenarios. The results are shown as follows: (1) Based on an IPAT approach, carbon dioxide emission function is divided into three factors of population, per capita GDP and carbon intensity. The year of carbon peak emerges when the sum of the annual growth rates of the three factors changes from positive to negative. This conclusion has been verified by the historical data of selected main developed countries. (2) According to the historical data of China's population, per capita GDP and carbon intensity, the sum of the annual growth rates of the three factors has declined since 2003 and fluctuated between 0.01 and 0.02 in recent years, which indicates that there is a positive trend towards carbon emission peak generally. Moreover, according to the expected development goals of the three factors, the upper limit of China's carbon dioxide emission peak in 2030 is 11.22 billion tons. If the compound annual per capita GDP growth rate keeps unchanged from 2021 to 2035, the absolute value of compound annual growth rate of carbon intensity needs to be 0.14% higher than that of per capita GDP. (3) Given the premise condition that the total energy consumption decreases gradually, in 2060, the proportion of non-fossil energy is about 65% and the carbon dioxide emission is about 3.14 billion tons under the baseline scenario, while it is about 70% and 2.66 billion tons respectively under the enhanced scenario. However, carbon sequestration technologies such as carbon sink and CCUS are still uncertain, and the task of carbon neutrality is still arduous. To achieve carbon peak and carbon neutrality, it is crucial that energy consumption should be controlled and low-carbon consumption behavior should be advocated.
表1 中国一次能源消费结构历史值及其趋势外延预测值Table 1 Historical value and trend in forecast value of China's primary energy consumption structure (%) |
| 年份 | 煤炭 | 石油 | 天然气 | 一次电力及其他能源(非化石能源) | 年份 | 煤炭 | 石油 | 天然气 | 一次电力及其他能源(非化石能源) |
|---|---|---|---|---|---|---|---|---|---|
| 2011 | 70.2 | 16.8 | 4.6 | 8.4 | 2021 | 55.4 | 19.1 | 8.9 | 16.6 |
| 2012 | 68.5 | 17.0 | 4.8 | 9.7 | 2022 | 54.0 | 19.3 | 9.4 | 17.4 |
| 2013 | 67.4 | 17.1 | 5.3 | 10.2 | 2023 | 52.7 | 19.4 | 9.8 | 18.1 |
| 2014 | 65.8 | 17.3 | 5.6 | 11.3 | 2024 | 51.4 | 19.4 | 10.3 | 18.9 |
| 2015 | 63.8 | 18.4 | 5.8 | 12.0 | 2025 | 50.1 | 19.5 | 10.8 | 19.6 |
| 2016 | 62.2 | 18.7 | 6.1 | 13.0 | 2026 | 48.8 | 19.5 | 11.3 | 20.3 |
| 2017 | 60.6 | 18.9 | 6.9 | 13.6 | 2027 | 47.6 | 19.6 | 11.8 | 21.1 |
| 2018 | 59.0 | 18.9 | 7.6 | 14.5 | 2028 | 46.4 | 19.6 | 12.2 | 21.8 |
| 2019 | 57.7 | 18.9 | 8.1 | 15.3 | 2029 | 45.3 | 19.6 | 12.7 | 22.4 |
| 2020 | 56.8 | 18.9 | 8.5 | 15.8 | 2030 | 44.2 | 19.6 | 13.1 | 23.1 |
表2 2030—2060年中国一次能源消费结构基准情景和强化情景对应的能源消费量和碳排放量Table 2 Total energy consumption and carbon dioxide emissions corresponding to baseline and enhanced scenarios of China's primary energy consumption structure in 2030-2060 |
| 年份 | 煤炭/% | 石油/% | 天然气/% | 一次电力及其他能源(非化石能源)/% | 能源消费量/亿t | 碳排放量 /亿t | |
|---|---|---|---|---|---|---|---|
| 基准情景 | 2030 | 42.4 | 17.6 | 15.0 | 25.0 | 60.0 | 104.6 |
| 2040 | 25.0 | 13.5 | 16.5 | 45.0 | 55.0 | 67.0 | |
| 2050 | 17.0 | 10.2 | 17.8 | 55.0 | 50.0 | 47.9 | |
| 2060 | 9.0 | 7.5 | 18.5 | 65.0 | 45.0 | 31.4 | |
| 强化情景 | 2030 | 42.4 | 17.6 | 15.0 | 25.0 | 60.0 | 104.6 |
| 2040 | 23.0 | 13.7 | 13.3 | 50.0 | 55.0 | 61.5 | |
| 2050 | 13.0 | 9.2 | 17.8 | 60.0 | 50.0 | 41.5 | |
| 2060 | 7.0 | 6.5 | 16.5 | 70.0 | 45.0 | 26.6 |
| [1] |
|
| [2] |
|
| [3] |
|
| [4] |
|
| [5] |
何建坤. 中国的能源发展与应对气候变化. 中国人口·资源与环境, 2011, 21(10): 40-48.
[
|
| [6] |
马丁, 陈文颖. 基于中国TIMES模型的碳排放达峰路径. 清华大学学报: 自然科学版, 2017, 57(10): 1070-1075.
[
|
| [7] |
|
| [8] |
|
| [9] |
|
| [10] |
王宪恩, 赵思涵, 刘晓宇, 等. 碳中和目标导向的省域消费端碳排放减排模式研究: 基于多区域投入产出模型. 生态经济, 2021, 37(5): 43-50.
[
|
| [11] |
吴郧, 余碧莹, 邹颖, 等. 碳中和愿景下电力部门低碳转型路径研究. 中国环境管理, 2021, 13(3): 48-55.
[
|
| [12] |
蔡兆男, 成里京, 李婷婷, 等. 碳中和目标下的若干地球系统科学和技术问题分析. 中国科学院院刊, 2021, 36(5): 602-613.
[
|
| [13] |
邓柏盛, 宋德勇. 我国对外贸易、FDI与环境污染之间关系的研究: 1995-2005. 国际贸易问题, 2008, (4): 101-108.
[
|
| [14] |
邓吉祥, 刘晓, 王铮. 中国碳排放的区域差异及演变特征分析与因素分解. 自然资源学报, 2014, 29(2): 189-200.
[
|
| [15] |
唐祎祺. 中国及各省区能源碳排放达峰路径分析. 杭州: 浙江大学, 2020.
[
|
| [16] |
潘栋, 李楠, 李锋, 等. 基于能源碳排放预测的中国东部地区达峰策略制. 环境科学学报, 2021, 41(3): 1142-1152.
[
|
| [17] |
宋德勇, 卢忠宝. 中国碳排放影响因素分解及其周期性波动研究. 中国人口·资源与环境, 2009, 19(3): 18-24.
[
|
| [18] |
王俊松, 贺灿飞. 能源消费、经济增长与中国CO2排放量变化: 基于LMDI方法的分解分析. 长江流域资源与环境, 2010, 19(1): 18-23.
[
|
| [19] |
杜强, 陈乔, 陆宁. 基于改进IPAT模型的中国未来碳排放预测. 环境科学学报, 2012, 32(9): 2294-2302.
[
|
| [20] |
|
| [21] |
金婷婷, 童霞, 刘静娴. 模拟情形下中国能源消费和碳排放的预测分析. 南通职业大学学报, 2021, 35(1): 58-62.
[
|
| [22] |
唐志鹏, 刘卫东, 公丕萍. 出口对中国区域碳排放影响的空间效应测度: 基于1997-2007年区域间投入产出表的实证分析. 地理学报, 2014, 69(10): 1403-1413.
[
|
| [23] |
唐志鹏, 刘卫东, 宋涛. 基于混合地理加权回归的中国省域碳生产率影响因素分析. 资源科学, 2017, 39(12): 2223-2232.
[
|
| [24] |
田华征, 马丽. 中国工业碳排放强度变化的结构因素解析. 自然资源学报, 2020, 35(3): 639-653.
[
|
| [25] |
沈杨, 汪聪聪, 高超, 等. 基于城市化的浙江省湾区经济带碳排放时空分布特征及影响因素分析. 自然资源学报, 2020, 35(2): 329-342.
[
|
| [26] |
|
| [27] |
张楠. 基于CGE模型的全国碳排放峰值目标区域分配方法研究. 天津: 天津科技大学, 2017.
[
|
| [28] |
夏楚瑜, 李艳, 叶艳妹, 等. 基于净生产力生态足迹模型的工业碳排放效应、影响因素与情景模拟. 生态学报, 2017, 37(11): 3862-3871.
[
|
| [29] |
谭丹, 黄贤金. 我国东、中、西部地区经济发展与碳排放的关联分析及比较. 中国人口·资源与环境, 2008, 18(3): 54-57.
[
|
| [30] |
IPCC. IPCC guidelines for national greenhouse gas inventories. Institute for Global Environmental Strategies, 2006.
|
| [31] |
国家统计局能源统计司. 中国能源统计年鉴2019. 北京: 中国统计出版社, 2020.
[Department of Energy Statistics, National Bureau of Statistics.China Energy Statistical Yearbook 2019. Beijing: China Statistics Publishing House, 2020.]
|
| [32] |
|
| [33] |
|
| [34] |
|
| [35] |
丁胜, 温作民. 长三角地区碳排放影响因素分析: 基于IPAT改进模型. 技术经济与管理研究, 2014, (9): 106-109.
[
|
| [36] |
朱宇恩, 李丽芬, 贺思思, 等. 基于IPAT模型和情景分析法的山西省碳排放峰值年预测. 资源科学, 2016, 38(12): 2316-2325.
[
|
| [37] |
曲建升, 刘莉娜, 曾静静, 等. 中国居民生活碳排放增长路径研究. 资源科学, 2017, 39(12): 2389-2398.
[
|
| [38] |
胡振, 何晶晶, 王玥. 基于IPAT-LMDI扩展模型的日本家庭碳排放因素分析及启示. 资源科学, 2018, 40(9): 1831-1842.
[
|
| [39] |
|
| [40] |
|
| [41] |
United Nations Department of Economic and Social Affairs. Population dynamics in world population prospects 2019, https://population.un.org/wpp2019/Download/Standard/Population, 2021-09-09.
|
| [42] |
|
| [43] |
黄震, 谢晓敏. 碳中和愿景下的能源变革. 中国科学院院刊, 2021, 36(9): 1010-1018.
[
|
| [44] |
陈晓红, 胡东滨, 曹文治, 等. 数字技术助推我国能源行业碳中和目标实现的路径探析. 中国科学院院刊, 2021, 36(9): 1019-1029.
[
|
/
| 〈 |
|
〉 |