
中国耕地低碳利用绩效测算与时空分异
|
吴昊玥(1996- ),女,四川德阳人,博士研究生,主要从事耕地利用碳源/汇研究。E-mail: tsuki710064315@163.com |
收稿日期: 2021-11-05
修回日期: 2022-01-05
网络出版日期: 2022-07-28
基金资助
国家自然科学基金项目(71704127)
Estimation and spatio-temporal divergence of the low-carbon performance of cropland use in China
Received date: 2021-11-05
Revised date: 2022-01-05
Online published: 2022-07-28
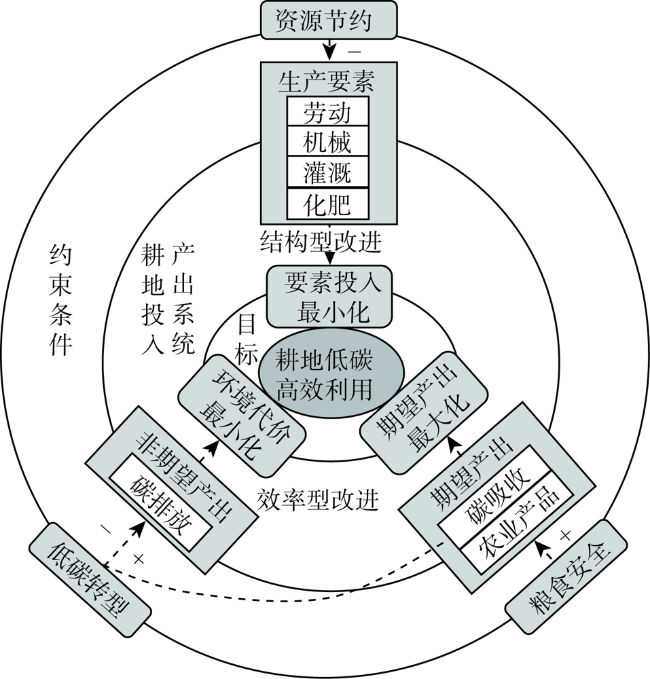
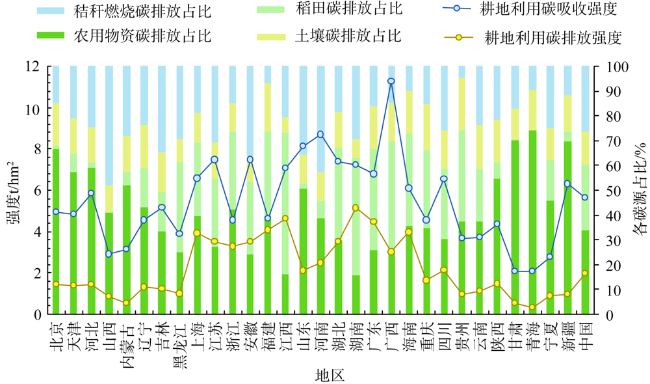
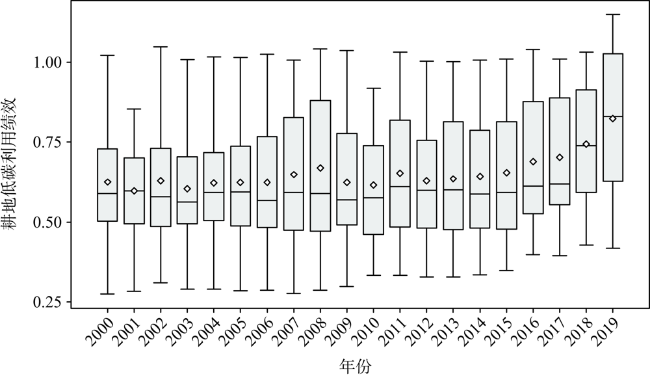
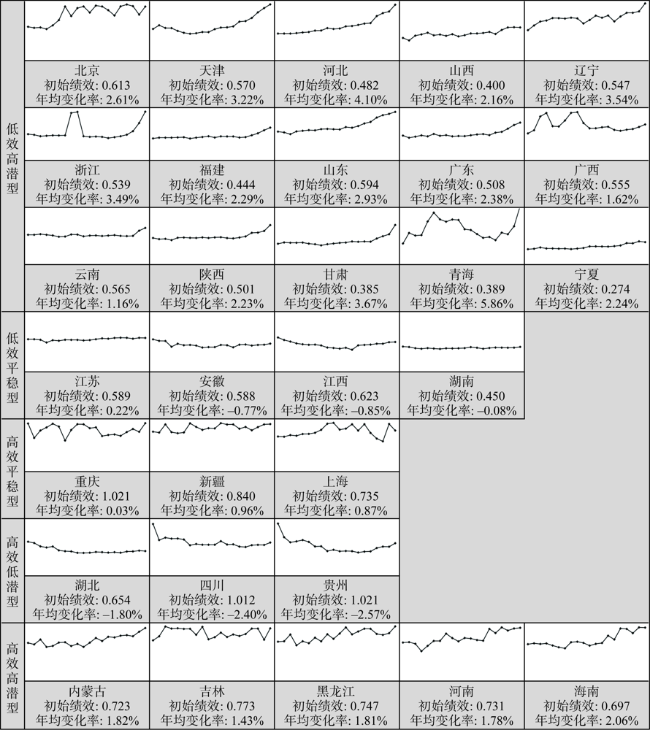
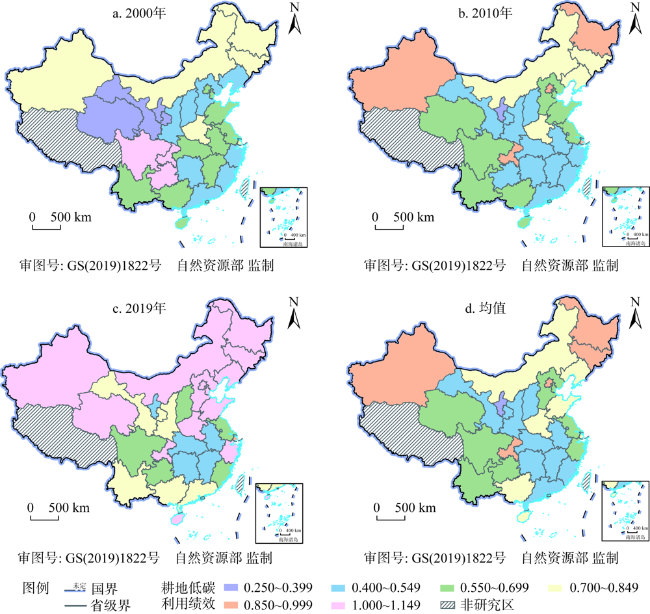
推进耕地利用低碳转型是应对气候暖化威胁的有效途径。在核算耕地利用碳排放、碳吸收基础上,应用GB-US-S-SBM模型测算2000—2019年中国30个省(市、自治区)的耕地低碳利用绩效,进而分析绩效时空特征及收敛性。研究发现:(1)中国耕地利用碳排放、碳吸收、净碳汇强度依次为1.980 t∙hm-2、5.624 t∙hm-2、3.644 t∙hm-2,各省份耕地利用系统均呈碳盈余状态。 (2)全国耕地低碳利用绩效历经剧烈起伏、缓慢上升、波动不定、高速增长四个阶段。根据初始绩效和变化率,可将省域划分为低效高潜型(北京等15地)、低效平稳型(江苏等4地)、高效平稳型(重庆等3地)、高效低潜型(湖北等3地)、高效高潜型(吉林等5地)。期初,高、低效省份分别聚集于西南、西北;期末,高效省份主要位于西北、东北,低效省份集中分布于长江中游地区。(3)全国、中部、东部的绩效不存在σ收敛,东北和西部的绩效遵循σ收敛。全国及四大区域绩效均呈β收敛,省份间存在追赶趋势。本文可为制定区域差异化耕地利用低碳转型策略提供依据。
吴昊玥 , 孟越 , 黄瀚蛟 , 陈文宽 . 中国耕地低碳利用绩效测算与时空分异[J]. 自然资源学报, 2022 , 37(5) : 1148 -1163 . DOI: 10.31497/zrzyxb.20220504
The low-carbon transition of cropland use can help to mitigate climate change to a certain extent. Based on carbon emissions accounting and sequestration of cropland use, this paper attempted to develop a theoretical framework for analyzing the low-carbon performance of cropland use. Then, the GB-US-S-SBM was applied to assess the performance in China's 30 provincial-level regions (hereafter provinces) from 2000 to 2019, and to examine the spatiotemporal characteristics. The study found that: (1) Overall, the intensities of carbon emissions, sequestration and net sequestration were 1.980 t∙hm-2, 5.624 t∙hm-2, and 3.644 t∙hm-2, respectively, indicating that the cropland use system was a major carbon sink. (2) Nationwide, the low-carbon performance of cropland use went through four stages, namely, ups and downs, slow growth, fluctuation, and fast growth. According to the initial performance and growth rate, the provinces were classified into five types, namely, low performance with high potential (15 provinces such as Beijing), low performance with stable trend (4 provinces such as Jiangsu), high stable performance (3 provinces such as Chongqing), high performance with low potential (3 provinces such as Hubei), and high performance with high potential (5 provinces such as Jilin). At the early stage, provinces with high performance were clustered in the southwest, while those with low performance were agglomerated in the northwest. High-performance provinces were mainly located in the northwest and northeast, and low-performance provinces were distributed in the middle reaches of the Yangtze River. (3) σ convergence was not observed in the performance of the whole country, central region, or eastern region, while the performance of northeastern and western region strictly followed σ convergence. Both China and its four regions exhibited β convergence, indicating that provinces tended to chase each other in performance. This paper may provide a basis for the differentiated low-carbon transition of regional cropland use.
表1 耕地利用碳效应类别、机理及核算公式来源Table 1 Source, mechanism, and reference for accounting for the carbon flux of cropland use |
表2 耕地低碳利用绩效投入产出指标体系及描述性统计分析Table 2 Input-output indicators for measuring the low-carbon performance of cropland use |
| 指标类型 | 具体指标 | 计算方式 | 单位 | 均值 | 标准差 | 最小值 | 最大值 | |
|---|---|---|---|---|---|---|---|---|
| 投入 | 劳动要素 | 地均从业人数 | 种植业从业人数/耕地面积 | Person∙hm-2 | 1.522 | 0.881 | 0.163 | 6.205 |
| 机械要素 | 地均机械动力 | 农业机械总动力/耕地面积 | kW∙hm-2 | 0.497 | 0.244 | 0.102 | 1.209 | |
| 灌溉要素 | 地均灌溉用水 | 农业灌溉用水总量/耕地面积 | 104 m3∙hm-2 | 7.538 | 3.720 | 1.678 | 17.544 | |
| 肥料要素 | 地均化肥施用量 | 化肥施用量/耕地面积 | t∙hm-2 | 0.394 | 0.268 | 0.075 | 1.381 | |
| 期望产出 | 经济产出 | 地均农业产值 | 种植业总产值/耕地面积 | 104 CNY∙hm-2 | 2.259 | 1.518 | 0.363 | 10.404 |
| 生态产出 | 地均碳吸收量 | 作物碳吸收量/耕地面积 | t∙hm-2 | 5.558 | 2.310 | 1.403 | 14.764 | |
| 非期望产出 | 环境代价 | 地均碳排放量 | 耕地利用碳排放量/耕地面积 | t∙hm-2 | 2.276 | 1.488 | 0.245 | 5.865 |
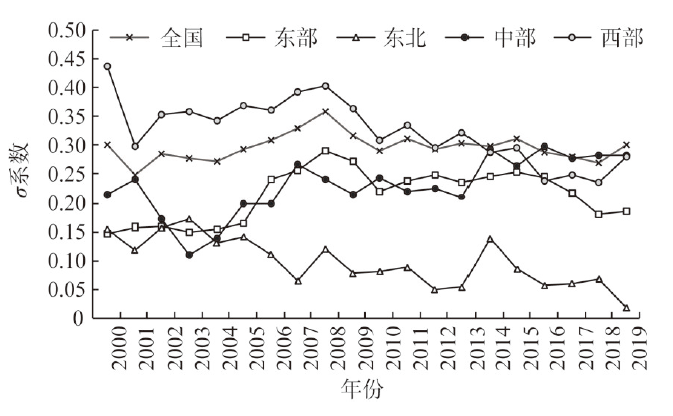
表3 中国及区域耕地低碳利用绩效β收敛检验Table 3 convergence test for the low-carbon performance of cropland use in China and its regions |
| 检验类型 | 项目 | 全国 | 东部 | 东北 | 中部 | 西部 |
|---|---|---|---|---|---|---|
| 绝对β收敛 | β | -0.245*** | -0.119** | -0.533*** | -0.273*** | -0.331*** |
| t-statistics | -7.92 | -2.35 | -4.49 | -4.62 | -6.29 | |
| R2 | 0.1042 | 0.1300 | 0.2758 | 0.1665 | 0.1674 | |
| 条件β收敛 | β | -0.246*** | -0.154*** | -0.732*** | -0.280*** | -0.335*** |
| t-statistics | -7.82 | -2.93 | -5.66 | -4.55 | -6.25 | |
| R2 | 0.1242 | 0.1849 | 0.4045 | 0.2334 | 0.2064 | |
| 样本数/个 | 540 | 190 | 57 | 114 | 209 |
注:**、***分别表示系数在5%、1%的显著性水平下通过t检验。 |
| [1] |
贾根锁. IPCC《气候变化与土地特别报告》对陆气相互作用的新认知. 气候变化研究进展, 2020, 16(1): 9-16.
[
|
| [2] |
田云, 张俊飚. 中国农业生产净碳效应分异研究. 自然资源学报, 2013, 28(8): 1298-1309.
[
|
| [3] |
于贵瑞, 王秋凤, 朱先进. 区域尺度陆地生态系统碳收支评估方法及其不确定性. 地理科学进展, 2011, 30(1): 103-113.
[
|
| [4] |
|
| [5] |
|
| [6] |
李颖, 黄贤金, 甄峰. 江苏省区域不同土地利用方式的碳排放效应分析. 农业工程学报, 2008, 24(s2): 102-107.
[
|
| [7] |
|
| [8] |
|
| [9] |
李波, 张俊飚, 李海鹏. 中国农业碳排放时空特征及影响因素分解. 中国人口·资源与环境, 2011, 21(8): 80-86.
[
|
| [10] |
丁宝根, 杨树旺, 赵玉, 等. 中国耕地资源利用的碳排放时空特征及脱钩效应研究. 中国土地科学, 2019, 33(12): 45-54.
[
|
| [11] |
李俊杰. 民族地区农地利用碳排放测算及影响因素研究. 中国人口·资源与环境, 2012, 22(9): 42-47.
[
|
| [12] |
李波, 刘雪琪, 梅倩, 等. 湖北省农地利用方式变化的碳效应特征与空间差异. 中国人口·资源与环境, 2018, 28(10): 62-70.
[
|
| [13] |
周思宇, 郗凤明, 尹岩, 等. 东北地区耕地利用碳排放核算及驱动因素. 应用生态学报, 2021, 32(11): 3865-3871.
[
|
| [14] |
|
| [15] |
|
| [16] |
陈丽, 郝晋珉, 王峰, 等. 基于碳循环的黄淮海平原耕地固碳功能研究. 资源科学, 2016, 38(6): 1039-1053.
[
|
| [17] |
尹钰莹, 郝晋珉, 牛灵安, 等. 河北省曲周县农田生态系统碳循环及碳效率研究. 资源科学, 2016, 38(5): 918-928.
[
|
| [18] |
胡乔利, 沈彦俊, 陈福军, 等. 冀中南地区农田生物生产力与碳截获能力时空变化分析. 地理科学, 2012, 32(2): 219-224.
[
|
| [19] |
常虹, 杨武, 石磊, 等. 基于土地利用的北方农牧交错区碳固定和土壤保持时空变化. 农业资源与环境学报, 2021, 38(3): 484-493.
[
|
| [20] |
王莉雁, 肖燚, 欧阳志云, 等. 国家级重点生态功能区县生态系统生产总值核算研究: 以阿尔山市为例. 中国人口·资源与环境, 2017, 27(3): 146-154.
[
|
| [21] |
方精云, 郭兆迪, 朴世龙, 等. 1981-2000年中国陆地植被碳汇的估算. 中国科学: D辑: 地球科学, 2007, 37(6): 804-812.
[
|
| [22] |
|
| [23] |
卢新海, 匡兵, 李菁. 碳排放约束下耕地利用效率的区域差异及其影响因素. 自然资源学报, 2018, 33(4): 657-668.
[
|
| [24] |
|
| [25] |
|
| [26] |
吴昊玥, 黄瀚蛟, 何艳秋, 等. 净碳排放约束下的中国耕地利用效率评价及空间关联研究. 浙江农业学报, 2019, 31(9): 1563-1574.
[
|
| [27] |
|
| [28] |
柯楠, 卢新海, 匡兵, 等. 碳中和目标下中国耕地绿色低碳利用的区域差异与影响因素. 中国土地科学, 2021, 35(8): 67-76.
[
|
| [29] |
|
| [30] |
杨滨键, 孙红雨. 低碳绩效测度与动态效应研究: 以山东省种植业为例. 中国生态农业学报, 2021, 29(03): 581-589.
[
|
| [31] |
冀正欣, 王秀丽, 李玲, 等. 南阳盆地区耕地利用效率演变及其影响因素. 自然资源学报, 2021, 36(3): 688-701.
[
|
| [32] |
国家发展和改革委员会. 省级温室气体清单编制指南[试行]. 北京: 国家发展和改革委员会, 2011.
[PRC National Development and Reform Commission. Guidelines for the Preparation of Provincial Greenhouse Gas Inventories (Trial). Beijing: PRC National Development and Reform Commission, 2011.]
|
| [33] |
程琳琳. 中国农业碳生产率时空分异: 机理与实证. 武汉: 华中农业大学, 2018.
[
|
| [34] |
|
| [35] |
|
| [36] |
|
| [37] |
田云, 张俊飚. 中国低碳农业发展的动态演进及收敛性研究. 干旱区资源与环境, 2017, 31(3): 1-7.
[
|
| [38] |
|
/
| 〈 |
|
〉 |
