
中国三大海洋经济圈海洋经济发展区域差异与分布动态及影响因素
|
李旭辉(1981- ),男,山东烟台人,博士,副教授,硕士生导师,研究方向为区域经济。E-mail: xhliac@163.com |
收稿日期: 2021-08-02
要求修回日期: 2021-12-03
网络出版日期: 2022-06-28
基金资助
国家社会科学基金重大项目(20&ZD136)
上海市教育委员会科研创新计划重大项目(2021-01-07-00-02-E00127)
安徽省高校优秀青年人才支持计划重点项目(gxyqZD2020088)
国家统计局全国统计科学研究重点项目(2021LZ13)
版权
Study on regional differentiation, distribution dynamics and influencing factors of marine economic development in three major marine economic circles of China
Received date: 2021-08-02
Request revised date: 2021-12-03
Online published: 2022-06-28
Copyright
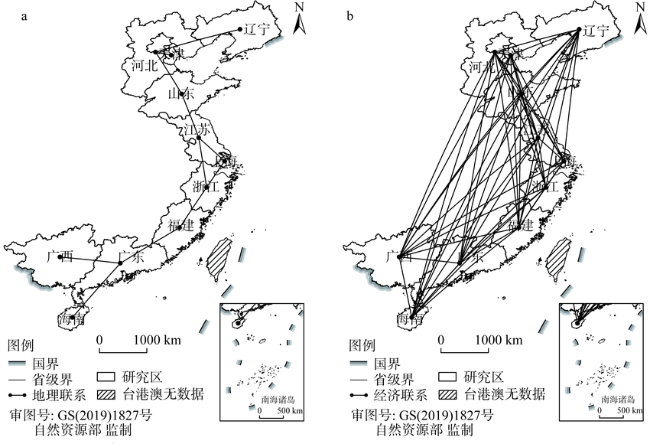
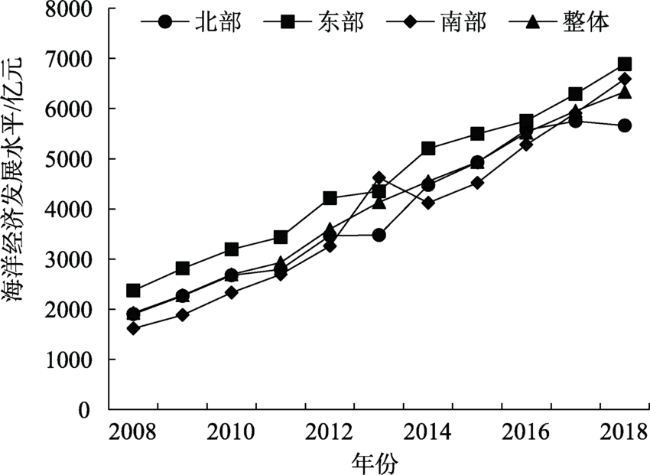
考察中国海洋三大经济圈海洋经济发展区域差异,探究其分布动态演进规律,识别其空间非均衡的影响因素及空间溢出效应,为“十四五”期间优化海洋经济发展空间布局、推动区域海洋经济协同均衡发展提供决策参考。利用Dagum基尼系数及其分解方法考察三大海洋经济圈海洋经济发展区域相对差异的程度、来源及演变态势,在此基础上,进一步应用Kernel密度估计方法刻画其绝对差异的分布动态演进过程,并将空间效应纳入研究框架,应用空间计量分析方法识别海洋经济发展空间非均衡的影响因素及空间溢出效应。研究发现:三大海洋经济圈海洋经济发展均呈现稳定上升态势,但三者之间存在显著的分级现象;三大海洋经济圈空间非均衡程度显著,超变密度是造成三大海洋经济圈整体区域差异的主要来源;三大海洋经济圈海洋经济发展水平“极化效应”显著,呈现不同极化特征和分布延展性;三大海洋经济圈海洋经济发展存在显著的空间依赖性,总体表现为空间正相关。
李旭辉 , 何金玉 , 严晗 . 中国三大海洋经济圈海洋经济发展区域差异与分布动态及影响因素[J]. 自然资源学报, 2022 , 37(4) : 966 -984 . DOI: 10.31497/zrzyxb.20220409
This paper examines the spatial differentiation characteristics and distribution dynamics of marine economic development in China's three major marine economic circles and identifies the influencing factors of its spatial disequilibrium and spatial spillover, which can provide decision-making reference for optimizing the spatial layout of marine economic development and promoting the coordinated and balanced development of regional marine economy during the 14th Five-Year Plan period (2021-2025). We use Gagum Gini coefficient and its decomposition method to investigate the degree, source and evolution trend of regional relative differences in marine economic development in the three marine economic circles (hereafter three circles). The kernel density estimation method is further used to describe the distribution dynamic evolution process of absolute difference. And we apply spatial econometric analysis to identify the key factors of marine economic development and spatial spillover effects. The results show that: (1) The development level of marine economy in the three circles has shown a steady upward trend, however, there is a significant differentiation among the three. The overall development level of marine economy shows a spatial pattern of eastern circle > northern circle > southern circle. (2) There is a significant spatial disequilibrium degree of the three circles, with a rising fluctuation trend and a deeping regional imbalance. The degree of regional difference between the southern and northern circles is the largest, and the degree of regional difference in the southern circle is the first among the three circles. The overall difference is mainly due to the cross overlapping effect between groups, and the contribution of intra-group difference is higher than that of inter-group difference. (3) The "polarization effect" of the marine economic development level of the three circles is significant, which presents different types of polarization trends. The three major circles as a whole and the northern circle have gradually strengthened from polarization to multipolar differentiation. The spatial agglomeration effect of the eastern circle is enhanced. The southern circle has always shown a multi-level differentiation trend. (4) There is significant spatial dependence in the development of marine economy in the three circles, and the overall performance is characterized by positive spatial correlation. Capital, labor force, innovation driven, marketization and opening-up have positive regional spillover effect, while environmental regulation has negative regional spillover effect. Capital, labor force, innovation-driven force and marketization have significant positive interregional spillover effects, while environmental regulation and opening-up have no significant interregional spillover effects.
表1 三大海洋经济圈2008年及2018年海洋经济整体分布状况Table 1 Overall distribution of marine economy in the three major marine economic circles of China in 2008 and 2018 |
| 2008年 | 2018年 | |
|---|---|---|
| 第一等级 | 山东、广东、上海 | 山东、广东、上海 |
| 第二等级 | 浙江、福建 | 江苏、浙江、福建 |
| 第三等级 | 辽宁、天津、河北、江苏 | 辽宁、天津 |
| 第四等级 | 广西、海南 | 河北、广西、海南 |
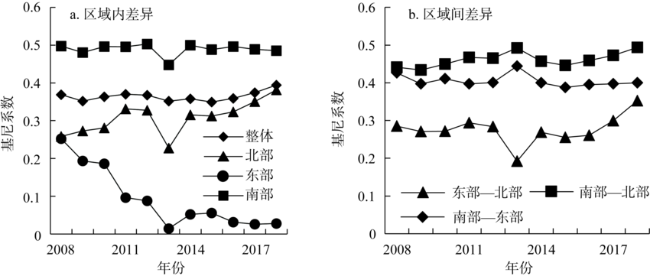
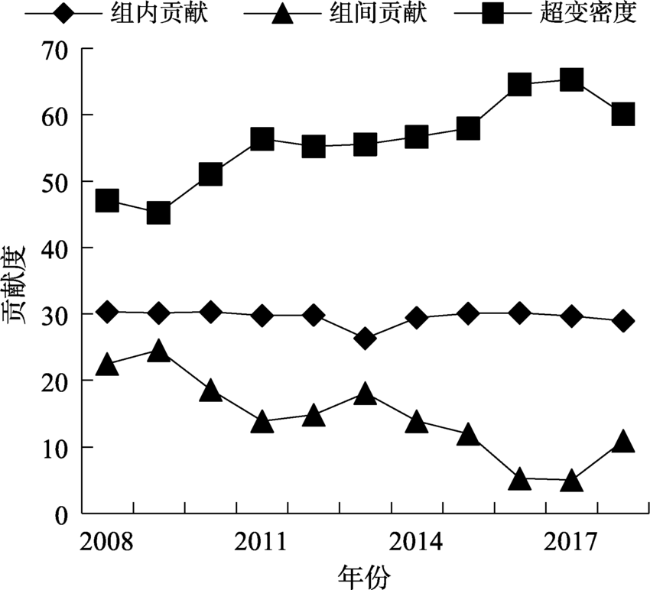
表2 Dagum基尼系数及其分解结果Table 2 Dagum Gini coefficient and its decomposition result |
| 年份 | 总体差异 | 组内差异 | 组间差异 | 贡献率/% | ||||||||
|---|---|---|---|---|---|---|---|---|---|---|---|---|
| 1 | 2 | 3 | 2→1 | 3→1 | 3→2 | Gw | Gnb | Gt | ||||
| 2008 | 0.3688 | 0.2583 | 0.2525 | 0.4974 | 0.2850 | 0.4410 | 0.4266 | 30.37 | 22.52 | 47.11 | ||
| 2009 | 0.3521 | 0.2727 | 0.1934 | 0.4805 | 0.2711 | 0.4336 | 0.3972 | 30.18 | 24.56 | 45.26 | ||
| 2010 | 0.3632 | 0.2810 | 0.1863 | 0.4962 | 0.2715 | 0.4497 | 0.4109 | 30.35 | 18.57 | 51.08 | ||
| 2011 | 0.3701 | 0.3312 | 0.0961 | 0.4958 | 0.2941 | 0.4669 | 0.3970 | 29.81 | 13.87 | 56.32 | ||
| 2012 | 0.3675 | 0.3275 | 0.0881 | 0.5028 | 0.2836 | 0.4653 | 0.4007 | 29.85 | 14.89 | 55.26 | ||
| 2013 | 0.3518 | 0.2274 | 0.0145 | 0.4477 | 0.1919 | 0.4920 | 0.4441 | 26.32 | 18.10 | 55.58 | ||
| 2014 | 0.3578 | 0.3152 | 0.0522 | 0.4996 | 0.2692 | 0.4566 | 0.3998 | 29.46 | 13.88 | 56.66 | ||
| 2015 | 0.3494 | 0.3126 | 0.0560 | 0.4881 | 0.2553 | 0.4458 | 0.3876 | 30.07 | 11.95 | 57.98 | ||
| 2016 | 0.3594 | 0.3233 | 0.0313 | 0.4962 | 0.2605 | 0.4592 | 0.3954 | 30.17 | 5.24 | 64.59 | ||
| 2017 | 0.3741 | 0.3508 | 0.0262 | 0.4889 | 0.2995 | 0.4728 | 0.3970 | 29.67 | 5.06 | 65.26 | ||
| 2018 | 0.3940 | 0.3815 | 0.0279 | 0.4855 | 0.3521 | 0.4938 | 0.3999 | 28.97 | 10.96 | 60.07 | ||
注:分组代号1、2、3分别代表北部海洋经济圈、东部海洋经济圈、南部海洋经济圈。Gw为组内成分,Gnb为组间成分,Gt为超变密度成分,G=Gw+Gnb+Gt。 |
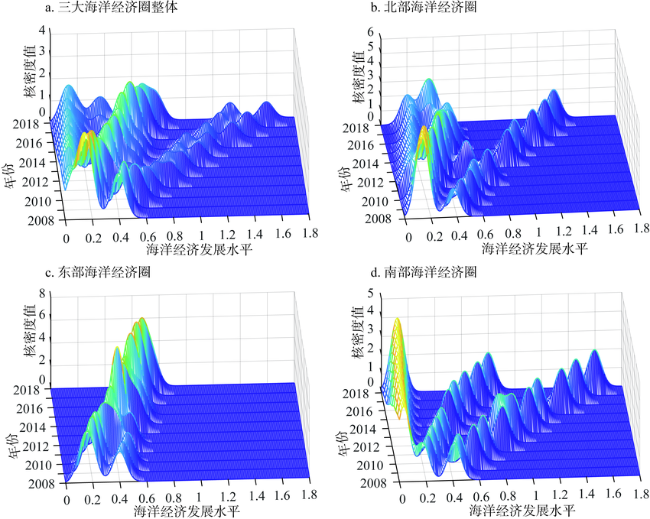
图5 三大海洋经济圈海洋经济发展水平三维核密度Fig. 5 Kernel density map of marine economic development level of the three major marine economic circles in China |
表3 三大海洋经济圈海洋经济发展的分布动态演进特征Table 3 Distribution and dynamic evolution characteristics of marine economic development in the three major marine economic circles of China |
| 全国 | 分布位置 | 主峰分布形态 | 分布延展性 | 极化趋势 |
|---|---|---|---|---|
| 整体 | 右移 | 波峰下降,宽度扩大 | 右拖尾,延展拓宽 | 多极化趋势 |
| 北部海洋经济圈 | 右移 | 波峰下降,宽度扩大 | 右拖尾,延展拓宽 | 多极化趋势 |
| 东部海洋经济圈 | 右移 | 波峰上升,宽度缩小 | 右拖尾,延展拓宽 | 无极化趋势 |
| 南部海洋经济圈 | 右移 | 波峰下降,宽度扩大 | 右拖尾,延展拓宽 | 多极化趋势 |
表4 海洋经济发展水平空间相关性Table 4 Spatial correlation of marine economic development level |
| 年份 | Moran's I | P值 | 年份 | Moran's I | P值 |
|---|---|---|---|---|---|
| 2008 | 0.405 | 0.005 | 2014 | 0.467 | 0.001 |
| 2009 | 0.456 | 0.003 | 2015 | 0.467 | 0.001 |
| 2010 | 0.453 | 0.002 | 2016 | 0.445 | 0.002 |
| 2011 | 0.470 | 0.002 | 2017 | 0.435 | 0.002 |
| 2012 | 0.468 | 0.002 | 2018 | 0.415 | 0.003 |
| 2013 | 0.406 | 0.004 |
表5 面板数据相关效应检验结果Table 5 Test results of panel data effect |
| 检验方法 | 统计量 | P值 | 原假设 |
|---|---|---|---|
| Hausman | 43.42 | 0.000 | 随机效应优于固定效应 |
| LM-err | 0.050 | 0.822 | |
| Robust LM-err | 11.485 | 0.001 | |
| LM-lag | 11.483 | 0.001 | |
| Robust LM-lag | 22.918 | 0.000 | |
| LR | 60.39 | 0.000 | SDM简化为SAR |
| LR | 34.56 | 0.000 | SDM简化为SEM |
表6 基于固定效应的空间杜宾模型空间效应分解Table 6 Spatial effect decomposition of spatial Dubin model based on fixed effects |
| 变量 | 三大海洋经济圈 | 北部海洋经济圈 | 东部海洋经济圈 | 南部海洋经济圈 | ||||||||
|---|---|---|---|---|---|---|---|---|---|---|---|---|
| 系数 | z值 | 系数 | z值 | 系数 | z值 | 系数 | z值 | |||||
| 直接效应 | cap | 0.08*** | -7.9 | 0.11*** | 5.04 | 0.07*** | 6.59 | 0.09** | 2.50 | |||
| lab | 48.29*** | -8.9 | 40.48*** | 3.29 | 14.65* | 1.93 | 43.30*** | 3.73 | ||||
| innov | 2028.71*** | -3.6 | 2783.4** | 2.15 | -1038.17 | -1.32 | 2905.64*** | 2.64 | ||||
| env | -57.95 | -0.09 | 506.43 | 0.43 | 88.91 | 0.11 | 3101.87** | 2.36 | ||||
| mar | 390.34*** | -4.0 | 583.14*** | 3.68 | 19.42 | 0.13 | 459.72*** | 2.61 | ||||
| open | 0.18* | -1.8 | 1.3** | 2.44 | 0.22** | 2.27 | 0.08 | 0.52 | ||||
| 间接效应 | cap | 0.04** | -2.3 | -0.5*** | -3.05 | 0.06*** | 2.90 | 0.06 | 1.36 | |||
| lab | -48.53*** | -4.54 | -18.75*** | -2.66 | 10.24* | 1.95 | -77.80*** | -3.08 | ||||
| innov | 873.12** | -2.2 | -1315.64* | -1.85 | -854.07 | -1.12 | 1865.51 | 1.31 | ||||
| env | -31.92 | -0.10 | -2671.38* | -1.71 | 558.46 | 0.40 | 5020.93* | 1.81 | ||||
| mar | 168.58** | -2.2 | -274.19** | -2.55 | 3.66 | 0.03 | 281.28 | 1.46 | ||||
| open | 0.09 | -1.2 | -0.59** | -2.11 | -0.05 | -0.29 | 0.06 | 0.49 | ||||
| 总效应 | cap | 0.12*** | 5.80 | 0.06*** | 6.64 | 0.13*** | 4.39 | 0.15** | 2.05 | |||
| lab | -0.23 | -0.02 | 21.73*** | 3.21 | 24.90** | 1.99 | -34.51 | -1.16 | ||||
| innov | 2901.89*** | 3.67 | 1467.76** | 2.28 | -1892.24 | -1.23 | 4771.15** | 2.02 | ||||
| env | -89.89 | -0.10 | -2164.95** | -2.26 | 647.38 | 0.31 | 8122.79** | 2.11 | ||||
| mar | 558.89*** | 3.98 | 308.95*** | 4.55 | 23.08 | 0.09 | 741.01** | 2.23 | ||||
| open | 0.27* | 1.65 | 0.68** | 2.47 | 0.17 | 0.70 | 0.14 | 0.52 | ||||
| 0.33***(3.28) | -0.60***(-5.20) | 0.54***(6.30) | 0.43***(3.00) | |||||||||
| N/个 | 121 | 44 | 33 | 44 | ||||||||
| Sqrt-R | 0.9309 | 0.8850 | 0.9802 | 0.9680 | ||||||||
| Log-L | -915.798 | -333.3944 | -221.0237 | -318.9591 | ||||||||
注:***、**、*分别表示在1%、5%、10%的水平下显著,括号中为数字的标准误。 |
| [1] |
何广顺. 海洋经济运行总体平稳发展之路稳步提升. 中国自然资源报, 2020-05-11(5).
[
|
| [2] |
邹玮, 孙才志, 覃雄合. 基于Bootstrap-DEA模型环渤海地区海洋经济效率空间演化与影响因素分析. 地理科学, 2017, 37(6):859-867.
[
|
| [3] |
方正飞. 科学规划全面统筹拓展蓝色经济空间. 中国海洋报, 2017-06-14(1).
[
|
| [4] |
张美晨, 卜伟. 我国海洋产业发展的问题与治理思路. 北京交通大学学报: 社会科学版, 2016, 15(4):10-17.
[
|
| [5] |
孙久文, 高宇杰. 中国海洋经济发展研究. 区域经济评论, 2021, (1):38-47.
[
|
| [6] |
|
| [7] |
|
| [8] |
|
| [9] |
向晓梅, 张超. 粤港澳大湾区海洋经济高质量协同发展路径研究. 亚太经济, 2020, (2):142-148.
[
|
| [10] |
傅倩, 邱力生. 我国海洋经济发展示范区规划设计与发展路径. 社会科学家, 2020, (4):43-47.
[
|
| [11] |
胡金焱, 赵建. 新时代金融支持海洋经济的战略意义和基本路径. 经济与管理评论, 2018, 34(5):12-17.
[
|
| [12] |
杨黎静, 李宁, 王方方. 粤港澳大湾区海洋经济合作特征、趋势与政策建议. 经济纵横, 2021, (2):97-104.
[
|
| [13] |
张舒平. 山东海洋经济发展四十年: 成就、经验、问题与对策. 山东社会科学, 2020, (7):153-157.
[
|
| [14] |
刘大海, 刘方正, 李森. 中国海洋经济全面开放水平测定与提升对策. 区域经济评论, 2018, (5):33-40.
[
|
| [15] |
姚朋. 加拿大海洋经济和“一带一路”视野下中加海洋经济合作发展前瞻. 晋阳学刊, 2020, (2):95-103.
[
|
| [16] |
林香红. 面向2030: 全球海洋经济发展的影响因素、趋势及对策建议. 太平洋学报, 2020, 28(1):50-63.
[
|
| [17] |
赵玉杰. 基于生态文明建设的海洋经济发展研究. 生态经济, 2020, 36(1):211-217.
[
|
| [18] |
董雪兵, 池若楠. 中国区域经济差异与收敛的时空演进特征. 经济地理, 2020, 40(10):11-21.
[
|
| [19] |
潘桔, 郑红玲. 区域经济高质量发展水平的测度与差异分析. 统计与决策, 2020, 36(23):102-106.
[
|
| [20] |
斯丽娟, 王超群. 中国城市群区域经济差异、动态演变与收敛性: 基于十大城市群夜间灯光数据的研究. 上海经济研究, 2021, (10):38-52.
[
|
| [21] |
李山, 赵璐. 中国海洋经济空间格局演化及其影响因素. 地域研究与开发, 2020, 39(4):18-23.
[
|
| [22] |
狄乾斌, 於哲, 徐礼祥. 高质量增长背景下海洋经济发展的时空协调模式研究: 基于环渤海地区地级市的实证. 地理科学, 2019, 39(10):1621-1630.
[
|
| [23] |
孙才志, 郭可蒙. 基于DER-Wolfson指数的中国海洋经济极化研究. 地理科学, 2019, 39(6):920-928.
[
|
| [24] |
刘桂春, 史庆斌, 王泽宇, 等. 中国海洋经济增长驱动要素的时空差异. 经济地理, 2019, 39(2):132-138.
[
|
| [25] |
朱静敏, 盖美. 中国沿海地区海洋经济效率时空演化特征: 基于三阶段超效率SBM-Global和三阶段Malmquist的分析. 地域研究与开发, 2019, 38(1):26-31.
[
|
| [26] |
李帅帅, 范郢, 沈体雁. 我国海洋经济增长的动力机制研究: 基于省际面板数据的空间杜宾模型. 地域研究与开发, 2018, 37(6):1-5.
[
|
| [27] |
李博, 田闯, 史钊源, 等. 辽宁沿海地区海洋经济增长质量空间特征及影响要素. 地理科学进展, 2019, 38(7):1080-1092.
[
|
| [28] |
狄乾斌, 梁倩颖. 碳排放约束下的中国海洋经济效率时空差异及影响因素分析. 海洋通报, 2018, 37(3):272-279.
[
|
| [29] |
盖美, 朱静敏, 孙才志, 等. 中国沿海地区海洋经济效率时空演化及影响因素分析. 资源科学, 2018, 40(10):1966-1979.
[
|
| [30] |
王泽宇, 王焱熙. 中国海洋经济弹性的时空分异与影响因素分析. 经济地理, 2019, 39(2):139-145.
[
|
| [31] |
王谦, 董艳玲. 中国实体经济发展的地区差异及分布动态演进. 数量经济技术经济研究, 2018, 35(5):77-94.
[
|
| [32] |
刘华军, 赵浩. 中国高技术产业发展的空间非均衡与极化研究. 研究与发展管理, 2013, 25(5):44-53.
[
|
| [33] |
张丽娜, 徐洁, 庞庆华, 等. 水资源与产业结构高级化的适配度时空差异及动态演变. 自然资源学报, 2021, 36(8):2113-2124.
[
|
| [34] |
李旭辉, 张胜宝, 程刚, 等. 三大支撑带人工智能产业自主创新能力测度分析. 数量经济技术经济研究, 2020, 37(4):3-25.
[
|
| [35] |
陈明华, 刘玉鑫, 张晓萌, 等. 中国城市群民生发展水平测度及趋势演进: 基于城市DLI的经验考察. 中国软科学, 2019, (1):45-61.
[
|
| [36] |
王兆峰, 刘庆芳. 长江经济带旅游生态效率时空演变及其与旅游经济互动响应. 自然资源学报, 2019, 34(9):1945-1961.
[
|
| [37] |
韩峰, 谢锐. 生产性服务业集聚降低碳排放了吗: 对我国地级及以上城市面板数据的空间计量分析. 数量经济技术经济研究, 2017, 34(3):40-58.
[
|
| [38] |
吴义根, 冯开文, 曾珍, 等. 外商直接投资、区域生态效率的动态演进和空间溢出: 以安徽省为例. 华东经济管理, 2017, 31(6):16-24.
[
|
| [39] |
|
| [40] |
王守坤. 空间计量模型中权重矩阵的类型与选择. 经济数学, 2013, 30(3):57-63.
[
|
| [41] |
|
| [42] |
|
/
| 〈 |
|
〉 |