
1993—2018年中国沿海海平面异常升高的时空格局特征及潜在社会经济风险估计
|
孙艳伟(1983- ),男,内蒙古赤峰人,博士,讲师,主要从事资源环境经济与管理研究。E-mail: sunyanwei@nbu.edu.cn |
收稿日期: 2020-07-27
要求修回日期: 2021-02-17
网络出版日期: 2022-06-28
基金资助
国家自然科学基金项目(41976209)
版权
Assessment of spatio-temporal distribution characteristic of sea level anomaly changes and its potential socio-economic risks in China's coastal areas from 1993 to 2018
Received date: 2020-07-27
Request revised date: 2021-02-17
Online published: 2022-06-28
Copyright
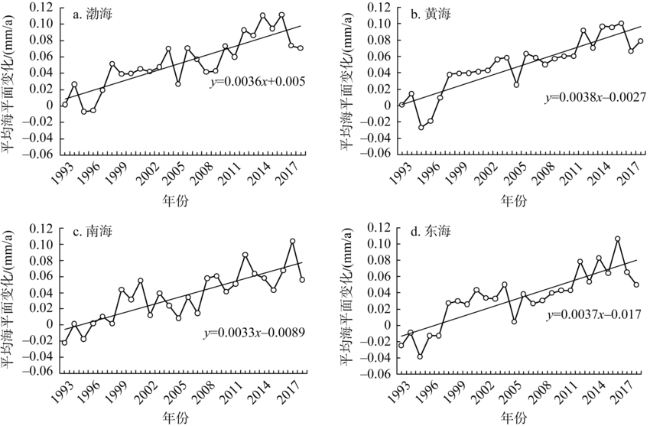
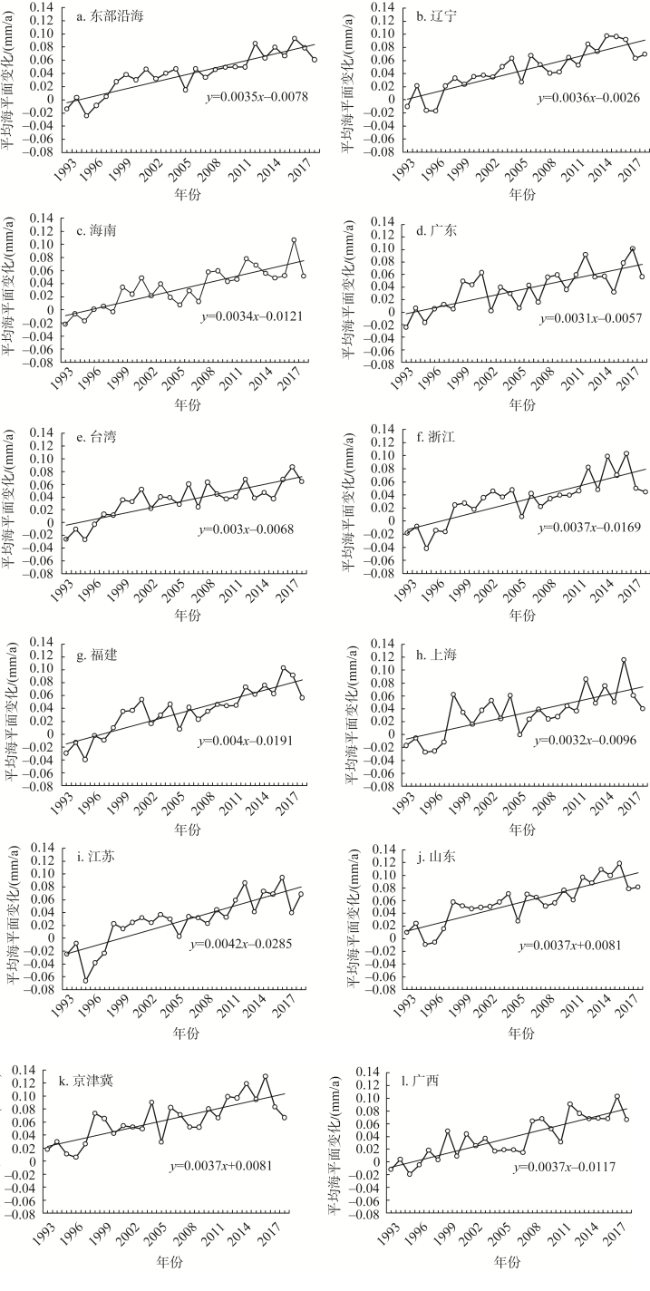
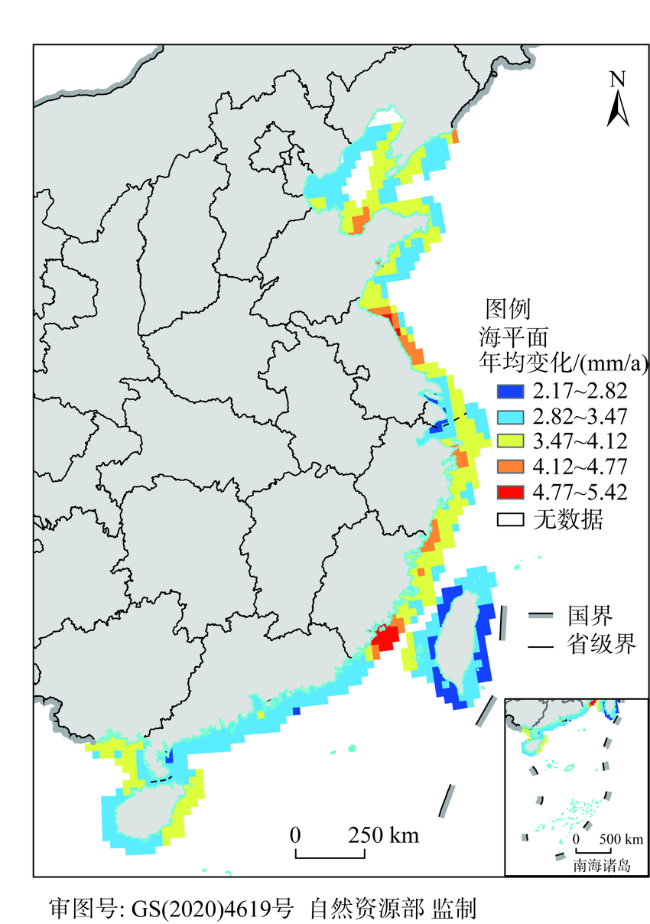
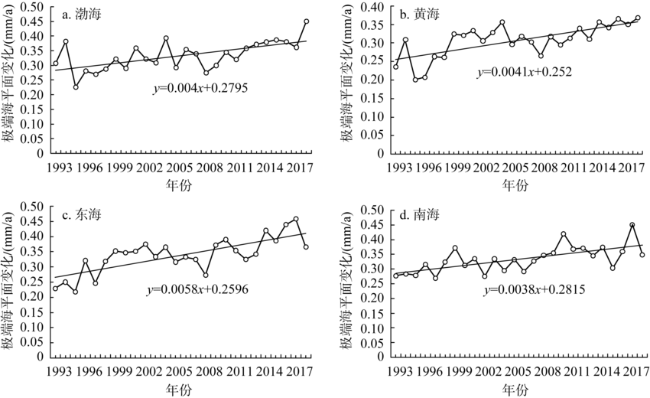
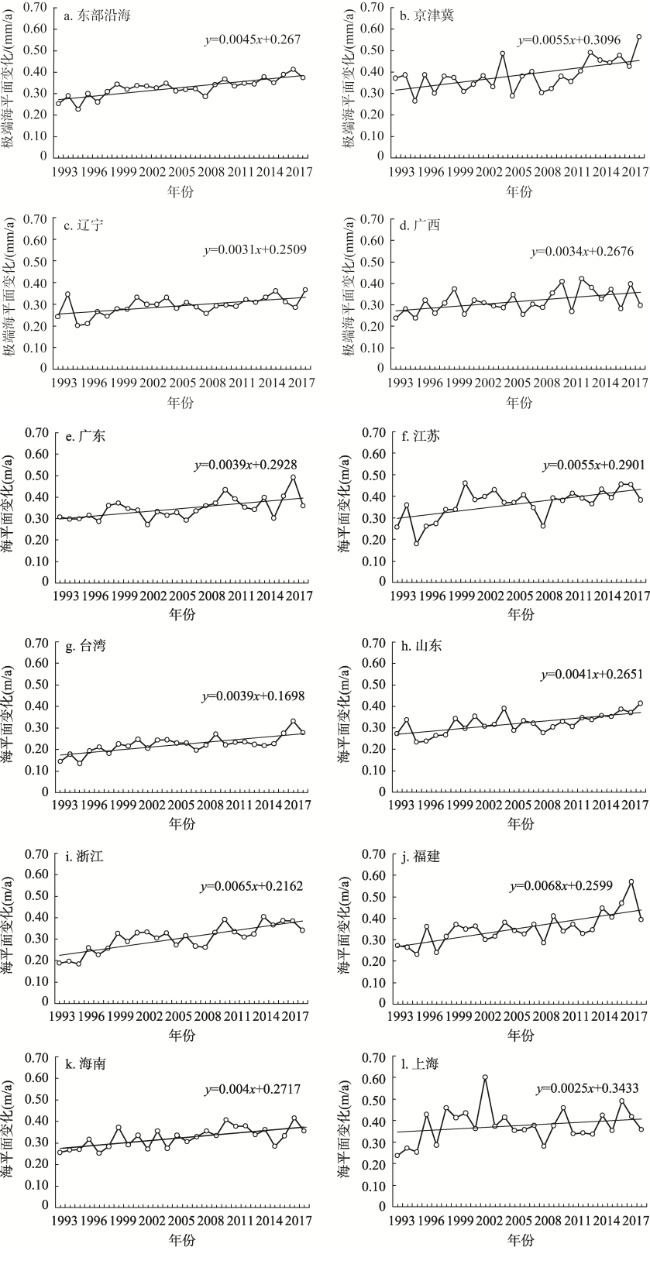
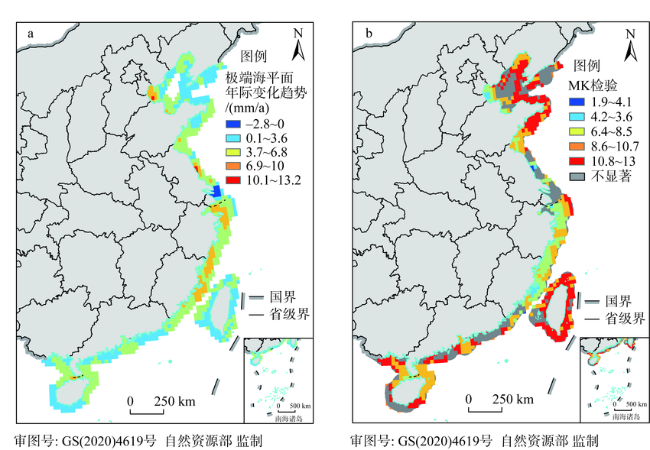
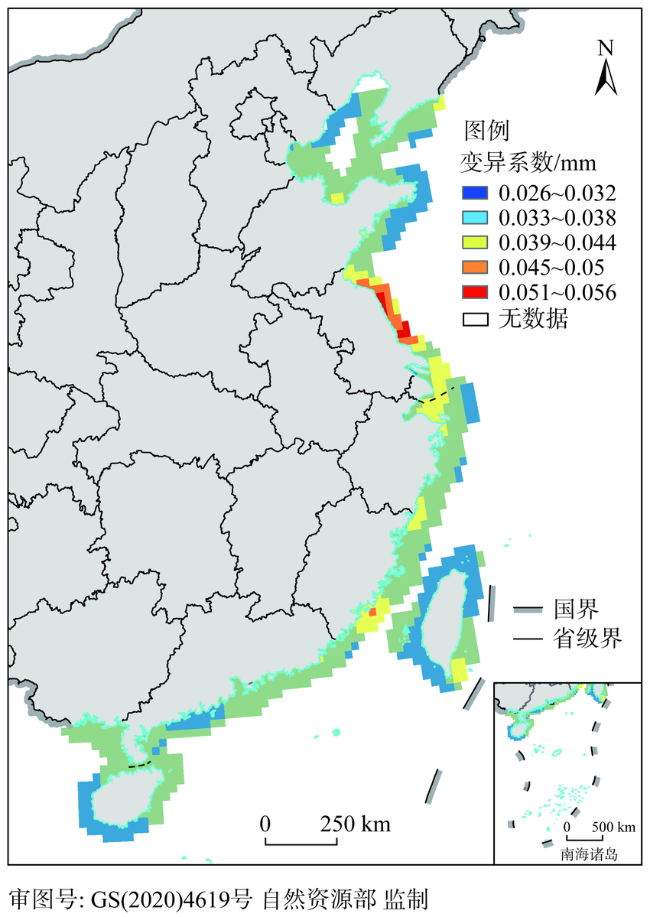
全球变暖诱发海平面上升是当前陆海作用领域的热点议题。应用卫星高度计观测海平面异常(SLA)数据,结合共享社会经济路径情景(SSPS),探讨我国沿海地区1993—2018年海平面异常升高的时空格局特征及潜在社会经济风险。结果显示:(1)过去26年间,我国沿海年均海平面和极端海平面均呈波动上升趋势,变化速率分别达到3.47±0.50 mm/a和4.74±1.39 mm/a。(2)空间上,我国四大海区上升速率由高到低排序为:东海>黄海>渤海>南海;省域尺度上,苏、闽、浙的海平面增速较大,而粤、沪、台的海平面上升速率较慢。(3)MK检验和Sen趋势分析显示,整个海区的年均海平面全部呈显著增加趋势,其中84.16%的区域处于增速中等偏慢水平,2.32%的区域增速快;而极端海平面中显著增加区域占76%,其中59.65%的区域增速慢,2.31%的区域增速快;无显著减少区域。(4)空间波动性上,我国历年海平面变化整体处于较低的波动水平;其中,较低波动区占61.31%,而高波动与较高波动区仅占到3.17%。(5)到2100年,我国海平面上升高度将达到71.71±19.01 cm;在三种共享社会经济发展路径下(SSP1、SSP2和SSP3),我国沿海地区潜在经济损失将达10万~21万亿元人民币(2005年可比价),受影响人口数达350万~550万人;其中,广东省水淹面积最大(占到省份陆域总面积的0.7%),经济和人口风险也最高。因此,减缓和应对海平面上升风险,是21世纪我国沿海地区保持经济社会、资源环境可持续发展的重要命题。
孙艳伟 , 李莹 . 1993—2018年中国沿海海平面异常升高的时空格局特征及潜在社会经济风险估计[J]. 自然资源学报, 2022 , 37(4) : 1073 -1088 . DOI: 10.31497/zrzyxb.20220417
Global warming induced sea level rise is a hot topic in the field of land-sea interaction. Coastal erosion and flooding caused by sea level rise pose a great threat to the environment and economic development. We examined the spatial-temporal distribution characteristics and potential social and economic risks of sea level change in China's coastal areas from 1993 to 2018 based on the sea-level anomaly (SLA) data and the shared social and economic path scenario (SSPS). The results showed that: (1) During the study period, the average annual sea level and extreme sea level in the study area showed a significant rising trend, with the rate of change reaching up to 3.47±0.50 mm/a and 4.74±1.39 mm/a, respectively. (2) The rising rate of the four major sea areas of China is listed is as follows: East China Sea > Yellow Sea > Bohai Sea > South China Sea. In terms of the provincial scale, Jiangsu, Fujian and Zhejiang have higher sea level growth rates, while Guangdong, Shanghai and Taiwan have lower sea level rise rates. (3) The results of MK test and Sen trend analysis showed that the average annual sea level had a significant increase trend in the whole study area. Specifically, 84.16% of the area had a moderately slow growth rate and 2.32% of the area was going fast. As for the extreme sea level, areas with a significant increase accounted for 76%, of which 59.65% had a slow growth and 2.31% had a fast growth. During the study period, there was no significant reduction in the area. (4) In terms of spatial volatility, the sea level change over the past decades had been at a relatively low volatility level. According to statistical results, the lower volatility area accounts for 61.31%, while the highest and higher volatility areas only account for 3.17%. (5) By 2100, under three shared social and economic development paths (SSP1, SSP2 and SSP3), the potential economic losses in Chinese coastal areas will reach 10-21 trillion yuan, and the population affected by sea level rise is about 3.5-5.5 million. From the provincial perspective, Guangdong has the largest flooded area (accounting for 0.7% of the total land area of the province), and the highest economic and population risks. Therefore, mitigation and adaption to the risk of sea level rise is an important task for maintaining sustainable socio-economic development, resources utilization and environmental protection in China's coastal areas in the 21st century.
表1 研究区海平面变化趋势Table 1 The trend of sea level change in China's sea areas |
| 变化趋势SSLA | Z值 | 趋势类型 | 面积/km2 | 面积百分比/% |
|---|---|---|---|---|
| SSLA<0 | |Z|>1.96 | 显著减少 | 0 | 0 |
| SSLA<0 | |Z|≤1.96 | 不显著减少 | 5000 | 0.88 |
| SSLA>0 | |Z|≤1.96 | 不显著增加 | 130625 | 23.04 |
| SSLA>0 | |Z|>1.96 | 显著增加 | 431250 | 76.08 |
表2 到2100年我国沿海地区海平面上升导致的经济和人口损失分析Table 2 Analysis of economic and population loss caused by sea level rise in coastal areas of China at the end of 2100 |
| 地区 | 水淹面积/km2 | SSP1 | SSP2 | SSP3 | |||||
|---|---|---|---|---|---|---|---|---|---|
| GDP/万亿元 | 人口/万人 | GDP/万亿元 | 人口/万人 | GDP/万亿元 | 人口/万人 | ||||
| 福建 | 718.44 | 2.38 | 49 | 2.47 | 61 | 1.38 | 73 | ||
| 广东 | 1288.25 | 6.29 | 106 | 6.24 | 132 | 3.59 | 167 | ||
| 广西 | 260.64 | 0.24 | 5 | 0.25 | 7 | 0.13 | 8 | ||
| 海南 | 425.25 | 0.20 | 5 | 0.20 | 5 | 0.12 | 6 | ||
| 江苏 | 918.93 | 2.47 | 42 | 2.36 | 54 | 1.18 | 67 | ||
| 京津冀 | 172.73 | 0.20 | 5 | 0.23 | 7 | 0.14 | 8 | ||
| 辽宁 | 327.21 | 0.50 | 11 | 0.53 | 14 | 0.32 | 17 | ||
| 山东 | 434.08 | 1.54 | 21 | 1.43 | 26 | 0.77 | 32 | ||
| 上海 | 140.84 | 2.12 | 19 | 1.79 | 23 | 0.89 | 33 | ||
| 台湾 | 432.42 | 1.74 | 35 | 1.88 | 44 | 1.21 | 56 | ||
| 浙江 | 832.55 | 2.77 | 53 | 2.84 | 67 | 1.61 | 81 | ||
| 总计 | 5951.34 | 20.45 | 351 | 20.22 | 440 | 11.34 | 548 | ||
| [1] |
|
| [2] |
|
| [3] |
|
| [4] |
孔兰, 陈晓宏, 杜建, 等. 基于数学模型的海平面上升对咸潮上溯的影响. 自然资源学报, 2010, 25(7):1097-1104.
[
|
| [5] |
|
| [6] |
|
| [7] |
|
| [8] |
国家海洋局. 2019年中国海平面公报. http://gi.mnr.gov.cn/202004/t20200430_2510978.html, 2019-12-01/ 2020-04-12.
[Ministry of Natural Resources. China Sea Level Bulletin 2019. http://gi.mnr.gov.cn/202004/t20200430_2510978.html, 2019-12-01/ 2020-04-12.]
|
| [9] |
蔡榕硕, 谭红建, 郭海峡. 中国沿海地区对全球变化的响应及风险研究. 应用海洋学学报, 2019, (4):514-527.
[
|
| [10] |
|
| [11] |
王龙. 基于19年卫星测高数据的中国海海平面变化及其影响因素研究. 青岛: 中国海洋大学, 2013.
[
|
| [12] |
丘福文, 方文东, 朱大勇, 等. 2005—2010年南海海平面异常升高的特征与机制. 热带海洋学报, 2015, 34(5):11-18.
[
|
| [13] |
王远东, 侯西勇, 施平, 等. 海平面上升背景下环渤海海岸敏感性研究. 地理科学, 2013, 33(12):1514-1523.
[
|
| [14] |
任美锷. 黄河长江珠江三角洲近30年海平面上升趋势及2030年上升量预测. 地理学报, 1993, 48(5):385-393.
[
|
| [15] |
何蕾, 李国胜, 李阔, 等. 1959年来珠江三角洲地区的海平面变化与趋势. 地理研究, 2014, 33(5):988-1000.
[
|
| [16] |
陈特固, 黄博津, 汤超莲, 等. 广东省海平面变化的过去和未来. 广东气象, 2013, 35(2):10-15.
[
|
| [17] |
程和琴, 王冬梅, 陈吉余. 2030年上海地区相对海平面变化趋势的研究和预测. 气候变化研究进展, 2015, 11(4):231-238.
[
|
| [18] |
殷杰, 尹占娥, 于大鹏, 等. 海平面上升背景下黄浦江极端风暴洪水危险性分析. 地理研究, 2013, 32(12):2215-2221.
[
|
| [19] |
龙飞鸿, 石学法, 罗新正. 海平面上升对山东沿渤海湾地区百年一遇风暴潮淹没范围的影响预测. 海洋环境科学, 2015, 34(2):211-216.
[
|
| [20] |
李莎莎. 海平面上升影响下广西海岸带红树林生态系统脆弱性评估. 上海: 华东师范大学, 2015.
[
|
| [21] |
康蕾, 马丽, 刘毅. 珠江三角洲地区未来海平面上升及风暴潮增水的耕地损失预测. 地理学报, 2015, 70(9):1375-1389.
[
|
| [22] |
高超, 汪丽, 陈财, 等. 海平面上升风险中国大陆沿海地区人口与经济暴露度. 地理学报, 2019, 74(8):1590-1604.
[
|
| [23] |
李响, 刘克修, 董军兴, 等. 中国沿海海平面上升风险区划方法研究. 海洋预报, 2014, 31(2):41-49.
[
|
| [24] |
温家洪, 袁穗萍, 李大力, 等. 海平面上升及其风险管理. 地球科学进展, 2018, 33(4):350-360.
[
|
| [25] |
|
| [26] |
姜彤, 赵晶, 景丞, 等. IPCC共享社会经济路径下中国和分省人口变化预估. 气候变化研究进展, 2017, 13(2):128-137.
[
|
| [27] |
田义超, 黄远林, 张强, 等. 北部湾南流江流域植被净初级生产力时空分布及其驱动因素. 生态学报, 2019, 39(21):8156-8171.
[
|
| [28] |
徐建华. 现代地理学中的数学方法(2版). 北京: 高等教育出版社, 2002: 27-35.
[
|
| [29] |
国家海洋局. 2018年中国海平面公报. http://gi.mnr.gov.cn/201905/t20190510_2411195.html, 2019-12-01/ 2020-12-01.
[Ministry of Natural Resources. China Sea Level Bulletin 2018. http://gi.mnr.gov.cn/201905/t20190510_2411195.html, 2019-12-01/ 2020-12-01.]
|
| [30] |
|
| [31] |
李加林, 王艳红, 张忍顺, 等. 海平面上升的灾害效应研究: 以江苏沿海低地为例. 地理科学, 2006, 26(1):87-93.
[
|
| [32] |
李加林, 田鹏, 邵姝遥, 等. 中国东海区大陆岸线变迁及其开发利用强度分析. 自然资源学报, 2019, 34(9):1886-1901.
[
|
| [33] |
纪学朋, 黄贤金, 陈逸, 等. 基于陆海统筹视角的国土空间开发建设适宜性评价: 以辽宁省为例. 自然资源学报, 2019, 34(3):451-463.
[
|
| [34] |
韩增林, 夏康, 郭建科, 等. 基于Global-Malmquist-Luenberger指数的沿海地带陆海统筹发展水平测度及区域差异分析. 自然资源学报, 2017, 32(8):1271-1285.
[
|
| [35] |
李杨帆, 向枝远, 杨奕, 等. 基于韧性理念的海岸带生态修复规划方法及应用. 自然资源学报, 2020, 35(1):130-140.
[
|
/
| 〈 |
|
〉 |