
东北地区产业结构优化与城市土地集约利用协调性
|
张明斗(1983- ),男,山东济宁人,博士,副教授,硕士生导师,研究方向为城市经济。E-mail: zhangmingdou0537@126.com |
收稿日期: 2021-01-31
修回日期: 2021-06-03
网络出版日期: 2022-05-28
基金资助
国家自然科学基金项目(71804021)
国家社会科学基金项目(18FJY023)
中国博士后科学基金项目(2019M651456)
辽宁省青年科技人才“育苗”项目(LN2019Q61)
版权
Study on the coordination between industrial structure optimization and urban land use intensity in Northeast China
Received date: 2021-01-31
Revised date: 2021-06-03
Online published: 2022-05-28
Copyright
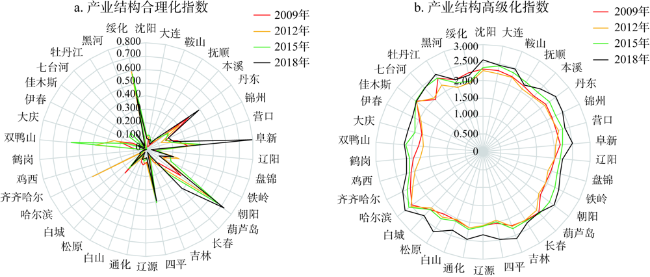
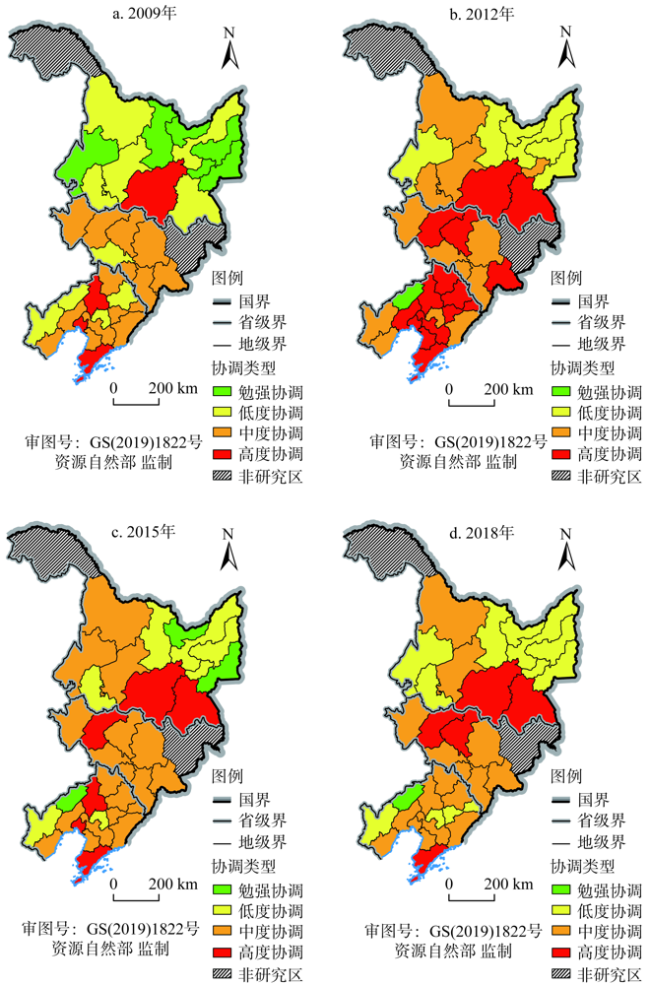
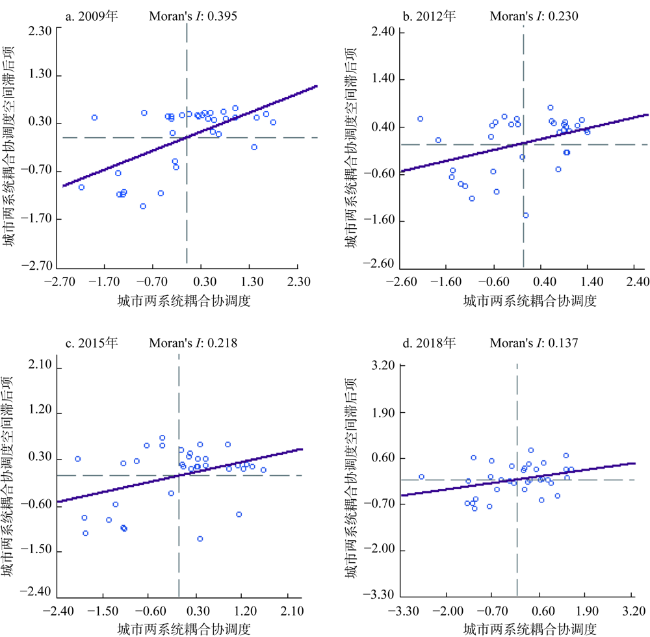
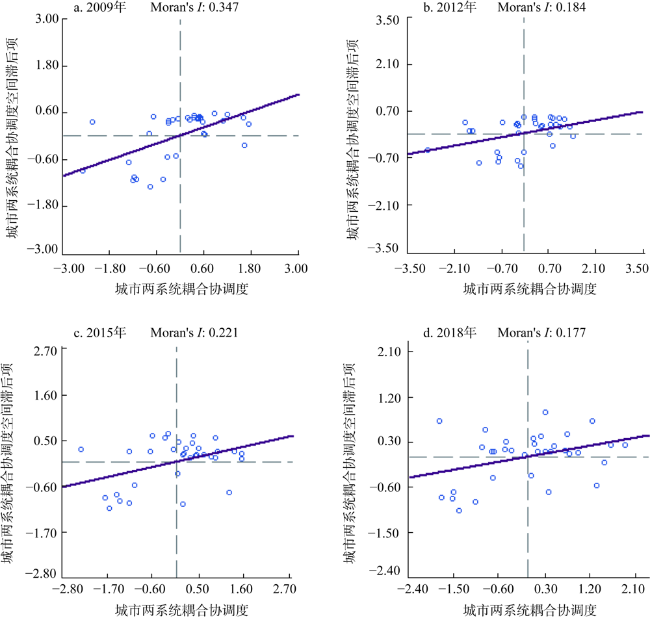
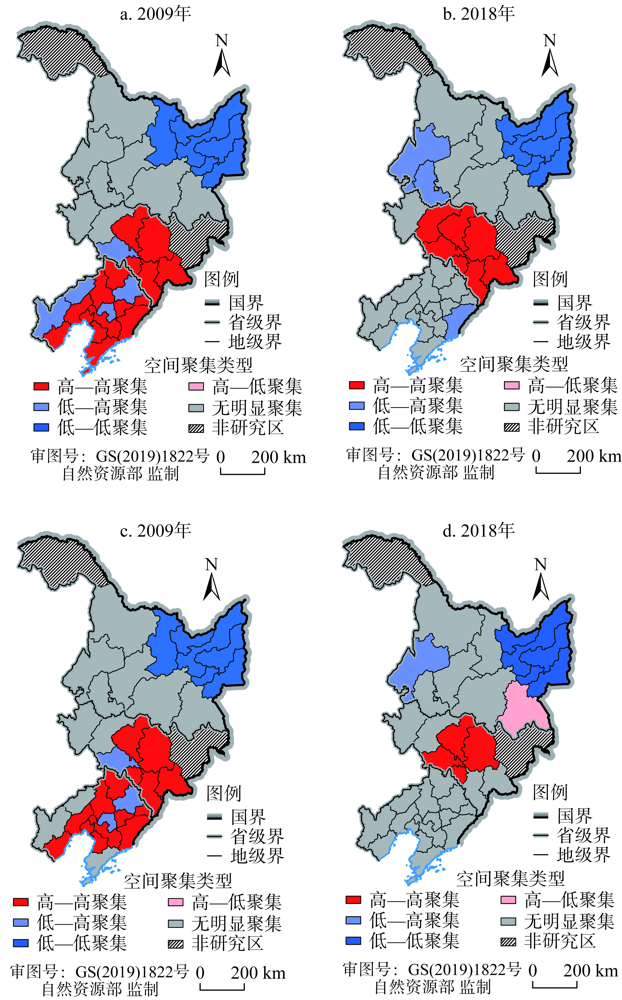
精准识别产业结构优化与城市土地集约利用的协调状况,对于推动东北地区产业结构转型升级、协调国土空间规划及产业布局具有重要现实意义。运用耦合协调度模型及探索性空间数据分析法,深入探究了2009—2018年东北地区产业结构优化与城市土地集约利用的耦合协调水平及其空间相关性。结果表明:(1)东北地区城市产业结构合理化水平逐年降低,且区域差异程度较大;产业结构高级化水平小幅上升,但不存在明显的空间分异特征。(2)城市土地集约利用水平呈现出先上升后下降的倒“U”型演变特征,并沿着哈大交通经济带的中心城市向两侧梯度递减。(3)产业结构合理化、产业结构高级化与城市土地集约利用协调度分别呈现先上升后下降及稳步上升的演变态势。两协调度均以大连、哈尔滨等城市为中心向外辐射,呈现“多中心多圈层”的空间分布特征。(4)城市两系统协调度存在显著的空间正相关,但显著性逐年减弱,其中高—高聚集类型主要集中在辽中南城市群,低—低聚集类型集中在黑龙江东部城市群。
张明斗 , 翁爱华 . 东北地区产业结构优化与城市土地集约利用协调性[J]. 自然资源学报, 2022 , 37(3) : 734 -752 . DOI: 10.31497/zrzyxb.20220312
Accurate identification of the coordination between industrial structure optimization and urban land use intensity has important theoretical value and practical significance for promoting the transformation and upgrading of industrial structure, coordinating land space planning and industrial layout, as well as achieving a new round of high-quality revitalization in Northeast China. This paper uses Theil index, Moore structure change index, entropy weight method plus the coupling coordination degree model and exploratory spatial data analysis method to explore the coupling coordination level and spatial correlation between industrial structure optimization and urban land use intensity in the study area from 2009 to 2018. The results show that: (1) The rationalization level of urban industrial structure is decreasing year by year, with a large regional gap, which is reflected in the high level of central cities and low level of surrounding cities. The upgrading level of industrial structure rose slightly, with no obvious spatial differentiation. (2) The level of urban land use intensity shows an inverted "U" shape, which first increases and then decreases, and finally decreases along the central cities of Harbin-Dalian Transportation Economic Belt. (3) The coordination degree of industrial structure rationalization and urban land use intensity first increased and then decreased. The coordination degree of industrial structure upgrading and urban land use intensity gradually increases with time. The two coordination dispatching centers of Dalian and Harbin present a spatial distribution of "multi-center and multi-circle pattern". (4) There is a positive spatial correlation between the industrial structure optimization and the coupling coordination degree of urban land use intensity, but the significance is weakening year by year. The H-H aggregation areas concentrated in the Central-south Liaoning urban agglomeration, while L-L aggregation areas concentrated in the Eastern Heilongjiang urban agglomeration. In order to improve the coordination of industrial structure optimization and urban land use intensity, based on the empirical results and the actual development, two policy suggestions are put forward in this paper. One is giving full play to the advantages of central cities such as Shenyang, Dalian, Changchun and Harbin, so as to drive the surrounding cities to realize the coordinated development of industrial structure optimization and urban land use intensity; the other is coordinating the allocation of industries according to local conditions and forming the connotation intensive industrial development trend on the basis of urban land intensive use.
表1 城市土地集约利用评价指标体系Table 1 Evaluation index system of urban land use intensity |
| 目标 | 准则层 | 指标层 | 指标描述 | 权重 |
|---|---|---|---|---|
| 城市土地集约利用水平 | 土地投入程度 | 地均固定资产投资额/(万元/km2),+ | 固定资产投资/建设用地总面积 | 0.071 |
| 地均房地产投资完成额/(万元/km2),+ | 房地产投资支出/建设用地总面积 | 0.109 | ||
| 地均第二、三产业从业人数/(人/km2),+ | 第二、三产业从业人数/建设用地总面积 | 0.089 | ||
| 土地利用强度 | 城市人均建设用地/(m2/人),+ | 建设用地总面积/户籍人口 | 0.101 | |
| 人口密度/(人/km2),+ | 户籍人口/建设用地总面积 | 0.038 | ||
| 城市人均居住用地/(m2/人),+ | 城市居住用地面积/户籍人口 | 0.100 | ||
| 土地利用结构 | 公共设施用地比例/%,+ | 公共设施用地面积/建设用地总面积 | 0.066 | |
| 工业用地比例/%,+ | 工业用地面积/建设用地总面积 | 0.020 | ||
| 绿地用地比例/%,+ | 绿地用地面积/建设用地总面积 | 0.048 | ||
| 土地经济效益 | 地均GDP/(万元/km2),+ | GDP/建设用地总面积 | 0.052 | |
| 地均财政收入/(万元/km2),+ | 政府财政收入/建设用地总面积 | 0.048 | ||
| 地均消费品零售总额/(万元/km2),+ | 社会消费品零售总额/建设用地总面积 | 0.060 | ||
| 土地社会效益 | 地均邮电业务总量/(万元/km2),+ | 邮电业务总量/建设用地总面积 | 0.032 | |
| 城市地均供水总量/(万t/km2),+ | 城市供水总量/建设用地总面积 | 0.073 | ||
| 人均城市道路面积/(m2/人),+ | 道路面积/户籍人口 | 0.065 | ||
| 土地生态效益 | 城市建成区绿化覆盖率/%,+ | 绿化面积/建成区面积 | 0.007 | |
| 地均工业SO2排放量/(t/km2),- | 工业SO2排放量/建设用地总面积 | 0.014 | ||
| 地均工业烟尘排放量/(t/km2),- | 工业粉尘排放量/建设用地总面积 | 0.007 |
表2 东北地区城市土地集约利用水平Table 2 The level of urban land use intensity in Northeast China |
| 城市 | 2009年 | 2012年 | 2015年 | 2018年 | 城市 | 2009年 | 2012年 | 2015年 | 2018年 |
|---|---|---|---|---|---|---|---|---|---|
| 沈阳 | 0.326 | 0.398 | 0.355 | 0.251 | 辽源 | 0.189 | 0.198 | 0.202 | 0.213 |
| 大连 | 0.304 | 0.366 | 0.318 | 0.304 | 通化 | 0.186 | 0.213 | 0.230 | 0.206 |
| 鞍山 | 0.237 | 0.314 | 0.230 | 0.216 | 白山 | 0.198 | 0.275 | 0.220 | 0.227 |
| 抚顾 | 0.160 | 0.299 | 0.219 | 0.235 | 松原 | 0.214 | 0.310 | 0.299 | 0.298 |
| 本溪 | 0.206 | 0.289 | 0.212 | 0.174 | 白城 | 0.203 | 0.181 | 0.222 | 0.241 |
| 丹东 | 0.267 | 0.301 | 0.180 | 0.185 | 哈尔滨 | 0.272 | 0.301 | 0.281 | 0.317 |
| 锦州 | 0.194 | 0.354 | 0.201 | 0.209 | 齐齐哈尔 | 0.111 | 0.132 | 0.212 | 0.146 |
| 营口 | 0.198 | 0.318 | 0.219 | 0.181 | 鸡西 | 0.129 | 0.152 | 0.131 | 0.141 |
| 阜新 | 0.156 | 0.124 | 0.121 | 0.174 | 鹤岗 | 0.125 | 0.169 | 0.132 | 0.148 |
| 辽阳 | 0.141 | 0.185 | 0.163 | 0.163 | 双鸭山 | 0.104 | 0.153 | 0.141 | 0.147 |
| 盘锦 | 0.287 | 0.357 | 0.306 | 0.266 | 大庆 | 0.160 | 0.221 | 0.168 | 0.164 |
| 铁岭 | 0.222 | 0.414 | 0.273 | 0.240 | 伊春 | 0.124 | 0.152 | 0.149 | 0.170 |
| 朝阳 | 0.155 | 0.218 | 0.150 | 0.198 | 佳木斯 | 0.155 | 0.158 | 0.142 | 0.149 |
| 葫芦岛 | 0.177 | 0.214 | 0.200 | 0.185 | 七台河 | 0.128 | 0.191 | 0.152 | 0.163 |
| 长春 | 0.219 | 0.306 | 0.263 | 0.299 | 牡丹江 | 0.168 | 0.283 | 0.281 | 0.280 |
| 吉林 | 0.193 | 0.270 | 0.183 | 0.217 | 黑河 | 0.141 | 0.227 | 0.223 | 0.237 |
| 四平 | 0.166 | 0.205 | 0.212 | 0.205 | 绥化 | 0.156 | 0.256 | 0.230 | 0.207 |
表3 东北地区产业结构优化与城市土地集约利用协调度Table 3 The coordination degree between industrial structure optimization and urban land use intensity in Northeast China |
| 城市 | 产业结构合理化与城市土地集约利用水平协调度 | 产业结构高级化与城市土地集约利用水平协调度 | |||||||
|---|---|---|---|---|---|---|---|---|---|
| 2009年 | 2012年 | 2015年 | 2018年 | 2009年 | 2012年 | 2015年 | 2018年 | ||
| 沈阳 | 0.889(Ⅳ) | 0.954(Ⅳ) | 0.915(Ⅳ) | 0.755(Ⅲ) | 0.806(Ⅳ) | 0.820(Ⅳ) | 0.842(Ⅳ) | 0.753(Ⅲ) | |
| 大连 | 0.856(Ⅳ) | 0.929(Ⅳ) | 0.872(Ⅳ) | 0.858(Ⅳ) | 0.784(Ⅲ) | 0.791(Ⅲ) | 0.840(Ⅳ) | 0.830(Ⅳ) | |
| 鞍山 | 0.718(Ⅲ) | 0.877(Ⅳ) | 0.699(Ⅲ) | 0.656(Ⅲ) | 0.692(Ⅲ) | 0.766(Ⅲ) | 0.692(Ⅲ) | 0.66(Ⅲ) | |
| 抚顺 | 0.418(Ⅱ) | 0.852(Ⅳ) | 0.664(Ⅲ) | 0.713(Ⅲ) | 0.472(Ⅱ) | 0.670(Ⅲ) | 0.660(Ⅲ) | 0.678(Ⅲ) | |
| 本溪 | 0.622(Ⅲ) | 0.832(Ⅳ) | 0.644(Ⅲ) | 0.495(Ⅱ) | 0.604(Ⅲ) | 0.669(Ⅲ) | 0.642(Ⅲ) | 0.515(Ⅲ) | |
| 丹东 | 0.720(Ⅲ) | 0.795(Ⅲ) | 0.533(Ⅲ) | 0.554(Ⅲ) | 0.711(Ⅲ) | 0.718(Ⅲ) | 0.543(Ⅲ) | 0.548(Ⅲ) | |
| 锦州 | 0.584(Ⅲ) | 0.911(Ⅳ) | 0.611(Ⅲ) | 0.640(Ⅲ) | 0.584(Ⅲ) | 0.715(Ⅲ) | 0.615(Ⅲ) | 0.640(Ⅲ) | |
| 营口 | 0.607(Ⅲ) | 0.850(Ⅳ) | 0.669(Ⅲ) | 0.540(Ⅲ) | 0.594(Ⅲ) | 0.748(Ⅲ) | 0.663(Ⅲ) | 0.545(Ⅲ) | |
| 阜新 | 0.436(Ⅱ) | 0.236(Ⅰ) | 0.216(Ⅰ) | 0.055(Ⅰ) | 0.451(Ⅱ) | 0.265(Ⅰ) | 0.212(Ⅰ) | 0.506(Ⅲ) | |
| 辽阳 | 0.312(Ⅱ) | 0.542(Ⅲ) | 0.440(Ⅱ) | 0.435(Ⅱ) | 0.386(Ⅱ) | 0.541(Ⅲ) | 0.484(Ⅱ) | 0.481(Ⅱ) | |
| 盘锦 | 0.814(Ⅳ) | 0.860(Ⅳ) | 0.841(Ⅳ) | 0.773(Ⅲ) | 0.583(Ⅲ) | 0.459(Ⅱ) | 0.723(Ⅲ) | 0.731(Ⅲ) | |
| 铁岭 | 0.678(Ⅲ) | 0.948(Ⅳ) | 0.787(Ⅲ) | 0.726(Ⅲ) | 0.548(Ⅲ) | 0.540(Ⅲ) | 0.741(Ⅲ) | 0.716(Ⅲ) | |
| 朝阳 | 0.432(Ⅱ) | 0.556(Ⅲ) | 0.388(Ⅱ) | 0.313(Ⅱ) | 0.452(Ⅱ) | 0.545(Ⅲ) | 0.401(Ⅱ) | 0.602(Ⅲ) | |
| 葫芦岛 | 0.515(Ⅲ) | 0.653(Ⅲ) | 0.612(Ⅲ) | 0.566(Ⅲ) | 0.536(Ⅲ) | 0.641(Ⅲ) | 0.613(Ⅲ) | 0.565(Ⅲ) | |
| 长春 | 0.667(Ⅲ) | 0.854(Ⅳ) | 0.781(Ⅲ) | 0.853(Ⅳ) | 0.657(Ⅲ) | 0.766(Ⅲ) | 0.738(Ⅲ) | 0.794(Ⅲ) | |
| 吉林 | 0.573(Ⅲ) | 0.799(Ⅲ) | 0.533(Ⅲ) | 0.656(Ⅲ) | 0.590(Ⅲ) | 0.732(Ⅲ) | 0.556(Ⅲ) | 0.661(Ⅲ) | |
| 四平 | 0.484(Ⅱ) | 0.624(Ⅲ) | 0.635(Ⅲ) | 0.620(Ⅲ) | 0.494(Ⅱ) | 0.538(Ⅲ) | 0.574(Ⅲ) | 0.625(Ⅲ) | |
| 辽源 | 0.558(Ⅲ) | 0.597(Ⅲ) | 0.605(Ⅲ) | 0.646(Ⅲ) | 0.563(Ⅲ) | 0.577(Ⅲ) | 0.594(Ⅲ) | 0.649(Ⅲ) | |
| 通化 | 0.549(Ⅲ) | 0.648(Ⅲ) | 0.699(Ⅲ) | 0.623(Ⅲ) | 0.565(Ⅲ) | 0.631(Ⅲ) | 0.673(Ⅲ) | 0.631(Ⅲ) | |
| 白山 | 0.596(Ⅲ) | 0.808(Ⅳ) | 0.669(Ⅲ) | 0.690(Ⅲ) | 0.581(Ⅲ) | 0.634(Ⅲ) | 0.625(Ⅲ) | 0.686(Ⅲ) | |
| 松原 | 0.648(Ⅲ) | 0.865(Ⅳ) | 0.853(Ⅳ) | 0.853(Ⅳ) | 0.606(Ⅲ) | 0.714(Ⅲ) | 0.747(Ⅲ) | 0.849(Ⅳ) | |
| 白城 | 0.620(Ⅲ) | 0.540(Ⅲ) | 0.677(Ⅲ) | 0.727(Ⅲ) | 0.614(Ⅲ) | 0.549(Ⅲ) | 0.653(Ⅲ) | 0.723(Ⅲ) | |
| 哈尔滨 | 0.802(Ⅳ) | 0.860(Ⅳ) | 0.818(Ⅳ) | 0.880(Ⅳ) | 0.789(Ⅲ) | 0.837(Ⅳ) | 0.813(Ⅳ) | 0.888(Ⅳ) | |
| 齐齐哈尔 | 0.091(Ⅰ) | 0.309(Ⅱ) | 0.640(Ⅲ) | 0.342(Ⅱ) | 0.115(Ⅰ) | 0.300(Ⅰ) | 0.649(Ⅲ) | 0.358(Ⅱ) | |
| 鸡西 | 0.225(Ⅰ) | 0.369(Ⅱ) | 0.241(Ⅰ) | 0.308(Ⅱ) | 0.299(Ⅰ) | 0.438(Ⅱ) | 0.308(Ⅱ) | 0.364(Ⅱ) | |
| 鹤岗 | 0.202(Ⅰ) | 0.458(Ⅱ) | 0.246(Ⅰ) | 0.348(Ⅱ) | 0.293(Ⅰ) | 0.337(Ⅱ) | 0.324(Ⅱ) | 0.414(Ⅱ) | |
| 双鸭山 | 0.030(Ⅰ) | 0.429(Ⅱ) | 0.387(Ⅱ) | 0.338(Ⅱ) | 0.068(Ⅰ) | 0.064(Ⅰ) | 0.367(Ⅱ) | 0.396(Ⅱ) | |
| 大庆 | 0.441(Ⅱ) | 0.674(Ⅲ) | 0.477(Ⅱ) | 0.443(Ⅱ) | 0.366(Ⅱ) | 0.283(Ⅰ) | 0.493(Ⅱ) | 0.489(Ⅱ) | |
| 伊春 | 0.198(Ⅰ) | 0.375(Ⅱ) | 0.357(Ⅱ) | 0.473(Ⅱ) | 0.273(Ⅰ) | 0.434(Ⅱ) | 0.423(Ⅱ) | 0.510(Ⅲ) | |
| 佳木斯 | 0.387(Ⅱ) | 0.406(Ⅱ) | 0.333(Ⅱ) | 0.356(Ⅱ) | 0.429(Ⅱ) | 0.445(Ⅱ) | 0.355(Ⅱ) | 0.399(Ⅱ) | |
| 七台河 | 0.217(Ⅰ) | 0.562(Ⅲ) | 0.393(Ⅱ) | 0.430(Ⅱ) | 0.306(Ⅱ) | 0.560(Ⅲ) | 0.403(Ⅱ) | 0.461(Ⅱ) | |
| 牡丹江 | 0.457(Ⅱ) | 0.825(Ⅳ) | 0.822(Ⅳ) | 0.808(Ⅳ) | 0.485(Ⅱ) | 0.728(Ⅲ) | 0.791(Ⅲ) | 0.808(Ⅳ) | |
| 黑河 | 0.306(Ⅱ) | 0.687(Ⅲ) | 0.675(Ⅲ) | 0.718(Ⅲ) | 0.371(Ⅱ) | 0.541(Ⅲ) | 0.612(Ⅲ) | 0.671(Ⅲ) | |
| 绥化 | 0.452(Ⅱ) | 0.548(Ⅲ) | 0.569(Ⅲ) | 0.626(Ⅲ) | 0.446(Ⅱ) | 0.577(Ⅲ) | 0.591(Ⅲ) | 0.621(Ⅲ) | |
注:Ⅰ、Ⅱ、Ⅲ、Ⅳ分别代表勉强、低度、中度、高度协调类型。 |
表4 产业结构优化与城市土地集约利用协调度的Moran's I统计量Table 4 Moran's I statistic of the coordination degree between industrial structure optimization and urban land use intensity |
| 指数 | 产业结构合理化与城市土地集约利用协调度 | 产业结构高级化与城市土地集约利用协调度 | |||||||
|---|---|---|---|---|---|---|---|---|---|
| 2009年 | 2012年 | 2015年 | 2018年 | 2009年 | 2012年 | 2015年 | 2018年 | ||
| Moran's I | 0.395 | 0.230 | 0.218 | 0.137 | 0.347 | 0.184 | 0.221 | 0.177 | |
| Z检验 | 5.767 | 3.518 | 3.412 | 2.331 | 5.392 | 2.937 | 3.397 | 2.851 | |
| p-value | 0.001 | 0.002 | 0.005 | 0.072 | 0.001 | 0.006 | 0.004 | 0.001 | |
图5 产业结构合理化与城市土地集约利用协调度Moran's I散点图Fig. 5 Moran's I scatter diagram of the coordination degree between industrial structure rationalizationand urban land use intensity |
| [1] |
朱高立, 王春杰, 周佳宁, 等. 产业发展、土地集约利用与城市土地扩张. 长江流域资源与环境, 2020,29(7):1473-1485.
[
|
| [2] |
汤吉军, 戚振宇. 新时代深化改革推动东北地区经济高质量发展: 加快东北老工业基地全面振兴高端论坛综述. 中国工业经济, 2019,33(3):5-6.
[
|
| [3] |
|
| [4] |
韩峰, 王琢卓, 杨海余. 产业结构对城镇土地集约利用的影响研究. 资源科学, 2013,35(2):388-395.
[
|
| [5] |
张乐勤, 陈素平, 陈保平, 等. 1996—2011年安徽省产业结构演进对城镇土地集约利用影响测度与分析. 地理科学, 2014,34(9):1117-1124.
[
|
| [6] |
|
| [7] |
|
| [8] |
张英浩, 陈江龙, 高金龙, 等. 经济转型视角下长三角城市土地利用效率影响机制. 自然资源学报, 2019,34(6):1157-1170.
[
|
| [9] |
李雪梅, 张庆. 天津市土地集约利用与产业结构高级化关系探讨. 资源开发与市场, 2017,33(9):1058-1062, 1083.
[
|
| [10] |
于斌斌, 苏宜梅. 产业结构调整对土地利用效率的影响及溢出效应研究: 基于PSDM模型和PTR模型的实证分析. 中国土地科学, 2020,34(11):57-66.
[
|
| [11] |
徐磊, 陈恩, 董捷. 长中城市群产业结构优化与土地集约利用协调性测度. 城市问题, 2017,36(11):17-24.
[
|
| [12] |
尹旭, 李裕瑞, 袁涛, 等. 镇域经济发展与土地集约利用水平综合测度及其关联特征分析: 以江苏省109个抽样乡镇为例. 自然资源学报, 2020,35(3):614-625.
[
|
| [13] |
孙晓华, 刘小玲, 翟钰. 地区产业结构优度的测算及应用. 统计研究, 2017,34(12):48-62.
[
|
| [14] |
干春晖, 郑若谷, 余典范. 中国产业结构变迁对经济增长和波动的影响. 经济研究, 2011,46(5):4-16, 31.
[
|
| [15] |
|
| [16] |
郑少智, 陈志辉. 产业结构高级化与经济增长关系实证研究: 基于全国、广东省及广州市数据的对比分析. 产经评论, 2011,9(3):55-60.
[
|
| [17] |
陶志红. 城市土地集约利用几个基本问题的探讨. 中国土地科学, 2000,14(5):1-5.
[
|
| [18] |
杨俊, 黄贤金, 王占岐, 等. 新时代中国城市土地集约利用若干问题的再认识. 中国土地科学, 2020,34(11):31-37.
[
|
| [19] |
王秀, 姚玲玲, 李阳, 等. 新型城镇化与土地集约利用耦合协调性及其时空分异: 以黑龙江省12个地级市为例. 经济地理, 2017,37(5):173-180.
[
|
| [20] |
赵小风, 黄贤金, 陈逸, 等. 城市土地集约利用研究进展. 自然资源学报, 2010,25(11):1979-1996.
[
|
| [21] |
刘浩, 张毅, 郑文升. 城市土地集约利用与区域城市化的时空耦合协调发展评价: 以环渤海地区城市为例. 地理研究, 2011,30(10):1805-1817.
[
|
| [22] |
赵丹丹, 胡业翠. 土地集约利用与城市化相互作用的定量研究: 以中国三大城市群为例. 地理研究, 2016,35(11):2105-2115.
[
|
| [23] |
徐维祥, 徐志雄, 刘程军. 黄河流域地级城市土地集约利用效率与生态福利绩效的耦合性分析. 自然资源学报, 2021,36(1):114-130.
[
|
| [24] |
何为, 修春亮. 吉林省城市土地集约利用的空间分异. 自然资源学报, 2011,26(8):1287-1296.
[
|
| [25] |
杨丽, 孙之淳. 基于熵值法的西部新型城镇化发展水平测评. 经济问题, 2015,37(3):115-119.
[
|
| [26] |
张浩, 冯淑怡, 曲福田. 耕地保护、建设用地集约利用与城镇化耦合协调性研究. 自然资源学报, 2017,32(6):1002-1015.
[
|
| [27] |
张明斗, 莫冬燕. 城市土地利用效益与城市化的耦合协调性分析: 以东北三省34个地级市为例. 资源科学, 2014,36(1):8-16.
[
|
| [28] |
陈彦光. 基于Moran统计量的空间自相关理论发展和方法改进. 地理研究, 2009,28(6):1449-1463.
[
|
| [29] |
金贵, 邓祥征, 赵晓东, 等. 2005—2014年长江经济带城市土地利用效率时空格局特征. 地理学报, 2018,73(7):1242-1252.
[
|
| [30] |
张明斗, 毕佳港. 长三角城市群城市土地经济密度的空间差异与格局演变. 管理学刊, 2020,33(4):17-26.
[
|
| [31] |
万娟娟, 陈璇. 土地发展权视域下中国城市土地集约利用效率空间格局及溢出效应. 经济地理, 2018,38(6):160-167.
[
|
/
| 〈 |
|
〉 |

