
中国旅游业绿色发展效率时空演变特征及影响机理
|
雨婧(1990- ),女,湖南邵阳人,博士研究生,讲师,研究方向为旅游经济及区域发展。E-mail: 15580503845@163.com |
收稿日期: 2021-01-11
修回日期: 2021-04-25
网络出版日期: 2022-05-28
基金资助
国家社会科学基金项目(21BGL149)
湖南省双一流学科建设项目(地理学-5010002)
湖南省研究生科研创新项目(CX20200505)
版权
Spatio-temporal evolution characteristics and influencing mechanism of green development efficiency of tourism industry in China
Received date: 2021-01-11
Revised date: 2021-04-25
Online published: 2022-05-28
Copyright
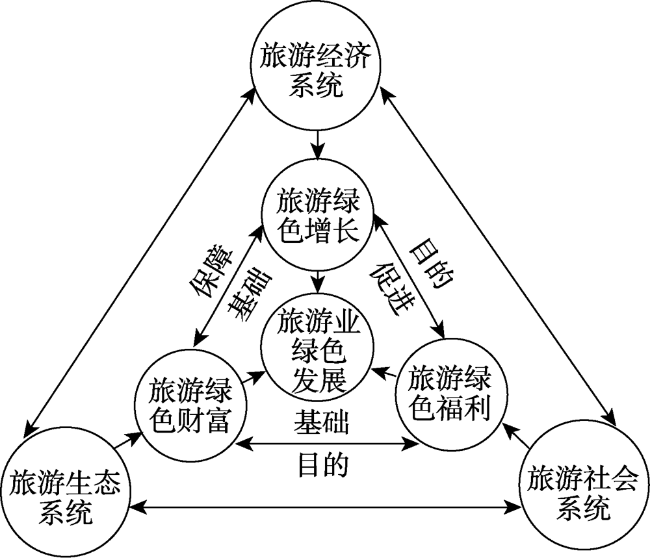
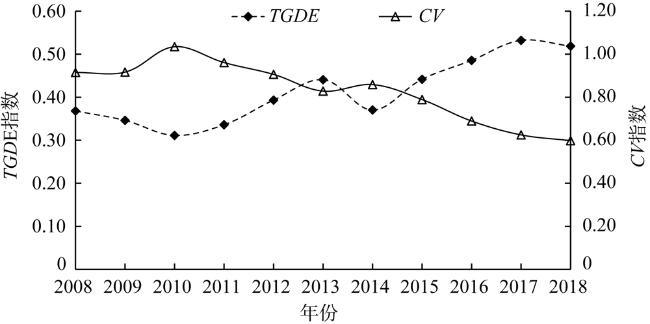
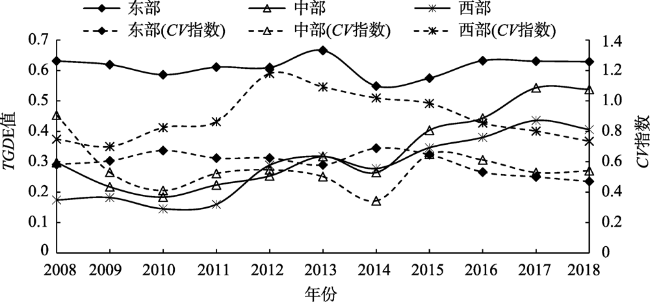
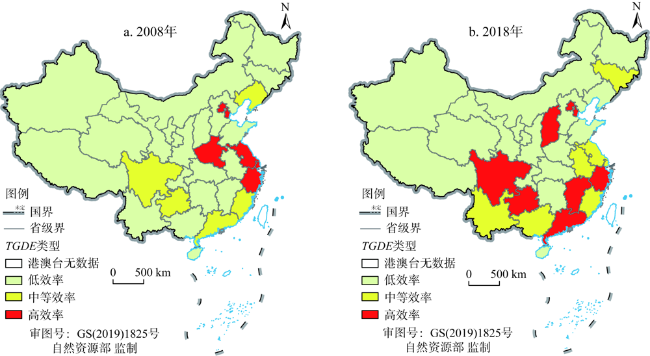
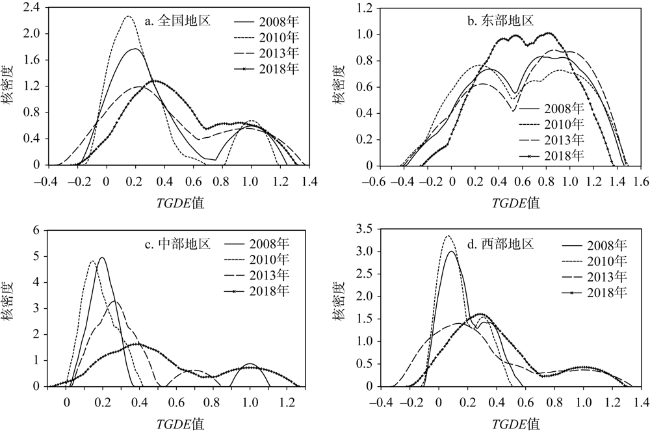
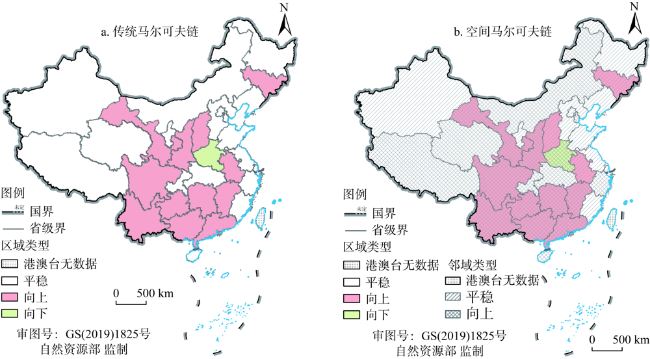
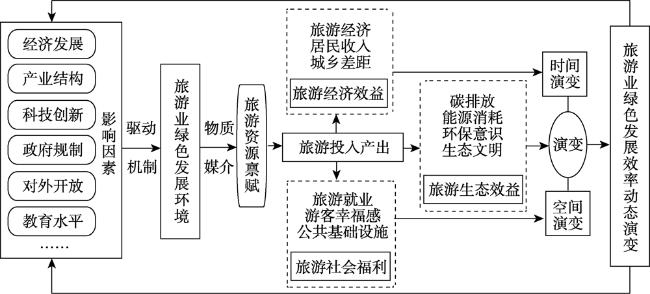
绿色发展是旅游业可持续发展理念的重要组成部分,是旅游业奉行以人为本、生态至上和全面发展的新价值观。在梳理旅游业绿色发展概念及内涵基础上,构建旅游业绿色发展效率评价体系,运用SBM-Undersirable模型、核密度估计、空间马尔科夫链等方法,探讨2008—2018年中国31个省(市、自治区)旅游业绿色发展效率(TGDE)时空演化特征及影响机理。研究发现:(1)时间和空间变化方面,TGDE总体处于中等偏下水平,时间上呈“W”型变化形态,“下降—上升—调整”阶段特征显著;空间呈“东—中—西”递减分布,内部差异为西部地区>东部地区>中部地区,低、中、高效率由“金字塔”向“菱形”结构转变,高效率地区集中于东部沿海,中等效率多分布于中西部地区,低效率位于胡焕庸线两侧。(2)动态演进方面,TGDE始终存在两极分化现象,但区域协调性逐步增强,具有较强平稳性,难以实现跨越式发展,空间向上转移省份比较集中,以中西部为主,向下调整省份较少,且存在明显的空间溢出效应,溢出影响具有不对称性。(3)影响机理方面,总体上,经济水平、产业结构、政府规制、教育水平和旅游资源影响因子与TGDE间存在显著的正向关系,对外开放程度的作用不显著,但各因子的影响程度、作用机理及条件具有较强地域性。
刘雨婧 , 唐健雄 . 中国旅游业绿色发展效率时空演变特征及影响机理[J]. 自然资源学报, 2022 , 37(3) : 681 -700 . DOI: 10.31497/zrzyxb.20220309
Green development is an important part of the concept of sustainable development of the tourism industry, which is the new value of people-oriented, ecological supremacy and comprehensive development of the tourism industry. Based on a thorough review of the concept of tourism green development, we construct an evaluation system of tourism green development efficiency by using SBM-Undersirable, the Coefficient of Variation, Kernel Density analysis and Spatial Markov Chain methods to depict a full picture of China's spatio-temporal patterns and impact mechanism of tourism green development efficiency (TGDE) from 2008 to 2018. Our results demonstrate that: (1) TGDE was generally below the average level, and temporally it shows a pattern of "W"-shaped fluctuated growth, with significant characteristics of "decline-rise-adjustment" stage. TGDE decreased from eastern to central and further to western region and the internal differences in the western region > eastern region > central region. In addition, the low, medium and high efficiency in various provinces had an obvious change from a "pyramid" to a "diamond" structure. Among them, the high efficiency areas are concentrated in the eastern coastal areas and the medium efficiency areas are mostly distributed in the central and western regions, while the low efficiency areas are located on both sides of Hu Huanyong Line. (2) TGDE has always been polarized but the regional coordination is gradually enhanced and it has strong stability, so it is difficult to achieve leapfrog development. In addition, provinces with TGDE spatial upward transfer are relatively concentrated, mainly in the central and western regions, and there are fewer provinces with downward adjustment. TGDE has obvious spatial spillover effect, that is to say, the high efficiency provinces release positive spillover effect, while low efficiency ones release negative spillover effect and the probability of upward transfer increases when they are adjacent to high efficiency types, and the spillover effect is asymmetric. (3) In terms of impact mechanism, it is found that there is a significant positive relationship between TGDE and economic level, industrial structure, technological innovation, government regulation, education level and tourism resource endowment through the panel data regression model and the impact of the degree of opening to the outside world is not significant, but there is high regionality in the impact degree of influence, mechanism of action and conditions of each factor.
表1 旅游业绿色发展效率评价指标体系Table 1 The evaluation system of TGDE |
| 指标类型 | 指标名称 | 指标说明 | |
|---|---|---|---|
| 投入指标 | 资本投入 | 旅游业固定资产 | |
| 劳动力投入 | 旅游企业就业人员、旅游高等院校学生数 | ||
| 技术投入 | 旅游高等院校数 | ||
| 能源消耗 | 旅游业能源消费总量 | ||
| 产出指标 | 期望产出 | 经济效益 | 旅游总收入 |
| 社会效益 | 根据旅游的主要社会影响构建社会效益指标 | ||
| 非期望产出 | 环境污染 | 旅游碳排放总量、旅游业废水排放量、旅游业废气排放量 | |
表2 旅游社会效益评价体系Table 2 The social welfare evaluation system of tourism industry |
| 目标层 | 准则层 | 要素层 | 指标层 |
|---|---|---|---|
| 旅游社会效益 指标 | 旅游收入福利 | 城乡居民旅游收入弹性 | 城镇居民人均可支配收入增长率/旅游总收入增长率 |
| 农村居民人均纯收入增长率/旅游总收入增长率 | |||
| 旅游就业福利 | 旅游直接从业人数占比 | 旅游直接从业人数/总就业人数/% | |
| 旅游直接就业乘数 | 旅游总收入增长量/旅游直接就业人数增长量/% | ||
| 旅游教育福利 | 旅游高校占比 | 高等旅游院校/学校总数/% | |
| 居民休闲福利 | 居民旅游恩格尔系数 | 居民旅游恩格尔系数/% |
表3 2008—2018年中国旅游业绿色发展效率马尔科夫转移矩阵Table 3 The Markov transfer matrix of TGDE in China from 2008 to 2018 |
| 类型 | 2008—2018年 | 2008—2010年 | 2010—2013年 | 2013—2018年 | |||||||||||
|---|---|---|---|---|---|---|---|---|---|---|---|---|---|---|---|
| 1 | 2 | 3 | 1 | 2 | 3 | 1 | 2 | 3 | 1 | 2 | 3 | ||||
| 1 | 0.864 | 0.102 | 0.034 | 1.000 | 0.000 | 0.000 | 0.841 | 0.111 | 0.048 | 0.829 | 0.145 | 0.026 | |||
| 2 | 0.172 | 0.719 | 0.109 | 0.273 | 0.727 | 0.000 | 0.077 | 0.846 | 0.077 | 0.184 | 0.711 | 0.105 | |||
| 3 | 0.057 | 0.057 | 0.886 | 0.000 | 0.091 | 0.909 | 0.059 | 0.059 | 0.882 | 0.073 | 0.049 | 0.878 | |||
注:1表示低效率水平地区,2为中等效率水平地区,3为高效率水平地区,下同。 |
表4 2008—2018年中国旅游业绿色发展效率空间马尔科夫转移矩阵Table 4 The spatial Markov transfer matrix of TGDE in China from 2008 to 2018 |
| 类型 | 2008—2018年 | 2008—2010年 | 2010—2013年 | 2013—2018年 | |||||||||
|---|---|---|---|---|---|---|---|---|---|---|---|---|---|
| 1 | 2 | 3 | 1 | 2 | 3 | 1 | 2 | 3 | 1 | 2 | 3 | ||
| 1 | 1 | 0.885 | 0.115 | 0.000 | 0.824 | 0.156 | 0.020 | 0.805 | 0.195 | 0.000 | 0.875 | 0.125 | 0.000 |
| 2 | 0.087 | 0.768 | 0.145 | 0.273 | 0.727 | 0.000 | 0.000 | 0.917 | 0.083 | 0.115 | 0.731 | 0.154 | |
| 3 | 0.000 | 0.148 | 0.852 | 0.000 | 0.250 | 0.750 | 0.000 | 0.138 | 0.862 | 0.100 | 0.283 | 0.617 | |
| 2 | 1 | 0.804 | 0.196 | 0.000 | 0.745 | 0.214 | 0.041 | 0.750 | 0.250 | 0.000 | 0.923 | 0.077 | 0.000 |
| 2 | 0.000 | 0.900 | 0.100 | 0.162 | 0.624 | 0.214 | 0.000 | 0.834 | 0.166 | 0.000 | 0.818 | 0.182 | |
| 3 | 0.000 | 0.146 | 0.854 | 0.000 | 0.065 | 0.935 | 0.000 | 0.126 | 0.874 | 0.000 | 0.333 | 0.667 | |
| 3 | 1 | 0.789 | 0.211 | 0.000 | 0.687 | 0.246 | 0.067 | 0.733 | 0.267 | 0.000 | 0.833 | 0.167 | 0.000 |
| 2 | 0.032 | 0.839 | 0.129 | 0.000 | 0.776 | 0.224 | 0.000 | 0.750 | 0.250 | 0.091 | 0.773 | 0.136 | |
| 3 | 0.000 | 0.108 | 0.892 | 0.000 | 0.059 | 0.941 | 0.000 | 0.000 | 1.000 | 0.000 | 0.129 | 0.871 | |
表5 面板数据平稳性检验Table 5 The stationary test of panel data |
| 区域 | 检验方法 | lnTGDE | lnrgdp | lnis | lntec | lner | lnopen | lnedu | lntr |
|---|---|---|---|---|---|---|---|---|---|
| 全国 | LLC | -5.045 (0.000)*** | -14.649 (0.000)*** | -15.396 (0.000)*** | -7.869 (0.000)*** | -4.962 (0.000)*** | -6.536 (0.000)*** | -7.161 (0.000)*** | -8.814 (0.000)*** |
| ADF | 81.305 (0.015)** | 123.203 (0.000)*** | 218.767 (0.000)*** | 74.757 (0.022)** | 98.237 (0.002)*** | 92.123 (0.008)*** | 129.745 (0.000)*** | 97.452 (0.003)*** | |
| PP | 80.298 (0.076)** | 8.299 (0.896) | 249.662 (0.000)*** | 173.755 (0.000)*** | 115.161 (0.000)*** | 78.576 (0.076)* | 168.579 (0.000)*** | 92.469 (0.007)*** | |
| 东部 | LLC | -4.149 (0.000)*** | -3.659 (0.000)*** | -14.186 (0.000)*** | -6.531 (0.000)*** | -2.663 (0.004)*** | -6.098 (0.000)*** | -6.061 (0.000)*** | -1.74 (0.040)9** |
| ADF | 16.266 (0.434) | 25.594 (0.269) | 123.875 (0.000)*** | 34.675 (0.000)*** | 32.067 (0.076)** | 32.661 (0.066)* | 67.398 (0.000)*** | 11.069 (0.974) | |
| PP | 28.013 (0.0031)** | 56.039 (0.000)*** | 146.135 (0.000)*** | 77.389 (0.000)*** | 39.362 (0.013)** | 10.787 (0.978) | 72.568 (0.000)*** | 17.065 (0.075)* | |
| 中部 | LLC | -2.693 (0.004)*** | -4.905 (0.000)*** | -4.622 (0.000)*** | -4.661 (0.000)*** | -3.580 (0.000)*** | -5.811 (0.000)*** | -2.764 (0.003)*** | -5.391 (0.000)*** |
| ADF | 23.661 (0.097)* | 21.037 (0.177) | 38.692 (0.001)*** | 25.572 (0.060)* | 33.796 (0.006)*** | 37.039 (0.002)*** | 25.129 (0.067)* | 29.655 (0.019)** | |
| PP | 26.217 (0.051)* | 42.679 (0.000)*** | 41.758 (0.000)*** | 56.007 (0.000)*** | 46.145 (0.000)*** | 36.119 (0.003)*** | 48.044 (0.000)*** | 26.813 (0.044)** | |
| 西部 | LLC | -2.871 (0.002)*** | -6.578 (0.000)*** | -5.035 (0.000)*** | -3.490 (0.000)*** | -4.658 (0.000)*** | -3.237 (0.000)*** | -4.252 (0.000)*** | -7.691 (0.000)*** |
| ADF | 34.802 (0.0714)* | 43.559 (0.008)*** | 56.192 (0.000)*** | 39.501 (0.024)7** | 35.469 (0.062)* | 38.861 (0.087)* | 37.079 (0.043)*** | 56.727 (0.002)*** | |
| PP | 37.203 (0.042)** | 78.832 (0.000)*** | 61.775 (0.000)*** | 39.898 (0.022)** | 46.083 (0.004)*** | 24.649 (0.425) | 47.961 (0.003)*** | 48.592 (0.002)*** |
注:括号内为各变量回归参数的P检验值;***、**、*分别表示变量在1%、5%、10%置信水平下显著,下同。 |
表6 面板数据模型回归结果Table 6 The regression results of panel data model |
| 变量 | 全国 | 东部地区 | 中部地区 | 西部地区 | ||||
|---|---|---|---|---|---|---|---|---|
| 固定效应 | 随机效应 | 固定效应 | 随机效应 | 固定效应 | 随机效应 | 固定效应 | 随机效应 | |
| 常数项c | 6.364** | 1.270 | 6.401*** | 1.368 | 4.774** | -4.513*** | -1.685 | -5.959*** |
| (6.157) | (1.248) | (4.093) | (1.279) | (2.153) | (-2.721) | (-0.716) | (-3.701) | |
| lnrgdp | 0.625*** | 0.205** | 0.715** | 0.257 | 0.692*** | 0.373* | 0.454* | 0.078 |
| (8.913) | (1.413) | (4.072) | (1.591) | (4.252) | (1.783) | (1.739) | (0.313) | |
| lnis | 0.684*** | 0.463* | 0.782** | -0.351 | 0.633* | 0.728* | 1.802** | 1.192** |
| (3.186) | (1.525) | (1.903) | (-1.023) | (1.766) | (1.654) | (4.899) | (2.213) | |
| lntec | 0.568*** | 0.281** | 0.763*** | 0.491*** | 0.624*** | 0.316** | 0.284* | 0.013 |
| (8.944) | (3.222) | (4.472) | (4.839) | (4.228) | (2.102) | (2.651) | (0.182) | |
| lner | 0.049** | -0.022 | -0.045** | -0.015 | 0.076* | 0.144** | 0.021 | -0.046 |
| (3.059) | (-0.489) | (-2.577) | (-0.330) | (1.265) | (2.153) | (0.032) | (-0.544) | |
| lnopen | -0.097 | 0.070** | -0.168* | 0.454*** | -0.061 | -0.001 | -0.219 | -0.155 |
| (-0.814) | (1.956) | (-2.246) | (4.893) | (-0.340) | (-0.994) | (-2.074) | (-1.246) | |
| lnedu | 0.790*** | 0.383* | 0.201 | 0.019 | 0.625 | 0.453 | 0.940* | 0.011 |
| (5.098) | (1.367) | (0.818) | (0.061) | (0.694) | (1.037) | (1.888) | (0.023) | |
| lntr | 0.277*** | 0.291* | -0.143 | 0.029 | 0.582** | 0.862*** | 0.654*** | 0.588* |
| (2.126) | (1.841) | (-0.753) | (0.202) | (2.337) | (3.172) | (2.635) | (1.871) | |
| 干扰项标准差 | 0.420 | 0.455 | 0.252 | 0.366 | 0.422 | 0.503 | 0.498 | 0.545 |
| R2 | 0.957 | 0.293 | 0.910 | 0.403 | 0.792 | 0.369 | 0.911 | 0.322 |
| 调整后的R2 | 0.952 | 0.278 | 0.908 | 0.366 | 0.751 | 0.314 | 0.897 | 0.283 |
| F值 | 184.957 | 19.716 | 348.461 | 10.914 | 19.887 | 6.692 | 64.312 | 11.314 |
注:括号内为估计系统的标准误差。 |
| [1] |
周亮, 车磊, 周成虎. 中国城市绿色发展效率时空演变特征及影响因素. 地理学报, 2019,74(10):2027-2044.
[
|
| [2] |
路小静, 时朋飞, 邓志伟, 等. 长江经济带旅游业绿色生产率测算与时空演变分析. 中国人口·资源与环境, 2019,29(7):19-30.
[
|
| [3] |
The UN World Tourism Organization (UNWTO). Towards a low carbon travel and tourism sector. The World Economic Forum, 2009.
|
| [4] |
吴国琴. 新常态背景下旅游业绿色发展问题探析. 信阳师范学院学报: 哲学社会科学版, 2015,35(7):71-74.
[
|
| [5] |
魏云洁, 刘鲁. 探寻新常态下旅游研究的新课题: 2014《旅游学刊》中国旅游研究年会综述. 旅游学刊, 2014,29(11):125-128.
[
|
| [6] |
程钰, 王晶晶, 王亚平, 等. 中国绿色发展时空演变轨迹与影响机理研究. 地理研究, 2019,38(11):1-21.
[
|
| [7] |
|
| [8] |
卢风. 绿色发展与生态文明建设的关键和根本. 中国地质大学学报: 社会科学版, 2017,18(1):1-9.
[
|
| [9] |
|
| [10] |
郭付友, 佟连军, 仇方道, 等. 鲁南经济带城乡绿色发展效率时空分异及驱动因素识别. 自然资源学报, 2020,35(8):1972-1985.
[
|
| [11] |
|
| [12] |
|
| [13] |
|
| [14] |
|
| [15] |
|
| [16] |
谢婷. 顾客选择入住绿色饭店的行为意向研究: 基于计划行为理论角度. 旅游学刊, 2016,31(6):94-103.
[
|
| [17] |
|
| [18] |
陈能幸, 田华杰. 高分子材料循环技术在旅游循环经济中的应用. 交通节能与环保, 2009, (4):35-37.
[
|
| [19] |
|
| [20] |
刘佳, 宋秋月. 中国旅游产业绿色创新效率的空间网络结构与形成机制. 中国人口·资源与环境, 2018,28(8):127-137.
[
|
| [21] |
彭红松, 章锦河, 韩娅, 等. 旅游地生态效率测度的SBM-DEA模型及实证分析. 生态学报, 2017,37(2):628-638.
[
|
| [22] |
王坤, 黄震方, 曹芳东. 中国旅游业碳排放效率的空间格局及其影响因素. 生态学报, 2015,35(21):7150-7160.
[
|
| [23] |
程慧, 徐琼, 赵梦亚. 中国旅游生态效率的空间关联网络结构及其影响因素研究. 生态科学, 2020,39(5):169-178.
[
|
| [24] |
胡鞍钢, 周绍杰. 绿色发展: 功能界定、机制分析与发展战略. 中国人口·资源与环境, 2014,24(1):14-20.
[
|
| [25] |
王耕, 李素娟, 马奇飞. 中国生态文明建设效率空间均衡性及格局演变特征. 地理学报, 2018,73(11):2198-2209.
[
|
| [26] |
陈娅玲. 陕西秦岭地区旅游社会—生态系统脆弱性评价及适应性管理对策研究. 西安: 西北大学, 2013.
[
|
| [27] |
江金波, 唐金稳. 珠江三角洲旅游创新的协调发展研究: 基于二象对偶理论视角. 地理研究, 2018,37(9):1751-1761.
[
|
| [28] |
贺腊梅, 于萌, 查建平. 基于BML生产率指数的中国旅游业能源效率评价与影响因素研究. 长江流域资源与环境, 2017,26(12):1991-2002.
[
|
| [29] |
朱麟奇, 李秋雨, 刘继生. 中国旅游业与地区发展及民生改善协调关系研究. 地理科学, 2020,40(8):1328-1335.
[
|
| [30] |
|
| [31] |
石培华, 吴普. 中国旅游业能源消耗与CO2排放量的初步估算. 地理学报, 2011,66(2):235-243.
[
|
| [32] |
魏艳旭, 孙根年, 马丽君, 等. 中国旅游交通碳排放及地区差异的初步估算. 陕西师范大学学报: 自然科学版, 2012,40(2):76-84.
[
|
| [33] |
钟章奇, 吴静, 许爱文, 等. 中国各省区旅游业碳排放量初步估算及区域差异. 世界地理研究, 2016,25(1):83-94.
[
|
| [34] |
|
| [35] |
侯孟阳, 姚顺波. 1978—2016年中国农业生态效率时空演变及趋势预测. 地理学报, 2018,73(11):2168-2183.
[
|
| [36] |
徐维祥, 李露, 周建平, 等. 乡村振兴与新型城镇化耦合协调的动态演进及其驱动机制. 自然资源学报, 2020,35(9):2044-2062.
[
|
| [37] |
方叶林, 黄震方, 王芳, 等. 中国大陆省际旅游效率时空演化及其俱乐部趋同研究. 地理科学进展, 2018,37(10):1392-1404.
[
|
| [38] |
卢飞, 宫红平. 中国旅游生态效率测度、时空特征与影响因素研究. 统计与决策, 2020, (16):96-100.
[
|
| [39] |
麻学锋, 崔盼盼. 旅游演艺业对旅游产业成长的响应过程与影响机制: 以张家界“魅力湘西”为例. 地理与地理科学信息, 2019,35(1):118-124.
[
|
/
| 〈 |
|
〉 |