
土地利用变化对区域水—能源—粮食系统耦合协调度的影响——以京津冀城市群为研究对象
|
王勇(1988- ),男,山东临沂人,博士,副教授,硕士生导师,研究方向为人口统计、城市经济。E-mail: ywang@dufe.edu.cn |
收稿日期: 2021-04-20
修回日期: 2021-07-31
网络出版日期: 2022-05-28
基金资助
国家自然科学基金项目(72104046)
辽宁省“兴辽英才计划”项目(XLYC1907012)
辽宁省文化名家暨“四个一批”人才培养项目(LNSGYP20071)
全国统计科学研究项目(2021LZ24)
版权
Impact of land use change on coupling coordination degree of regional water-energy-food system: A case study of Beijing-Tianjin-Hebei Urban Agglomeration
Received date: 2021-04-20
Revised date: 2021-07-31
Online published: 2022-05-28
Copyright
将土地因素引入水—能源—粮食系统,运用耦合协调模型对京津冀城市群2005— 2018年水—能源—粮食—土地系统的时空变化特征进行研究。结果表明:(1)从空间尺度上来看,京津冀城市群建设用地由中心向四周扩散;从京津冀城市群土地利用格局来看,耕地和建设用地面积分别呈现较为明显的下降和增长趋势。(2)将土地纳入水—能源—粮食系统降低了京津冀城市群大多数城市水—能源—粮食系统间的耦合度和耦合协调度。(3)土地与水—能源—粮食子系统组成的两要素系统的协调水平会进行叠加或抵消进而影响水—能源—粮食—土地系统耦合协调度。本文的研究启示在于:京津冀城市群在考虑水、能源、粮食协调发展的同时,应考虑土地对水—能源—粮食系统整体及内部子系统的影响,根据城市自身资源优势合理配置资源、优化产业布局以实现可持续发展。
王勇 , 孙瑞欣 . 土地利用变化对区域水—能源—粮食系统耦合协调度的影响——以京津冀城市群为研究对象[J]. 自然资源学报, 2022 , 37(3) : 582 -599 . DOI: 10.31497/zrzyxb.20220303
In this paper, the land factor is introduced into the water-energy-food system, and the coupling coordination model is used to study the spatio-temporal change characteristics of the water-energy-food-land system in the Beijing-Tianjin-Hebei Urban Agglomeration from 2004 to 2017. The results show that: (1) On the spatial scale, the construction land of the study area diffuses from the center to the periphery. In terms of land use pattern of the urban agglomeration, the area of cultivated land and construction land showed a relatively obvious decline and growth trend, respectively. (2) The integration of land into the water-energy-food system reduces the coupling degree and co-scheduling of water-energy-food systems in most cities of this urban agglomeration. (3) The coordination level of land and water-energy-food subsystem will be superimposed or offset, which will affect the coupling coordination of water-energy-food-land system. The research enlightenment of this paper is that considering the coordinated development of water, energy and grain, the Beijing-Tianjin-Hebei Urban Agglomeration should understand the impact of land on the whole and internal subsystems of the water-energy-food system, allocate resources reasonably and optimize the industrial layout according to the city's own resource advantages, so as to achieve sustainable development.
表1 京津冀城市群水—能源—粮食—土地系统耦合协调度评价指标体系Table 1 Evaluation index system of coupling coordination degree of water-energy-food-land system in Beijing-Tianjin-Hebei Urban Agglomeration |
| 目标层 | 指标层 | 单位 | 指标性质 |
|---|---|---|---|
| 水子系统 | 降水总量 | mm | 正 |
| 人均水资源总量 | m3/人 | 正 | |
| 生活用水占比 | % | 正 | |
| 农业用水占比 | % | 正 | |
| 人均用水量 | m3 | 负 | |
| 生态用水占比 | % | 正 | |
| 产水模数 | 万m3/km2 | 正 | |
| 万元GDP用水量 | m3/万元 | 负 | |
| 能源子系统 | 能源消费总量 | 万tce | 负 |
| 人均能源消费量 | t/人 | 负 | |
| 能源工业投资 | 亿元 | 正 | |
| 能源消耗强度 | t/万元 | 负 | |
| 二氧化硫排放量 | t | 负 | |
| 粮食子系统 | 人均粮食产量 | kg | 正 |
| 粮食单产 | kg/hm2 | 正 | |
| 人口自然增长率 | ‰ | 负 | |
| 化肥负荷 | t/hm2 | 负 | |
| 机械动力 | kW/hm2 | 正 | |
| 农用柴油使用量 | t | 负 | |
| 受灾面积 | hm2 | 负 | |
| 粮食消费价格指数 | 负 | ||
| 粮食流动成本 | 负 | ||
| 土地子系统 | 人口密度 | 人/km2 | 负 |
| 人均建设用地面积 | m2/人 | 正 | |
| 地均GDP | 万元/km2 | 正 | |
| 地均工业废水排放量 | t/km2 | 负 | |
| 人均绿地面积 | m2/人 | 正 | |
| 建成区绿化覆盖率 | % | 正 |
图2 京津冀城市群2005年、2010年、2015年、2018年土地利用Fig. 2 Land use map of Beijing-Tianjin-Hebei Urban Agglomeration in 2005, 2010, 2015 and 2018 |
表2 2005—2018年京津冀城市群各土地利用类型变化情况Table 2 Changes of land use types in Beijing-Tianjin-Hebei Urban Agglomeration from 2005 to 2018 |
| 土地利用类型变化 | 耕地 | 林地 | 草地 | 水域 | 建设用地 | 未利用地 |
|---|---|---|---|---|---|---|
| 2005面积/km2 | 108266.43 | 44661.40 | 35092.32 | 6176.49 | 19324.16 | 2024.46 |
| 2010面积/km2 | 104009.47 | 44988.36 | 34031.82 | 5465.68 | 25766.92 | 1283.28 |
| 2015面积/km2 | 102507.66 | 44856.23 | 33803.31 | 5489.71 | 27597.75 | 1281.34 |
| 2018面积/km2 | 97808.22 | 45651.96 | 33683.30 | 5573.80 | 31240.30 | 1578.16 |
| 2005年面积占比/% | 50.23 | 20.72 | 16.28 | 2.87 | 8.97 | 0.94 |
| 2018年面积占比/% | 45.38 | 21.18 | 15.63 | 2.59 | 14.49 | 0.73 |
| 2005—2018年变化量/km2 | -10458.22 | 990.56 | -1409.03 | -602.68 | 11916.14 | -446.30 |
| 2005—2010年动态度/% | -0.79 | 0.15 | -0.60 | -2.30 | 6.67 | -7.32 |
| 2010—2015年动态度/% | -0.29 | -0.06 | -0.13 | 0.09 | 1.42 | -0.03 |
| 2015—2018年动态度/% | -1.53 | 0.59 | -0.12 | 0.51 | 4.40 | 7.72 |
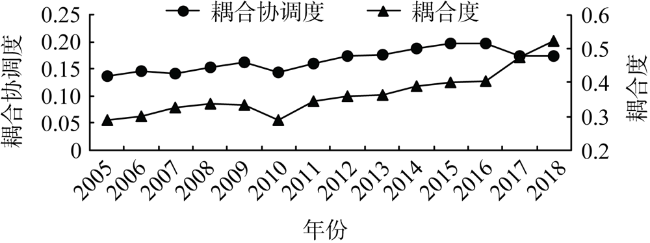
图3 2005—2018年京津冀城市群整体的水—能源—粮食系统耦合度和耦合协调度发展趋势Fig. 3 Development trend of coupling degree and coupling coordination degree of water-energy-food system in Beijing-Tianjin-Hebei Urban Agglomeration from 2005 to 2018 |
表3 京津冀城市群水—能源—粮食系统不同时间段耦合度及耦合协调度均值Table 3 Average coupling degree and coupling coordination degree of water-energy-food system in different time periods of Beijing-Tianjin-Hebei Urban Agglomeration |
| 时间段/年 | 耦合度 | 耦合协调度 | |||||||
|---|---|---|---|---|---|---|---|---|---|
| 2005—2009 | 2010—2014 | 2015—2018 | 2005—2018 | 2005—2009 | 2010—2014 | 2015—2018 | 2005—2018 | ||
| 北京 | 0.594 | 0.480 | 0.421 | 0.504 | 0.129 | 0.157 | 0.140 | 0.142 | |
| 天津 | 0.942 | 0.828 | 0.875 | 0.882 | 0.113 | 0.126 | 0.151 | 0.128 | |
| 石家庄 | 0.855 | 0.731 | 0.785 | 0.791 | 0.285 | 0.324 | 0.410 | 0.335 | |
| 唐山 | 0.417 | 0.372 | 0.418 | 0.401 | 0.218 | 0.195 | 0.234 | 0.214 | |
| 秦皇岛 | 0.450 | 0.479 | 0.505 | 0.476 | 0.205 | 0.234 | 0.291 | 0.240 | |
| 邯郸 | 0.387 | 0.449 | 0.552 | 0.456 | 0.191 | 0.161 | 0.198 | 0.182 | |
| 邢台 | 0.220 | 0.197 | 0.366 | 0.254 | 0.153 | 0.154 | 0.157 | 0.155 | |
| 保定 | 0.310 | 0.406 | 0.480 | 0.393 | 0.157 | 0.179 | 0.210 | 0.180 | |
| 张家口 | 0.344 | 0.441 | 0.409 | 0.397 | 0.169 | 0.223 | 0.227 | 0.205 | |
| 承德 | 0.788 | 0.970 | 0.718 | 0.833 | 0.276 | 0.352 | 0.288 | 0.307 | |
| 沧州 | 0.286 | 0.375 | 0.720 | 0.442 | 0.149 | 0.158 | 0.160 | 0.156 | |
| 廊坊 | 0.195 | 0.184 | 0.510 | 0.281 | 0.178 | 0.195 | 0.178 | 0.184 | |
| 衡水 | 0.249 | 0.222 | 0.451 | 0.297 | 0.104 | 0.118 | 0.148 | 0.121 | |
图4 2005—2018年京津冀城市群整体的水—能源—粮食—土地系统耦合度和耦合协调度发展趋势Fig. 4 Development trend of coupling degree and coupling coordination degree of water-energy-food-land system in Beijing-Tianjin-Hebei Urban Agglomeration from 2005 to 2018 |
表4 京津冀城市群水—能源—粮食—土地系统不同时间段耦合度及耦合协调度均值Table 4 Average coupling degree and coupling coordination degree of water-energy-food-land system in different time periods of Beijing-Tianjin-Hebei Urban Agglomeration |
| 时间段/年 | 耦合度 | 耦合协调度 | |||||||
|---|---|---|---|---|---|---|---|---|---|
| 2005—2009 | 2010—2014 | 2015—2018 | 2005—2018 | 2005—2009 | 2010—2014 | 2015—2018 | 2005—2018 | ||
| 北京 | 0.604 | 0.495 | 0.489 | 0.532 | 0.125 | 0.153 | 0.146 | 0.141 | |
| 天津 | 0.324 | 0.394 | 0.498 | 0.399 | 0.119 | 0.132 | 0.156 | 0.134 | |
| 石家庄 | 0.571 | 0.465 | 0.498 | 0.512 | 0.222 | 0.245 | 0.311 | 0.255 | |
| 唐山 | 0.300 | 0.318 | 0.360 | 0.324 | 0.175 | 0.172 | 0.206 | 0.183 | |
| 秦皇岛 | 0.387 | 0.418 | 0.383 | 0.397 | 0.180 | 0.209 | 0.240 | 0.208 | |
| 邯郸 | 0.254 | 0.345 | 0.408 | 0.330 | 0.147 | 0.133 | 0.162 | 0.146 | |
| 邢台 | 0.187 | 0.189 | 0.378 | 0.243 | 0.135 | 0.144 | 0.151 | 0.143 | |
| 保定 | 0.241 | 0.317 | 0.400 | 0.313 | 0.131 | 0.151 | 0.182 | 0.153 | |
| 张家口 | 0.181 | 0.220 | 0.211 | 0.203 | 0.116 | 0.149 | 0.155 | 0.139 | |
| 承德 | 0.437 | 0.534 | 0.464 | 0.480 | 0.196 | 0.248 | 0.221 | 0.222 | |
| 沧州 | 0.223 | 0.404 | 0.755 | 0.440 | 0.124 | 0.157 | 0.165 | 0.147 | |
| 廊坊 | 0.157 | 0.152 | 0.477 | 0.247 | 0.150 | 0.168 | 0.163 | 0.160 | |
| 衡水 | 0.265 | 0.289 | 0.542 | 0.353 | 0.102 | 0.131 | 0.160 | 0.129 | |
表5 2005—2018年京津冀城市群土地与水、能源和粮食耦合度及耦合协调度均值Table 5 Mean value of coupling degree and coupling coordination degree of land and water or energy or food in Beijing-Tianjin-Hebei Urban Agglomeration from 2005 to 2018 |
| 城市 | 土地—水 | 土地—能源 | 土地—粮食 | |||||
|---|---|---|---|---|---|---|---|---|
| 耦合度 | 耦合协调度 | 耦合度 | 耦合协调度 | 耦合度 | 耦合协调度 | |||
| 北京 | 0.687 | 0.177 | 0.856 | 0.083 | 0.839 | 0.135 | ||
| 天津 | 0.601 | 0.306 | 0.399 | 0.240 | 0.400 | 0.242 | ||
| 石家庄 | 0.512 | 0.158 | 0.534 | 0.163 | 0.409 | 0.183 | ||
| 唐山 | 0.372 | 0.191 | 0.496 | 0.164 | 0.970 | 0.075 | ||
| 秦皇岛 | 0.595 | 0.176 | 0.988 | 0.098 | 0.431 | 0.214 | ||
| 邯郸 | 0.274 | 0.147 | 0.967 | 0.061 | 0.472 | 0.109 | ||
| 邢台 | 0.317 | 0.207 | 0.931 | 0.068 | 0.903 | 0.101 | ||
| 保定 | 0.277 | 0.177 | 0.884 | 0.086 | 0.860 | 0.087 | ||
| 张家口 | 0.166 | 0.108 | 0.778 | 0.044 | 0.195 | 0.106 | ||
| 承德 | 0.433 | 0.131 | 0.397 | 0.140 | 0.363 | 0.141 | ||
| 沧州 | 0.512 | 0.197 | 0.948 | 0.104 | 0.874 | 0.105 | ||
| 廊坊 | 0.273 | 0.220 | 0.974 | 0.070 | 0.779 | 0.109 | ||
| 衡水 | 0.641 | 0.229 | 0.609 | 0.080 | 0.833 | 0.124 | ||
| [1] |
张力小, 张鹏鹏, 郝岩, 等. 城市食物—能源—水关联关系: 概念框架与研究展望. 生态学报, 2019,39(4):1144-1153.
[
|
| [2] |
|
| [3] |
赵荣钦, 李志萍, 韩宇平, 等. 区域“水—土—能—碳”耦合作用机制分析. 地理学报, 2016,71(9):1613-1628.
[
|
| [4] |
王婧, 方创琳, 李裕瑞. 中国城乡人口与建设用地的时空变化及其耦合特征研究. 自然资源学报, 2014,29(8):1271-1281.
[
|
| [5] |
金涛. 中国粮食作物种植结构调整及其水土资源利用效应. 自然资源学报, 2019,34(1):14-25.
[
|
| [6] |
璩路路, 王永生, 刘彦随, 等. 乡村振兴导向的水土资源承载力评价及其优化. 自然资源学报, 2021,36(2):300-314.
[
|
| [7] |
米红, 周伟. 未来30年我国粮食、淡水、能源需求的系统仿真. 人口与经济, 2010, (1):1-7.
[
|
| [8] |
李桂君, 黄道涵, 李玉龙. 水—能源—粮食关联关系: 区域可持续发展研究的新视角. 中央财经大学学报, 2016, (12):76-90.
[
|
| [9] |
白景锋, 张海军. 中国水—能源—粮食压力时空变动及驱动力分析. 地理科学, 2018,38(10):1653-1660.
[
|
| [10] |
李良, 毕军, 周元春, 等. 基于粮食—能源—水关联关系的风险管控研究进展. 中国人口·资源与环境, 2018,28(7):85-92.
[
|
| [11] |
赵良仕, 刘思佳, 孙才志. 黄河流域水—能源—粮食安全系统的耦合协调发展研究. 水资源保护, 2021,37(1):69-78.
[
|
| [12] |
彭少明, 郑小康, 王煜, 等. 黄河流域水资源—能源—粮食的协同优化. 水科学进展, 2017,28(5):681-690.
[
|
| [13] |
张洪芬, 曾静静, 曲建升, 等. 资源高强度流动区水、能源和粮食耦合协调发展研究: 以京津冀地区为例. 中国农村水利水电, 2019, (5):17-21, 28.
[
|
| [14] |
李成宇, 张士强. 中国省际水—能源—粮食耦合协调度及影响因素研究. 中国人口·资源与环境, 2020,30(1):120-128.
[
|
| [15] |
|
| [16] |
|
| [17] |
|
| [18] |
李桂君, 李玉龙, 贾晓菁, 等. 北京市水—能源—粮食可持续发展系统动力学模型构建与仿真. 管理评论, 2016,28(10):11-26.
[
|
| [19] |
|
| [20] |
|
| [21] |
|
| [22] |
|
| [23] |
|
| [24] |
罗娅, 杨胜天, 刘晓燕, 等. 黄河河口镇—潼关区间1998—2010年土地利用变化特征. 地理学报, 2014,69(1):42-53.
[
|
| [25] |
王秀兰, 包玉海. 土地利用动态变化研究方法探讨. 地理科学进展, 1999,18(1):81-87.
[
|
| [26] |
庄大方, 刘纪远. 中国土地利用程度的区域分异模型研究. 自然资源学报, 1997,12(2):105-111.
[
|
| [27] |
何改丽, 李加林, 刘永超, 等. 1985—2015年美国坦帕湾流域土地开发利用强度时空变化分析. 自然资源学报, 2019,34(1):66-79.
[
|
| [28] |
毕博, 陈丹, 邓鹏, 等. 区域水资源—能源—粮食系统耦合协调演化特征研究. 中国农村水利水电, 2018, (2):72-77.
[
|
| [29] |
张明斗, 莫冬燕. 城市土地利用效益与城市化的耦合协调性分析: 以东北三省34个地级市为例. 资源科学, 2014,36(1):8-16.
[
|
| [30] |
田俊峰, 王彬燕, 王士君. 东北三省城市土地利用效益评价及耦合协调关系研究. 地理科学, 2019,39(2):305-315.
[
|
| [31] |
刘耀彬, 李仁东, 宋学峰. 中国城市化与生态环境耦合度分析. 自然资源学报, 2005,20(1):105-112.
[
|
| [32] |
李裕瑞, 王婧, 刘彦随, 等. 中国”四化”协调发展的区域格局及其影响因素. 地理学报, 2014,69(2):199-212.
[
|
| [33] |
张引, 杨庆媛, 闵婕. 重庆市新型城镇化质量与生态环境承载力耦合分析. 地理学报, 2016,71(5):817-828.
[
|
| [34] |
葛世帅, 曾刚, 杨阳, 等. 黄河经济带生态文明建设与城市化耦合关系及空间特征研究. 自然资源学报, 2021,36(1):87-102.
[
|
| [35] |
廖重斌. 环境与经济协调发展的定量评判及其分类体系: 以珠江三角洲城市群为例. 热带地理, 1999,19(2):171-177.
[
|
| [36] |
刘纪远, 匡文慧, 张增祥, 等. 20世纪80年代末以来中国土地利用变化的基本特征与空间格局. 地理学报, 2014,69(1):3-14.
[
|
| [37] |
李孝永, 匡文慧. 京津冀1980—2015年城市土地利用变化时空轨迹及未来情景模拟. 经济地理, 2019,39(3):187-194, 200.
[
|
| [38] |
陈瑜琦, 王静, 李秀彬. 从土地资源利用的角度看待生物能源发展. 中国土地科学, 2011,25(4):20-25.
[
|
| [39] |
陈瑜琦, 李秀彬, 盛燕, 等. 发展生物能源引发的土地利用问题. 自然资源学报, 2010,25(9):1496-1505.
[
|
| [40] |
邵晓梅. 区域土地利用变化及其对粮食生产影响分析: 以山东省为例. 地理科学进展, 2003,22(1):30-37.
[
|
/
| 〈 |
|
〉 |


