
农产品质量安全内部协调度和耦合度测算及影响因素分析
|
杨建辉(1983-),男,山东莱州人,博士,教授,主要从事农业生态经济学领域研究。E-mail: qingfengzi@163.com |
收稿日期: 2020-10-26
要求修回日期: 2021-04-16
网络出版日期: 2022-02-16
基金资助
国家社会科学基金项目(21BJY133)
国家自然科学基金项目(42001249)
版权
Influence of agricultural factor input regulation on internal disturbance and coupling of agro-product quality and safety
Received date: 2020-10-26
Request revised date: 2021-04-16
Online published: 2022-02-16
Copyright
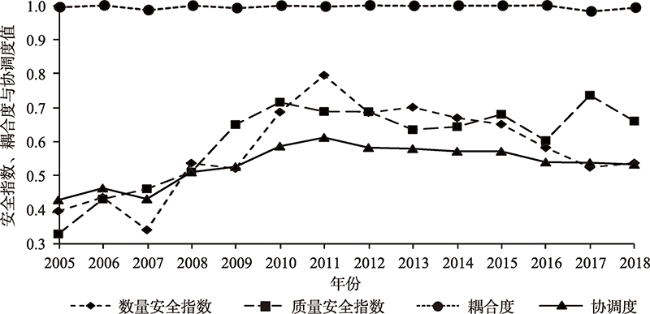
在讨论农产品质量安全内涵的基础上,构建了农产品数量安全和质量安全指标体系,基于熵值法、CRITIC法、Ganger因果检验和回归分析等方法,使用2005—2018年中国时序数据,测度农产品质量安全的耦合度和协调度,并对农产品质量安全内部协调度的农业要素投入和管制导向影响进行了研究。研究表明:农产品质量安全内部存在相对单向的扰动,属于数量安全高于质量安全的非均衡体系;农产品质量安全内部呈现出高度的内部耦合,但发展协调度不高;化学品投入和产业投入对农产品质量安全内部协调发展具有推动作用,其他要素投入影响不明显;管制导向对农产品质量安全内部协调度有积极影响,其中,农业支持保护补贴和地理标志农产品登记数量的正向影响最大。未来应该通过优化管制效能,不断提高技术投入等要素的投入效率。
关键词: 农产品质量安全; 扰动; 协调度; Ganger因果检验; 管制
杨建辉 , 杨伦 . 农产品质量安全内部协调度和耦合度测算及影响因素分析[J]. 自然资源学报, 2022 , 37(2) : 494 -507 . DOI: 10.31497/zrzyxb.20220215
On the basis of discussing the connotation of agro-product quality and safety, this paper constructs an index system of agro-product quantity safety and quality safety. Based on the methods of weight calculation and Ganger causality test, this paper analyzes the internal disturbance and coupling status of agro-product quality and safety by using China's time series data from 2005 to 2018, and examines the impact of agricultural factor input and regulation on the internal coordination degree of agro-product quality and safety. The results show that, firstly, there is a relatively unidirectional disturbance in agro-product quality and safety, and the internal system of agro-product quality and safety belongs to the unbalanced system in which the level of quantity safety is higher than that of quality safety; secondly, the internal coupling degree of agro-product quality and safety is high, but that of development coordination is not; thirdly, the chemical input and industrial input have a promoting effect on the internal coordinated development of agro-product quality and safety; fourthly, regulation has a positive impact on the internal coordination degree of agro-product quality and safety, and the positive impact of agricultural support and protection subsidies and the number of registrations of Agro-Product Geographical Indications is the largest. In the future, we should improve the input efficiency of technology input and other elements by optimizing the control efficiency.
表1 指标体系的构建与变量说明Table 1 Construction of index system and variable description |
| 变量 | 单位 | ||
|---|---|---|---|
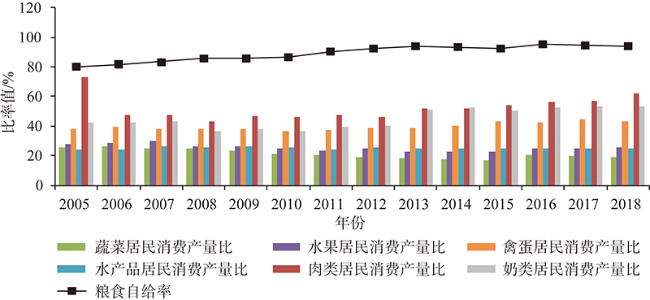
| 数量安全 | 宏观层面 | 粮食生产能力 | ×108 t |
| 粮食自给率 | % | ||
| 微观层面 | 蔬菜居民消费产量比 | % | |
| 水果居民消费产量比 | % | ||
| 蛋类居民消费产量比 | % | ||
| 水产品居民消费产量比 | % | ||
| 肉类居民消费产量比 | % | ||
| 奶类居民消费产量比 | % | ||
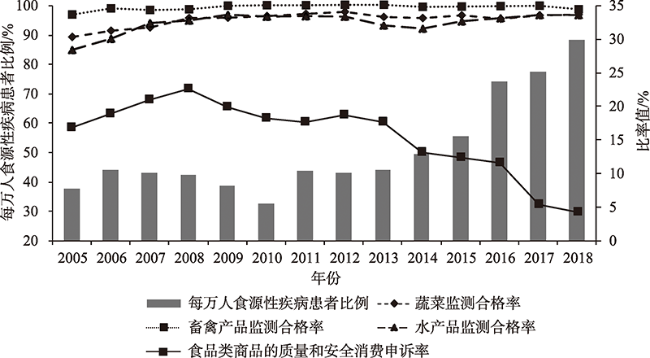
| 质量安全 | 直接评价 | 蔬菜监测合格率 | % |
| 畜禽产品监测合格率 | % | ||
| 水产品监测合格率 | % | ||
| 食源性疾病患者占总人口数量比例 | % | ||
| 间接评价 | 食品类商品的质量和安全消费申诉率 | % | |
| 农业要素投入 | 科技投入 | 企事业单位农业技术人员数量占就业人员比例 | % |
| 化学品投入 | 单位播种面积农药使用量 | kg/hm2 | |
| 水利投入 | 有效灌溉率 | % | |
| 机械投入 | 单位播种面积农业机械总动力 | kW·h/hm2 | |
| 产业化投入 | 单位播种面积农业企业法人数量 | 个/hm2 | |
| 劳动投入 | 单位播种面积从业人员数量 | 人/hm2 | |
| 管制导向 | 支持型管制 | 农机具购置补贴 | ×108元 |
| 农业技术推广与服务补助 | ×108元 | ||
| 农业支持保护补贴 | ×108元 | ||
| 强制型管制 | 农产品质量安全支出 | ×108元 | |
| 引导型管制 | 地理标志农产品登记数量 | 个 | |
| 农业生产资料的质量和安全消费申诉率 | % | ||
表2 农产品质量安全相关变量的权重Table 2 Weight of agro-product quality and safety related variables (%) |
| 变量 | 熵值法 | CRITIC法 | 综合值 | |
|---|---|---|---|---|
| 数量安全 | 粮食生产能力 | 14.45 | 12.04 | 13.25 |
| 粮食自给率 | 11.59 | 10.59 | 11.09 | |
| 蔬菜居民消费产量比 | 13.89 | 10.05 | 11.97 | |
| 水果居民消费产量比 | 9.48 | 8.42 | 8.95 | |
| 蛋类居民消费产量比 | 9.41 | 13.97 | 11.69 | |
| 水产品居民消费产量比 | 13.24 | 15.04 | 14.14 | |
| 肉类居民消费产量比 | 6.13 | 10.59 | 8.36 | |
| 奶类居民消费产量比 | 21.82 | 19.31 | 20.57 | |
| 质量安全 | 蔬菜监测合格率 | 15.75 | 13.05 | 14.40 |
| 畜禽产品监测合格率 | 13.32 | 13.51 | 13.42 | |
| 水产品监测合格率 | 14.00 | 14.38 | 14.19 | |
| 食源性疾病患者占总人口数量比例 | 18.54 | 33.44 | 25.99 | |
| 食品类商品的质量和安全消费申诉率 | 38.38 | 25.62 | 32.00 | |
表3 农产品质量安全内部扰动Table 3 Internal disturbance of agro-product quality and safety |
| 数量安全指数体系对质量安全指数的扰动 | 质量安全指数体系对数量安全指数的扰动 | |||||||||||
|---|---|---|---|---|---|---|---|---|---|---|---|---|
| 最佳滞 后期 | F值 | P值 | AIC | BIC | 最佳滞 后期 | F值 | P值 | AIC | BIC | |||
| 粮食综合生产能力 | 滞后一期 | 10.10 | 0.0040 | -33.66 | -31.97 | 蔬菜监测合 格率 | 滞后一期 | 7.62 | 0.0098 | -24.87 | -23.18 | |
| 小麦稻谷自给率 | 滞后一期 | 10.63 | 0.0033 | -34.11 | -32.41 | 畜禽产品监测合格率 | 滞后一期 | 6.54 | 0.0152 | -23.72 | -22.02 | |
| 蔬菜居民消费产量比 | 滞后一期 | 10.40 | 0.0036 | -33.91 | -32.22 | 水产品监测合格率 | 滞后一期 | 9.03 | 0.0057 | -26.25 | -24.56 | |
| 水果居民消费产量比 | 滞后一期 | 10.20 | 0.0039 | -33.74 | -32.05 | 食源性疾病患者比例 | 滞后四期 | 5.97 | 0.3070 | -41.78 | -39.06 | |
| 禽蛋居民消费产量比 | 滞后一期 | 10.44 | 0.0036 | -33.95 | -32.26 | 食品类商品的质量和安全消费申诉率 | 滞后四期 | 231.77 | 0.0508 | -78.18 | -75.45 | |
| 水产品居民消费产量比 | 滞后一期 | 10.53 | 0.0035 | -34.02 | -32.33 | 质量安全 | 滞后三期 | 2.82 | 0.1676 | -27.01 | -24.23 | |
| 肉类居民消费产量比 | 滞后一期 | 10.42 | 0.0036 | -33.93 | -32.24 | |||||||
| 奶类居民消费产量比 | 滞后一期 | 10.17 | 0.0039 | -33.72 | -32.03 | |||||||
| 数量安全 | 滞后一期 | 10.32 | 0.0037 | -33.85 | -32.15 | |||||||
表4 农业要素投入的描述性统计及回归结果Table 4 Descriptive statistics and regression results of agricultural factor input |
| 变量 | 平均值 | 标准差 | 最小值 | 最大值 | 模型1 (协调度) | 模型2 (数量安全指数) | 模型3 (质量安全指数) |
|---|---|---|---|---|---|---|---|
| lnD/(1-D) | 0.1591 | 0.2301 | -0.2592 | 0.4744 | — | — | — |
| lnQuan/(1-Quan) | 0.3475 | 0.5509 | -0.6254 | 1.3673 | — | — | — |
| lnQual/(1-Qual) | 0.4511 | 0.5050 | -0.6769 | 1.0400 | — | — | — |
| lntech | 3.3030 | 0.1611 | 3.0498 | 3.5123 | -3.0257** (-2.59) | -7.6303 (-1.44) | -7.6567* (-2.21) |
| lnchem | 4.6556 | 0.0658 | 4.5071 | 4.7163 | 1.6275* (2.17) | 3.3115 (1.22) | 6.4390*** (3.85) |
| lnirri | -0.9531 | 0.0405 | -1.0387 | -0.8879 | -4.1640** (-2.43) | -13.8273** (-2.93) | -3.9975 (-1.48) |
| lnmech | 7.0103 | 3.4250 | -1.0766 | 8.6187 | 0.0075 (1.64) | 0.0388 (1.74) | -0.0491** (-3.26) |
| lnindu | 1.3439 | 1.8591 | -2.1186 | 3.1827 | 0.1841* (2.11) | 0.4717 (1.64) | 0.1763 (1.18) |
| lnlabor | 0.4830 | 0.1972 | 0.2305 | 0.7658 | -2.4130 (-1.66) | -6.2958 (-0.97) | -6.9864 (-1.60) |
| 常数项 | — | — | — | — | -0.5274 (-0.25) | -0.9112 (-0.09) | -4.5657 (-0.69) |
| R2 | — | — | — | — | 0.9187 | 0.8182 | 0.8233 |
注:*、**和***分别表示在10%、5%和1%水平下显著,括号中为t值,表征该变量的显著程度,下同。 |
表5 管制导向的描述性统计及回归结果Table 5 Descriptive statistics and regression results of regulation |
| 变量 | 平均值 | 标准差 | 最小值 | 最大值 | 模型4 (协调度) | 模型5 (数量安全指数) | 模型6 (质量安全指数) |
|---|---|---|---|---|---|---|---|
| lnsubm | 4.2597 | 2.3148 | 0.0000 | 5.8081 | 0.2817** (2.50) | 0.7968 (1.77) | 0.7349** (2.55) |
| lnsubt | 4.0002 | 0.8495 | 2.4849 | 5.1828 | -0.0063 (-0.05) | -0.0277 (-0.06) | -0.4186 (-1.27) |
| lnsubs | 6.3472 | 1.8769 | 0.0000 | 7.4020 | 0.0525*** (3.79) | 0.1402*** (4.95) | 0.0522 (0.95) |
| lnexps | 1.5600 | 0.4398 | 0.2305 | 0.7658 | -0.8053*** (-3.59) | -2.5292** (-2.90) | -1.0486 (-1.44) |
| lngeog | 4.2142 | 2.3148 | 0.0000 | 5.8081 | 0.0630*** (3.81) | 0.1762*** (5.21) | 0.0207 (0.35) |
| lnprop | -0.5092 | 0.1480 | -0.8675 | -0.3172 | 0.6984** (2.43) | 2.3863** (2.41) | -1.1289 (-1.13) |
| 常数项 | 1.5600 | 0.4398 | 0.2305 | 0.7658 | -0.0020 (-0.01) | 0.5925 (0.77) | -0.3867 (-0.78) |
| R2 | — | — | — | — | 0.9690 | 0.9195 | 0.9041 |
| [1] |
|
| [2] |
梁志会, 张露, 刘勇, 等. 农业分工有利于化肥减量施用吗? 基于江汉平原水稻种植户的实证. 中国人口·资源与环境, 2020,30(1):150-159.
[
|
| [3] |
|
| [4] |
|
| [5] |
王祖力, 肖海峰. 化肥施用对粮食产量增长的作用分析. 农业经济问题, 2008, (8):65-68.
[
|
| [6] |
庄国泰. 我国土壤污染现状与防控策略. 中国科学院院刊, 2015,30(4):477-483.
[
|
| [7] |
|
| [8] |
卢良恕. 新时期我国农业结构战略性调整与食物安全. 中国食物与营养, 2002, (4):1-4.
[
|
| [9] |
祝捷, 谢源澔. 中国食品安全综合评价: 2008—2013. 宏观质量研究, 2015,3(2):99-111.
[
|
| [10] |
|
| [11] |
胡岳岷, 刘元胜. 中国粮食安全: 价值维度与战略选择. 经济学家, 2013, (5):50-56.
[
|
| [12] |
崔明明, 聂常虹. 基于指标评价体系的我国粮食安全演变研究. 中国科学院院刊, 2019,34(8):910-919.
[
|
| [13] |
张蓓, 马如秋, 刘凯明. 新中国成立70周年食品安全演进、特征与愿景. 华南农业大学学报: 社会科学版, 2020,19(1):88-102.
[
|
| [14] |
李国景, 陈永福, 焦月, 等. 中国食物自给状况与保障需求策略分析. 农业经济问题, 2019, (6):94-104.
[
|
| [15] |
FAO, IFAD, WFP. The state of food insecurity in the world 2015: Meeting the 2015 international hunger targets: Taking stock of uneven progress. Rome, Italy: FAO, 2015.
|
| [16] |
罗其友, 米健, 高明杰. 中国粮食中长期消费需求预测研究. 中国农业资源与区划, 2014,35(5):1-7.
[
|
| [17] |
杨明智, 裴源生, 李旭东. 中国粮食自给率研究: 粮食、谷物和口粮自给率分析. 自然资源学报, 2019,34(4):881-889.
[
|
| [18] |
姚成胜, 李政通, 黄琳. 20世纪90年代以来河南省食物资源安全状况评价. 干旱区资源与环境, 2015,29(6):25-31.
[
|
| [19] |
|
| [20] |
|
| [21] |
|
| [22] |
|
| [23] |
许庆, 陆钰凤, 张恒春. 农业支持保护补贴促进规模农户种粮了吗? 基于全国农村固定观察点调查数据的分析. 中国农村经济, 2020, (4):15-33.
[
|
| [24] |
李兆亮, 罗小锋, 张俊飚, 等. 农业R&D投入、空间溢出与中国农业经济增长. 科研管理, 2020,41(9):268-277.
[
|
| [25] |
杨建辉. 农业化学投入与农业经济增长脱钩关系研究: 基于华东6省1市数据. 自然资源学报, 2017,32(9):1517-1527.
[
|
| [26] |
栾江, 马瑞, 李浩, 等. 1998—2013年中国主要农作物化肥消费的脱钩分析. 农林经济管理学报, 2015,14(5):460-466.
[
|
| [27] |
薛超, 史雪阳, 周宏. 农业机械化对种植业全要素生产率提升的影响路径研究. 农业技术经济. 2020, (10):87-102.
[
|
/
| 〈 |
|
〉 |