
产业转型升级与绿色全要素生产率提升的互动关系——基于中国116个地级资源型城市的实证研究
|
李博(1981- ),男,天津人,博士,副教授,博士生导师,主要从事城市与区域经济研究。E-mail: mg2011818@126.com |
收稿日期: 2021-01-31
要求修回日期: 2021-03-25
网络出版日期: 2022-03-28
基金资助
国家社会科学基金项目(18BJY061)
版权
Interaction mechanism between industrial transformation and upgrading and green total factor productivity improvement: An empirical study based on 116 China's prefecture-level resource-based cities
Received date: 2021-01-31
Request revised date: 2021-03-25
Online published: 2022-03-28
Copyright
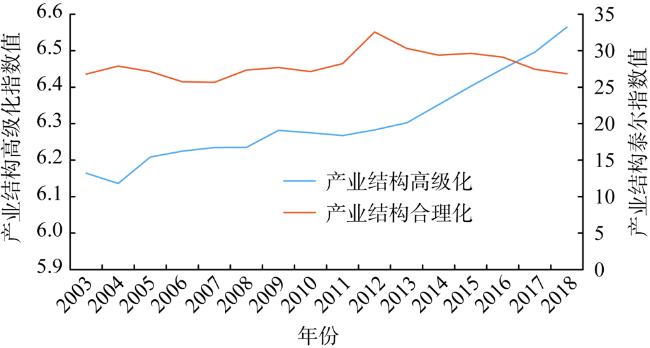
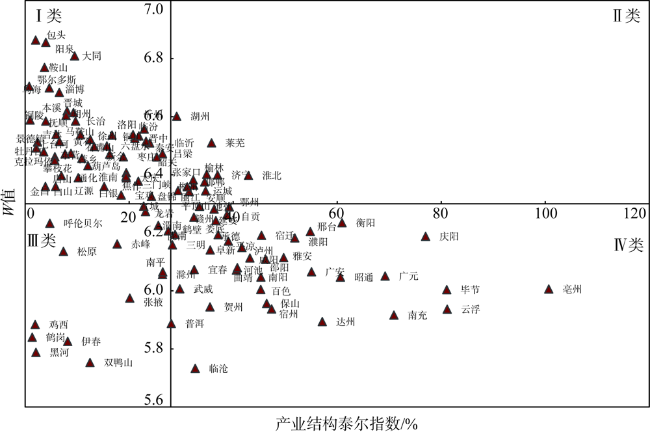
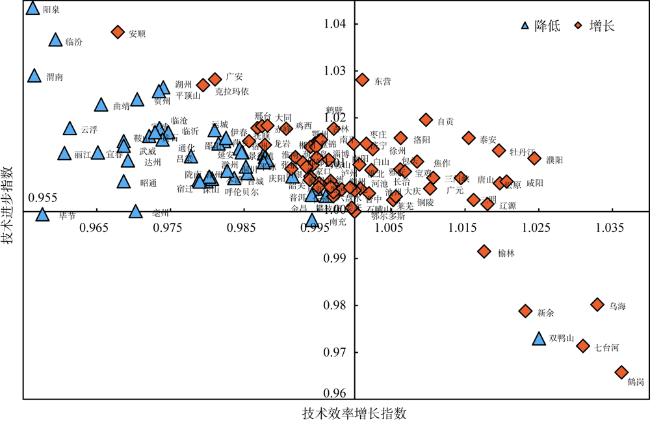
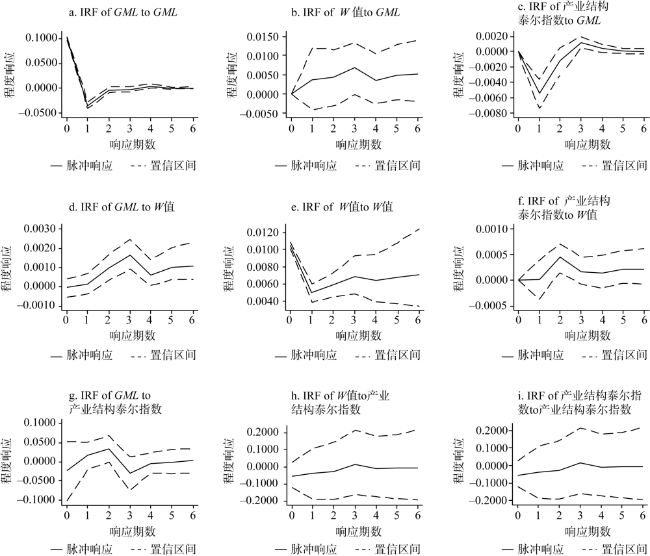
促进产业转型升级,提升绿色全要素生产率是推进我国资源型城市高质量发展的关键。但是,产业转型升级能否提升绿色全要素生产率在学术界一直存在争论。以2003— 2018年中国116个地级资源型城市为对象,分析了产业转型升级与绿色全要素生产率提升的演化特征和互动关系。结果表明:(1)56.9%的资源型城市产业转型升级并不理想,处于产业结构高级化和合理化不同步或双低的状态;有57.8%的资源型城市绿色全要素生产率实现了正增长,但仍有一些资源型城市绿色全要素生产率增长缓慢,主要是因为技术效率未得到有效改善。(2)PVAR模型和脉冲响应估计结果表明,资源型城市绿色全要素生产率提升的滞后期对其自身的影响存在负向作用。同时,资源型城市长期的传导路径为绿色全要素生产率提升受到反映产业结构合理化的泰尔指数的负向冲击后,对产业结构高级化产生持续性的积极作用,之后,产业结构高级化不断对自身产生正向冲击作用。(3)通过方差分解预测可知,未来绿色全要素生产率提升、产业结构高级化与合理化仍主要依赖自身发展路径。产业结构高级化对绿色全要素生产率提升的解释力高于产业结构合理化的解释力。随着期数的增加,产业结构高级化与绿色全要素生产率提升的相互解释力逐渐上升。
李博 , 秦欢 , 孙威 . 产业转型升级与绿色全要素生产率提升的互动关系——基于中国116个地级资源型城市的实证研究[J]. 自然资源学报, 2022 , 37(1) : 186 -199 . DOI: 10.31497/zrzyxb.20220113
Advancing industrial transformation and upgrading and improving green total factor productivity are the key to promoting the high-quality development of resource-based cities in China. However, whether industrial transformation and upgrading can improve green total factor productivity has been controversial in academic circles. Focusing on 116 prefecture-level resource-based cities in China from 2003 to 2018, this paper analyzes the evolutionary characteristics and interactive relationship between industrial transformation and upgrading and green total factor productivity improvement. The results are as follows: (1) 56.9% of resource-based cities have implemented unsatisfactory industrial transformation and upgrading, and are in unbalanced state or double-low state between advanced and industrial structure rationalizations; 57.8% of resource-based cities have achieved positive growth in green total factor productivity, but the average annual growth rates of green total factor productivity in some resource-based cities increased slowly due to unimproved technological inefficiency. (2) The estimation results of PVAR model and impulse response show that there exists a time lag in the negative impact of green total factor productivity improvement on itself. At the same time, the long-term impact transmission mechanism is that after receiving the negative impact from the Theil index, an indicator to reflect industrial structure rationalization, the green total factor productivity improvement has a continuous positive effect on the industrial structure advancement. Then industrial structure advancement continuously imposes a positive effect on itself. (3) According to the analysis of variance decomposition forecast, green total factor productivity improvement, as well as industrial structure advancement and rationalization are mainly dependent on their own development paths. It can be seen that the explanatory power of the industrial structure advancement for green total factor productivity improvement is higher than that of the industrial structure rationalization. With the increase of periods, the mutual explanatory powers of both industrial structure advancement and green total factor productivity improvement gradually increase.
表1 资源型城市绿色全要素生产率提升的投入产出指标选取Table 1 Selection of input-output indicators for green total factor productivity in resource-based cities |
| 一级指标 | 二级指标 | 具体数据 |
|---|---|---|
| 投入 | 资本要素 | 固定资本存量 |
| 劳动力要素 | 年末单位从业人员 | |
| 能源要素 | 全社会用电量 | |
| 产出 | 期望产出 | 地区生产总值 |
| 非期望产出 | 工业SO2排放量 | |
| 工业烟尘排放量 | ||
| 工业废水排放量 |
表2 2003—2018年资源型城市绿色全要素生产率GML指数Table 2 GML index of green total factor productivity of resource-based cities in 2003-2018 |
| 排名 | 城市 | GML | 排名 | 城市 | GML | 排名 | 城市 | GML | 排名 | 城市 | GML |
|---|---|---|---|---|---|---|---|---|---|---|---|
| 1 | 濮阳 | 1.0361 | 30 | 盘锦 | 1.0085 | 59 | 攀枝花 | 1.0013 | 88 | 铜川 | 0.9947 |
| 2 | 牡丹江 | 1.0329 | 31 | 鸡西 | 1.0082 | 60 | 阜新 | 1.0012 | 89 | 临汾 | 0.9946 |
| 3 | 泰安 | 1.0315 | 32 | 南平 | 1.0077 | 61 | 鹤岗 | 1.0008 | 90 | 贺州 | 0.9937 |
| 4 | 自贡 | 1.0295 | 32 | 莱芜 | 1.0077 | 62 | 衡阳 | 1.0006 | 91 | 平凉 | 0.9936 |
| 5 | 东营 | 1.0292 | 34 | 南阳 | 1.0075 | 63 | 抚顺 | 1.0005 | 92 | 南充 | 0.9925 |
| 6 | 咸阳 | 1.0272 | 35 | 淄博 | 1.0063 | 63 | 白银 | 1.0005 | 93 | 滁州 | 0.9913 |
| 7 | 松原 | 1.0259 | 35 | 邢台 | 1.0063 | 65 | 石嘴山 | 1.0004 | 94 | 临沂 | 0.9912 |
| 8 | 洛阳 | 1.0220 | 37 | 晋中 | 1.0059 | 65 | 娄底 | 1.0004 | 95 | 临沧 | 0.9908 |
| 9 | 唐山 | 1.0217 | 38 | 克拉玛依 | 1.0058 | 67 | 忻州 | 1.0002 | 96 | 本溪 | 0.9907 |
| 10 | 辽源 | 1.0197 | 39 | 池州 | 1.0057 | 68 | 鄂尔多斯 | 1.0000 | 97 | 宣城 | 0.9894 |
| 11 | 焦作 | 1.0193 | 40 | 大同 | 1.0055 | 68 | 淮南 | 1.0000 | 98 | 吕梁 | 0.9893 |
| 12 | 三明 | 1.0187 | 41 | 安顺 | 1.0049 | 70 | 湖州 | 0.9999 | 99 | 通化 | 0.9889 |
| 13 | 三门峡 | 1.0180 | 42 | 淮北 | 1.0045 | 71 | 金昌 | 0.9996 | 100 | 黄石 | 0.9878 |
| 14 | 枣庄 | 1.0161 | 42 | 大庆 | 1.0045 | 72 | 六盘水 | 0.9995 | 101 | 曲靖 | 0.9877 |
| 15 | 徐州 | 1.0158 | 44 | 赤峰 | 1.0044 | 73 | 晋城 | 0.9993 | 102 | 呼伦贝尔 | 0.9876 |
| 16 | 宝鸡 | 1.0155 | 45 | 马鞍山 | 1.0042 | 74 | 庆阳 | 0.9990 | 103 | 赣州 | 0.9875 |
| 17 | 包头 | 1.0153 | 46 | 葫芦岛 | 1.0035 | 74 | 韶关 | 0.9990 | 104 | 保山 | 0.9862 |
| 18 | 广元 | 1.0152 | 47 | 邯郸 | 1.0034 | 76 | 平顶山 | 0.9984 | 105 | 陇南 | 0.9854 |
| 19 | 鹤壁 | 1.0148 | 48 | 朔州 | 1.0033 | 77 | 张掖 | 0.9981 | 106 | 宿迁 | 0.9853 |
| 20 | 济宁 | 1.0144 | 49 | 泸州 | 1.0031 | 77 | 运城 | 0.9981 | 107 | 渭南 | 0.9843 |
| 21 | 乌海 | 1.0125 | 50 | 黑河 | 1.0030 | 79 | 伊春 | 0.9980 | 108 | 鞍山 | 0.9832 |
| 22 | 雅安 | 1.0112 | 51 | 张家口 | 1.0029 | 80 | 阳泉 | 0.9979 | 109 | 武威 | 0.9823 |
| 23 | 吉林 | 1.0107 | 52 | 百色 | 1.0027 | 81 | 普洱 | 0.9977 | 110 | 达州 | 0.9798 |
| 23 | 白山 | 1.0107 | 53 | 长治 | 1.0020 | 81 | 宿州 | 0.9977 | 111 | 云浮 | 0.9785 |
| 25 | 鄂州 | 1.0103 | 54 | 河池 | 1.0019 | 83 | 双鸭山 | 0.9973 | 112 | 宜春 | 0.9773 |
| 26 | 郴州 | 1.0091 | 54 | 龙岩 | 1.0019 | 83 | 景德镇 | 0.9973 | 113 | 昭通 | 0.9749 |
| 27 | 榆林 | 1.0090 | 56 | 新余 | 1.0015 | 85 | 延安 | 0.9971 | 114 | 丽江 | 0.9726 |
| 28 | 铜陵 | 1.0088 | 56 | 七台河 | 1.0015 | 86 | 萍乡 | 0.9970 | 115 | 亳州 | 0.9704 |
| 29 | 广安 | 1.0087 | 58 | 承德 | 1.0014 | 87 | 邵阳 | 0.9958 | 116 | 毕节 | 0.9571 |
表3 面板数据的单位根检验Table 3 Unit root test of panel data |
| 单位根检验方法 | LLC | IPS |
|---|---|---|
| GML | -25.50*** | -23.30*** |
| W值 | -21.01*** | -16.22*** |
| 产业结构合理化 | -120.00*** | -120.00*** |
注:括号外为t值,***代表在1%的水平上拒绝原假设。 |
表4 三种信息准则测算结果Table 4 Test results of three information criteria |
| 滞后阶数 | 三种信息准则测算值 | ||
|---|---|---|---|
| AIC | BIC | HQIC | |
| 1 | -2.60 | -1.34 | -2.13 |
| 2 | -2.95 | -1.58 | -2.44 |
| 3 | -3.50* | -1.99* | -2.93* |
| 4 | -3.43 | -1.75 | -2.80 |
注:*代表最佳滞后期。 |
表5 基于面板向量自回归模型的GMM参数估计Table 5 GMM parametric estimation based on panel vector autoregressive model |
| 被解释变量 | h_GML | h_W值 | h_产业结构泰尔指数 |
|---|---|---|---|
| L.h_GML | -0.336*** | 0.002 | 0.184 |
| L.h_W值 | 0.329 | 0.469*** | -3.469 |
| L.h_产业结构泰尔指数 | -0.003*** | 0.000 | 0.014 |
| L2.h_GML | -0.141*** | 0.009*** | 0.398** |
| L2.h_W值 | 0.364 | 0.336*** | -1.159 |
| L2.h_产业结构泰尔指数 | -0.002*** | 0.000*** | -0.005 |
| L3.h_GML | -0.076** | 0.015*** | -0.110 |
| L3.h_W值 | 0.469** | 0.230*** | 3.595 |
| L3.h_产业结构泰尔指数 | 0.000*** | 0.000** | 0.000** |
注:*、**、***分别表示参数的估计值在 10%、5%、1%的统计水平上显著。 |
表6 方差分解结果Table 6 Variance decomposition results |
| 被解释变量 | s=5 | s=10 | |||||
|---|---|---|---|---|---|---|---|
| GML | W值 | 泰尔指数 | GML | W值 | 泰尔指数 | ||
| GML | 0.989 | 0.015 | 0.001 | 0.978 | 0.018 | 0.001 | |
| W值 | 0.008 | 0.984 | 0.002 | 0.020 | 0.981 | 0.002 | |
| 泰尔指数 | 0.003 | 0.001 | 0.997 | 0.003 | 0.001 | 0.997 | |
| [1] |
|
| [2] |
|
| [3] |
李平. 提升全要素生产率的路径及影响因素: 增长核算与前沿面分解视角的梳理分析. 管理世界, 2016, 32(9):1-11.
[
|
| [4] |
鲁志国, 赵培阳. 金融效率、产业结构升级与全要素生产率的动态关系及区域差异研究: 以广东省为例. 经济问题探索, 2020, 41(10):94-109.
[
|
| [5] |
曾国平, 彭艳, 曹跃群. 产业结构调整与全要素生产率增长实证分析. 重庆大学学报: 社会科学版, 2015, 21(6):77-85.
[
|
| [6] |
史丹, 李鹏, 许明. 产业结构转型升级与经济高质量发展. 福建论坛: 人文社会科学版, 2020, 40(9):108-118.
[
|
| [7] |
|
| [8] |
于斌斌. 产业结构调整与生产率提升的经济增长效应: 基于中国城市动态空间面板模型的分析. 中国工业经济, 2015, 32(12):83-98.
[
|
| [9] |
杨向阳, 潘妍, 童馨乐. 因地制宜:产业结构变迁与全要素生产率. 北京工商大学学报: 社会科学版, 2019, 34(2):104-115.
[
|
| [10] |
余泳泽, 刘冉, 杨晓章. 我国产业结构升级对全要素生产率的影响研究. 产经评论, 2016, 33(4):45-58.
[
|
| [11] |
李学兰, 王海元. 产业结构升级提升了城市生产率吗? 基于空间计量模型的实证检验. 云南财经大学学报, 2017, 33(2):140-150.
[
|
| [12] |
朱风慧, 刘立峰. 我国产业结构升级与经济高质量发展: 基于地级及以上城市经验数据. 云南财经大学学报, 2020, 36(6):42-53.
[
|
| [13] |
韩晶, 孙雅雯, 陈超凡, 等. 产业升级推动了中国城市绿色增长吗?. 北京师范大学学报: 社会科学版, 2019, 64(3):139-151.
[
|
| [14] |
柯善咨, 赵曜. 产业结构、城市规模与中国城市生产率. 经济研究, 2014, 60(4):76-88.
[
|
| [15] |
毛丰付, 潘加顺. 资本深化、产业结构与中国城市劳动生产率. 中国工业经济, 2012, 30(10):32-44.
[
|
| [16] |
孙学涛, 王振华, 张广胜. 全要素生产率提升中的结构红利及其空间溢出效应. 经济评论, 2018, 39(3):46-58.
[
|
| [17] |
范庆泉, 储成君, 高佳宁. 环境规制、产业结构升级对经济高质量发展的影响. 中国人口·资源与环境, 2020, 30(6):84-94.
[
|
| [18] |
林秀梅, 关帅. 环境规制推动了产业结构转型升级吗? 基于地方政府环境规制执行的策略互动视角. 南方经济, 2020, 38(11):99-115.
[
|
| [19] |
张国建, 胡玉梅, 艾永芳. 地方政府债务扩张会促进产业结构转型升级吗. 山西财经大学学报, 2020, 42(10):69-82.
[
|
| [20] |
付凌晖. 我国产业结构高级化与经济增长关系的实证研究. 统计研究, 2010, 27(8):79-81.
[
|
| [21] |
干春晖, 郑若谷, 余典范. 中国产业结构变迁对经济增长和波动的影响. 经济研究, 2011, 46(5):4-16, 31.
[
|
| [22] |
|
| [23] |
张军, 吴桂英, 张吉鹏. 中国省际物质资本存量估算: 1952—2000. 经济研究, 2004, 50(10):35-44.
[
|
| [24] |
陈伟, 吴群. 长三角地区城市建设用地经济效率及其影响因素. 经济地理, 2014, 34(9):142-149.
[
|
| [25] |
秦炳涛. 中国区域能源效率研究: 地级市的视角. 世界经济文汇, 2014, 58(1):95-104.
[
|
| [26] |
李博, 张文忠, 余建辉. 考虑环境约束的中国资源型城市全要素能源效率及其差异研究. 自然资源学报, 2016, 31(3):377-389.
[
|
| [27] |
|
| [28] |
连玉君. 中国上市公司投资效率研究. 北京: 经济管理出版社, 2009.
[
|
| [29] |
邵帅, 杨莉莉. 自然资源开发、内生技术进步与区域经济增长. 经济研究, 2011, 46(s2):112-123.
[
|
| [30] |
张馨, 牛叔文, 丁永霞, 等. 中国省域能源资源与经济增长关系的实证分析: 基于“资源诅咒”假说. 自然资源学报, 2010, 25(12):2040-2051.
[
|
| [31] |
斯日吉模楞, 毛培. 资源型地区自然资源对经济增长影响的实证分析: 基于2000—2016年中国重点煤炭城市样本. 自然资源学报, 2019, 34(12):2491-2503.
[
|
| [32] |
湛东升, 吴倩倩, 余建辉, 等. 中国资源型城市房价时空变化与影响因素分析. 自然资源学报, 2020, 35(12):2888-2900.
[
|
| [33] |
姜海宁, 张文忠, 余建辉, 等. 山西资源型城市创新环境与产业结构转型空间耦合. 自然资源学报, 2020, 35(2):269-283.
[
|
/
| 〈 |
|
〉 |