
基于InVEST和MCR模型的南方山地丘陵区生态保护红线优化
|
李怡(1998- ),女,江西吉安人,硕士,主要从事土地利用规划与评价等研究。E-mail: liyi5801@163.com |
收稿日期: 2020-05-06
要求修回日期: 2020-12-01
网络出版日期: 2022-01-28
基金资助
国家自然科学基金项目(41361049)
江西省赣鄱英才“555”领军人才项目(201295)
版权
Optimization of ecological red line in the hilly region of Southern China based on InVEST and MCR model
Received date: 2020-05-06
Request revised date: 2020-12-01
Online published: 2022-01-28
Copyright
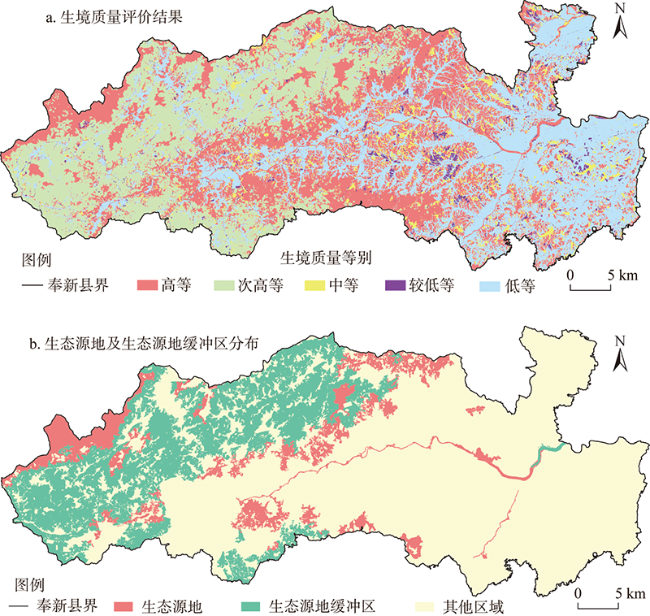
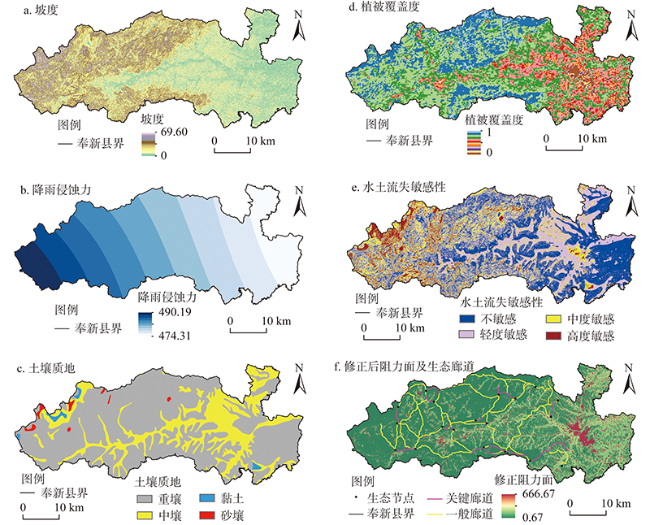
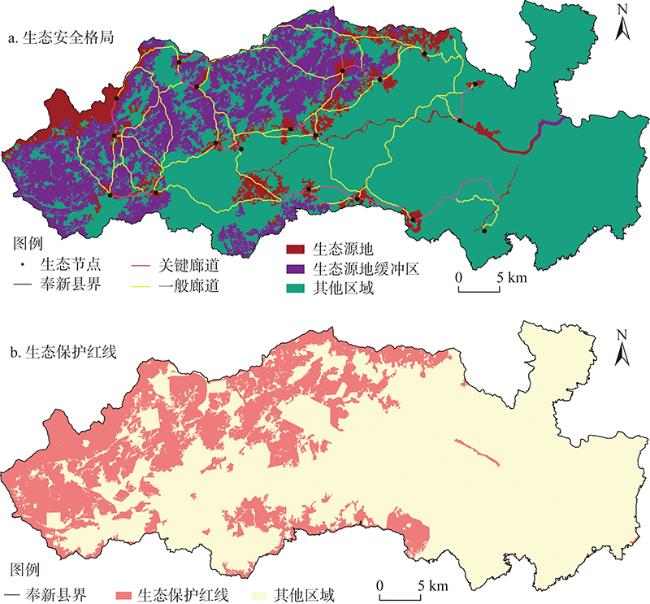
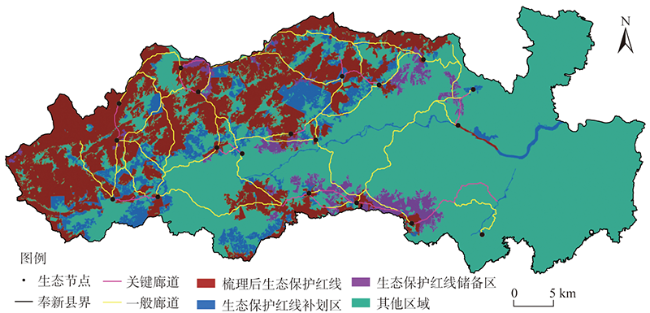
优化生态保护红线,是顺应新时代多规融合趋势、推进国土空间高效管理与生态文明建设的重要举措。以南方山地丘陵区典型县奉新县为例,基于InVEST模型进行生境质量评价以识别生态源地及其缓冲区,采用水土流失敏感性修正基本阻力面,运用MCR模型构建奉新县生态安全格局,定量衡量与定性分析相结合对生态安全格局进行有效性评价,继而提出奉新县生态保护红线优化方案。结果表明:(1)生态源地及生态源地缓冲区面积分别为144.42 km2、354.01 km2,分别占研究区总面积的8.76%与21.47%,并识别出19个生态节点;(2)识别出关键生态廊道76 km,一般生态廊道315 km,与生态节点、生态源地、生态源地缓冲区共同构成研究区生态安全格局,面积共498.43 km2,占奉新县总面积的30.23%,集中分布于研究区西部山地丘陵区;(3)经有效性评价证实生态安全格局较生态保护红线更具生态优化意义;(4)划定生态保护红线补划区与生态保护红线储备区,共为生态保护红线调整优化预留了199.34 km2的高质量后备资源,形成研究区生态保护红线优化方案。研究成果可为南方山地丘陵区生态保护红线的评估优化提供科学参考。
李怡 , 赵小敏 , 郭熙 , 周丙娟 , 黄心怡 , 易丹 , 丁徽 . 基于InVEST和MCR模型的南方山地丘陵区生态保护红线优化[J]. 自然资源学报, 2021 , 36(11) : 2980 -2994 . DOI: 10.31497/zrzyxb.20211119
Optimizing the ecological red line is an important measure to comply with the multi-regulation integration trend in the New Era and promote efficient management of land and space as well as the construction of ecological civilization. Fengxin, a typical county in the mountainous and hilly areas of southern China, was taken as the study area. Based on InVEST model, the study carried out habitat quality evaluation to identify ecological sources and ecological source buffer zones. The basic resistance surface was modified by the sensitivity of soil and water loss. The ecological security pattern of the study area was constructed by MCR model. The effectiveness of ecological security pattern was analyzed qualitatively and quantitatively, and then an optimization scheme for ecological red line was proposed. Results showed that: (1) The areas of the ecological sources and buffer zones were 144.42 km2 and 354.01 km2, respectively, accounting for 8.76% and 21.47% of the region's total area, and 19 ecological nodes were identified. (2) A total of 76 km key ecological corridors and 315 km general ecological corridors were identified, together with ecological nodes, ecological source areas, and ecological source buffer zones, thus the ecological security pattern of the study area was formed. The area of ecological security pattern was 498.43 km2, accounting for 30.23% of the total area, which was mainly distributed in the mountainous and hilly areas of Western Fengxin county. (3) The effectiveness evaluation confirms that the ecological security pattern is more ecologically optimized than the ecological protection red line. (4) The supplementary regions and reserve region of ecological red line were demarcated, and 199.34 km2 of high-quality reserve resources have been reserved for the adjustment and optimization of the ecological red line, which is an ecological red line optimization scheme for the study area. This study provides a reference case for the evaluation and optimization of the ecological red line in the mountainous and hilly region of Southern China.
表1 数据说明Table 1 Data description |
| 数据名称 | 数据格式 | 数据描述 |
|---|---|---|
| 土地利用数据 | 30 m×30 m栅格 | 解译2018年Landsat 8影像,参考张磊等[18]的研究并结合奉新县实际情况,将研究区土地覆被类型分为一级类6类、二级类17类 |
| 土壤质地数据 | 1 km×1 km栅格 | 采用卡庆斯基土壤质地分类制 |
| DEM数据 | 30 m×30 m栅格 | 来自GDEMDEM 数据产品,用于坡度提取 |
| 降水数据 | 文本数据 | 选取奉新县及其周边县共7个气象站点的降雨数据,采用协同克里金插值方法计算年均降雨量 |
| NDVI数据 | 250 m×250 m栅格 | 选取2018年6-9月的MOD13Q1 NDVI数据产品,计算月均值得到 |
| 生态保护红线评估优化系列数据 | 矢量数据 | 包括奉新县行政区划、永久基本农田、人工商品林、探矿权、采矿权、城市总体规划、土地利用总体规划、自然保护地、生态保护红线等矢量数据 |
表2 各生境类型对威胁因子的敏感性Table 2 Sensitivity of different habitat types to threat factors |
| 生境类型 | 生境得分值 | 威胁因子 | |||||
|---|---|---|---|---|---|---|---|
| 耕地 | 工矿用地 | 城镇住宅 | 农村居民点 | 主要公路 | 其他道路 | ||
| 水田 | 0.4 | 0.3 | 0.5 | 0.5 | 0.4 | 0.4 | 0.3 |
| 旱地 | 0.3 | 0.2 | 0.4 | 0.5 | 0.3 | 0.3 | 0.2 |
| 灌木园地 | 0.6 | 0.4 | 0.6 | 0.5 | 0.4 | 0.4 | 0.3 |
| 乔木林地 | 1.0 | 0.8 | 0.8 | 0.9 | 0.7 | 0.8 | 0.6 |
| 竹林地 | 0.9 | 0.7 | 0.7 | 0.8 | 0.7 | 0.7 | 0.5 |
| 灌木林地 | 0.6 | 0.6 | 0.7 | 0.7 | 0.6 | 0.5 | 0.4 |
| 其他林地 | 0.7 | 0.8 | 0.7 | 0.8 | 0.6 | 0.6 | 0.5 |
| 草丛 | 0.5 | 0.6 | 0.5 | 0.6 | 0.5 | 0.4 | 0.2 |
| 河流 | 1.0 | 0.7 | 0.9 | 0.9 | 0.8 | 0.6 | 0.4 |
| 水库 | 0.8 | 0.7 | 0.8 | 0.8 | 0.7 | 0.5 | 0.3 |
| 坑塘 | 0.7 | 0.7 | 0.6 | 0.7 | 0.7 | 0.4 | 0.3 |
| 水渠 | 0.6 | 0.2 | 0.3 | 0.4 | 0.5 | 0.3 | 0.2 |
表3 威胁因子参数Table 3 Parameters for threat factors |
| 威胁因子 | 最大影响距离/km | 权重 | 衰减类型 |
|---|---|---|---|
| 耕地 | 0.5 | 0.4 | 指数 |
| 工矿用地 | 5 | 0.8 | 指数 |
| 城镇住宅 | 6 | 1.0 | 指数 |
| 农村居民点 | 4 | 0.6 | 指数 |
| 主要公路 | 3 | 1.0 | 线性 |
| 其他道路 | 1 | 0.6 | 线性 |
表4 基本阻力系数Table 4 Basic resistance coefficients |
| 地类 | 乔木林地 | 竹林地 | 其他林地 | 灌木林地 | 灌木园地 | 草丛 | 湿地 | 耕地 | 其他用地 | 人工表面 |
|---|---|---|---|---|---|---|---|---|---|---|
| 阻力系数 | 1 | 3 | 5 | 10 | 20 | 30 | 50 | 100 | 300 | 500 |
表5 水土流失敏感性评价指标体系Table 5 Index system of soil and water loss evaluation |
| 分级 | 分级赋值 | 坡度/(°) | 降雨侵蚀力/(J·cm/m2·h) | 土壤质地 | 植被覆盖度/% |
|---|---|---|---|---|---|
| 不敏感 | 1 | [0, 8] | [0, 25] | 重壤 | (80, 100],0(指建设用地和水域) |
| 轻度敏感 | 2 | (8, 15] | (25, 100] | 中壤 | (50, 80] |
| 中度敏感 | 3 | (15, 25] | (100, 400] | 黏土 | (20, 50] |
| 高度敏感 | 4 | 25以上 | 400以上 | 砂壤 | (0, 20] |
表6 成果对比Table 6 Comparison between results |
| 对比类型 | 总面积/km2 | 斑块数量/个 | 占县域总面积比例/% | 与自然保护地重合率/% | 各斑块PC指数均值 | 各斑块dI指数均值 |
|---|---|---|---|---|---|---|
| 生态保护红线 | 455.86 | 61 | 27.65 | 51.93 | 0.17 | 0.21 |
| 生态安全格局 | 498.43 | 14 | 30.23 | 89.31 | 0.40 | 0.69 |
| [1] |
张天勇, 季海波. 70年来生态文明中国道路的演进历程及其历史经验. 理论探讨, 2019, (6):11-16.
[
|
| [2] |
张雪飞, 王传胜, 李萌. 国土空间规划中生态空间和生态保护红线的划定. 地理研究, 2019, 38(10):2430-2446.
[
|
| [3] |
高吉喜, 徐德琳, 乔青, 等. 自然生态空间格局构建与规划理论研究. 生态学报, 2020, 40(3):749-755.
[
|
| [4] |
傅丽华, 莫振淳, 彭耀辉, 等. 湖南茶陵县域生态空间网络稳定性识别与重构策略. 地理学报, 2019, 74(7):1409-1419.
[
|
| [5] |
王成新, 万军, 于雷, 等. 基于生态网络格局的城市生态保护红线优化研究: 以青岛市为例. 中国人口·资源与环境, 2017, 27(s1):9-14.
[
|
| [6] |
傅强, 顾朝林. 基于生态网络的生态安全格局评价. 应用生态学报, 2017, 28(3):1021-1029.
[
|
| [7] |
刘洋, 蒙吉军, 朱利凯. 区域生态安全格局研究进展. 生态学报, 2010, 30(24):6980-6989.
[
|
| [8] |
韩宗伟, 焦胜, 胡亮, 等. 廊道与源地协调的国土空间生态安全格局构建. 自然资源学报, 2019, 34(10):2244-2256.
[
|
| [9] |
彭建, 赵会娟, 刘焱序, 等. 区域生态安全格局构建研究进展与展望. 地理研究, 2017, 36(3):407-419.
[
|
| [10] |
陈星, 周成虎. 生态安全: 国内外研究综述. 地理科学进展, 2005, 24(6):8-20.
[
|
| [11] |
余珮珩, 冯明雪, 刘斌, 等. 顾及生态安全格局的流域生态保护红线划定及管控研究: 以云南杞麓湖流域为例. 湖泊科学, 2020, 32(1):89-99.
[
|
| [12] |
方莹, 王静, 黄隆杨, 等. 基于生态安全格局的国土空间生态保护修复关键区域诊断与识别: 以烟台市为例. 自然资源学报, 2020, 35(1):190-203.
[
|
| [13] |
杜腾飞, 齐伟, 朱西存, 等. 基于生态安全格局的山地丘陵区自然资源空间精准识别与管制方法. 自然资源学报, 2020, 35(5):1190-1200.
[
|
| [14] |
杨天荣, 匡文慧, 刘卫东, 等. 基于生态安全格局的关中城市群生态空间结构优化布局. 地理研究, 2017, 36(3):441-452.
[
|
| [15] |
徐文彬, 尹海伟, 孔繁花. 基于生态安全格局的南京都市区生态控制边界划定. 生态学报, 2017, 37(12):4019-4028.
[
|
| [16] |
|
| [17] |
王治国, 张超, 孙保平, 等. 全国水土保持区划概述. 中国水土保持, 2015, (12):12-17.
[
|
| [18] |
张磊, 吴炳方, 李晓松, 等. 基于碳收支的中国土地覆被分类系统. 生态学报, 2014, 34(24):7158-7166.
[
|
| [19] |
吴健生, 张理卿, 彭建, 等. 深圳市景观生态安全格局源地综合识别. 生态学报, 2013, 33(13):4125-4133.
[
|
| [20] |
|
| [21] |
|
| [22] |
褚琳, 张欣然, 王天巍, 等. 基于CA-Markov和InVEST模型的城市景观格局与生境质量时空演变及预测. 应用生态学报, 2018, 29(12):4106-4118.
[
|
| [23] |
刘园, 周勇, 杜越天. 基于InVEST模型的长江中游经济带生境质量的时空分异特征及其地形梯度效应. 长江流域资源与环境, 2019, 28(10):2429-2440.
[
|
| [24] |
钟莉娜, 王军. 基于InVEST模型评估土地整治对生境质量的影响. 农业工程学报, 2017, 33(1):250-255.
[
|
| [25] |
郝月, 张娜, 杜亚娟, 等. 基于生境质量的唐县生态安全格局构建. 应用生态学报, 2019, 30(3):1015-1024.
[
|
| [26] |
余蓉, 项文化, 宁晨, 等. 长沙市4种人工林生态系统碳储量与分布特征. 生态学报, 2016, 36(12):3499-3509.
[
|
| [27] |
彭建, 郭小楠, 胡熠娜, 等. 基于地质灾害敏感性的山地生态安全格局构建: 以云南省玉溪市为例. 应用生态学报, 2017, 28(2):627-635.
[
|
| [28] |
张玉虎, 李义禄, 贾海峰. 永定河流域门头沟区景观生态安全格局评价. 干旱区地理, 2013, 36(6):1049-1057.
[
|
| [29] |
张豆, 渠丽萍, 张桀滈. 基于生态供需视角的生态安全格局构建与优化: 以长三角地区为例. 生态学报, 2019, 39(20):7525-7537.
[
|
| [30] |
史志华, 杨洁, 李忠武, 等. 南方红壤低山丘陵区水土流失综合治理. 水土保持学报, 2018, 32(1):6-9.
[
|
| [31] |
李建军, 苏志珠, 王言荣. 基于GIS的万荣县生态敏感性评价与区划. 中国农业资源与区划, 2014, 35(5):48-54.
[
|
| [32] |
李益敏, 管成文, 朱军. 基于GIS的星云湖流域生态敏感性评价. 水土保持研究, 2017, 24(5):266-271.
[
|
| [33] |
朱强, 俞孔坚, 李迪华. 景观规划中的生态廊道宽度. 生态学报, 2005, 25(9):2406-2412.
[
|
| [34] |
|
| [35] |
朱敏, 谢跟踪, 邱彭华. 海口市生态用地变化与安全格局构建. 生态学报, 2018, 38(9):3281-3290.
[
|
| [36] |
黄木易, 岳文泽, 冯少茹, 等. 基于MCR模型的大别山核心区生态安全格局异质性及优化. 自然资源学报, 2019, 34(4):771-784.
[
|
| [37] |
|
| [38] |
蒙吉军, 王雅, 王晓东, 等. 基于最小累积阻力模型的贵阳市景观生态安全格局构建. 长江流域资源与环境, 2016, 25(7):1052-1061.
[
|
| [39] |
|
| [40] |
洪燕真, 戴永务. 福建省重点生态区位商品林赎买改革优化策略研究. 林业经济, 2019, 41(1):92-97.
[
|
/
| 〈 |
|
〉 |
