
养殖户气候适应性行为对提高养殖业生产效率的影响
|
龚已迅(1996- ),男,重庆永川人,硕士,研究方向为农业经济学。E-mail: 380214690@qq.com |
收稿日期: 2020-02-21
要求修回日期: 2020-05-27
网络出版日期: 2022-01-28
基金资助
国家社会科学基金项目(16CGL036)
重庆市教育委员会人文社会科学研究重点项目(18SKSJ003)
版权
The effect of farmer adaptation behavior to climate change on the improvement of breeding industry production efficiency
Received date: 2020-02-21
Request revised date: 2020-05-27
Online published: 2022-01-28
Copyright
气候变化给当前中国农业生产转型带来严峻挑战,从效率视角分析农户适应气候变化行为具有重要意义。本文探讨养殖户气候适应性行为与养殖业生产效率之间的逻辑关系,并基于中国五省的微观调查数据,采用倾向得分匹配方法与选择纠偏随机前沿生产函数模型(Selectivity-corrected Stochastic Production Frontier model)相结合的实证思路,分析养殖户气候适应性行为对养殖业生产效率的影响。研究表明:(1)养殖户气候适应性行为能够提高养殖业生产效率,纠正可观测因素与不可观测因素造成的选择性偏差后,适应组养殖户平均养殖业生产效率为0.618,未适应组养殖户的平均养殖业生产效率为0.551。(2)若未考虑选择性偏差,养殖户适应性行为对养殖业生产效率的影响将会错估。研究成果可为推进政府制定农户适应气候变化政策与推动农业生产转型提供有力支持。
关键词: 气候变化; 农户气候适应性行为; 生产效率; 选择纠偏随机生产前沿函数
龚已迅 , 杨丹 . 养殖户气候适应性行为对提高养殖业生产效率的影响[J]. 自然资源学报, 2021 , 36(11) : 2966 -2979 . DOI: 10.31497/zrzyxb.20211118
The transformation of agricultural production in China is challenged by severe climate change. Therefore, it is significant to discuss the effectiveness of adaptation behavior to climate change of rural households from the perspective of production efficiency. In this paper, first, the logical relationship between the breeder's adaptation behavior to climate change and the breeding industry production efficiency was taken into a discussion on a theoretical level. And then, on the basis of evidence retrieved from the micro-survey on breeders in five provinces of China, the empirical research method that combines the propensity score matching model and selectivity-corrected stochastic production frontier model was adopted to analyze and figure out the impact of breeder's adaptation behavior to climate change on breeding industry production efficiency. The research results show that: (1) The breeding industry production efficiency can be significantly improved by breeder's adaptation behavior to climate change. After the selection basis resulted from the observable factors and unobservable factors were corrected, the average breeding industry production efficiency of the adaptation group was 0.618 while, at the same time, the average breeding industry production efficiency of the non-adaptation group was 0.551. (2) If the selection bias was not taken into consideration, mistakes would occur in the course of the evaluation on the impact of the breeder's adaptation behavior to climate change on breeding industry production efficiency. Hence, this paper provides strong support for the government to formulate the policy for breeders, that is, influencing their adaptation behavior to climate change in the face of severe climate change and to push forward the transformation of agricultural production.
表1 变量定义与描述性分析Table 1 Variable definition and descriptive analysis |
| 变量名称 | 变量描述 | 适应组 | 未适应组 | 均值差异 | |
|---|---|---|---|---|---|
| 均值 | 均值 | ||||
| 一阶段倾向得分匹配 | |||||
| 因变量: | |||||
| 养殖户气候适应性行为决策 | 养殖户采纳防寒设备和防暑设备为1, 否则为0 | 1 | 0 | 1*** | |
| 自变量: | |||||
| 户主特征 | |||||
| 年龄 | 户主年龄/岁 | 43.470 | 47.176 | -3.706*** | |
| 受教育程度 | 小学及以下=1;初中=2;高中或中专=3;大专及以上=4 | 1.945 | 1.839 | 0.106* | |
| 养殖经验 | 养猪年限/年 | 7.098 | 8.701 | -1.604*** | |
| 风险偏好 | 风险偏好型=1;风险中性=2;风险规避型=3 | 1.940 | 2.249 | -0.309*** | |
| 家庭特征 | |||||
| 家庭人口数 | 农户家庭人口总数/人 | 4.705 | 4.306 | 0.399*** | |
| 纵向合作 | 农户同下游企业、合作社等产业组织合作为1,否则为0 | 0.380 | 0.212 | 0.168*** | |
| 风险特征 | |||||
| 病死率 | 生猪病死率/% | 0.020 | 0.015 | 0.005*** | |
| 天气致死 | 存在因为天气因素导致的生猪病死为1,否则为0 | 0.535 | 0.332 | 0.203*** | |
| 二阶段选择纠偏随机前沿函数 | |||||
| 因变量: | |||||
| 育肥猪总产值 | 家庭育肥猪总收入对数/元 | 12.251 | 9.847 | 2.404*** | |
| 自变量: | |||||
| 仔畜费用 | 育肥过程中投入的仔猪费用对数/元 | 8.814 | 4.947 | 3.868*** | |
| 饲料费用 | 育肥过程中生猪饲养所需饲料费用对数/元 | 11.665 | 9.051 | 2.614*** | |
| 水电费用 | 育肥过程中水、电费用对数/元 | 7.121 | 5.166 | 1.955*** | |
| 医疗防疫费用 | 育肥过程中生猪医疗防疫费用对数/元 | 8.342 | 6.649 | 1.693*** | |
| 维修管理费用 | 育肥过程中所需机械的维修管理费用对数/元 | 5.814 | 2.105 | 3.709*** | |
| 养殖人数 | 家庭从事养殖人数与雇工人数总和对数/个 | 1.107 | 1.030 | 0.076*** | |
| 养殖面积 | 养殖面积对数/亩 | 1.010 | 0.441 | 0.570*** | |
| 养殖房屋与机械费用 | 猪舍、养殖设备与机械费用总和对数/元 | 12.110 | 9.477 | 2.633*** | |
| 样本量/个 | 200 | 539 | |||
注:*、***分别表示在10%、1%的水平上显著,下同。 |
表2 一阶段Probit模型回归结果Table 2 Regression results of probit model in the first stage |
| 变量 | 系数 | 标准误 |
|---|---|---|
| 户主特征 | ||
| 年龄 | -0.017*** | 0.006 |
| 受教育程度 | -0.013 | 0.075 |
| 养殖经验 | -0.027*** | 0.011 |
| 风险偏好 | -0.355*** | 0.083 |
| 家庭特征 | ||
| 家庭总人口数 | 0.144*** | 0.040 |
| 纵向合作 | 0.445*** | 0.116 |
| 风险特征 | ||
| 天气致死 | 0.406*** | 0.107 |
| 生猪病死率 | 9.048*** | 3.479 |
| Log likelihood | -375.794 | |
| Pseudo R2 | 0.129 | |
| 样本量/个 | 739 | |
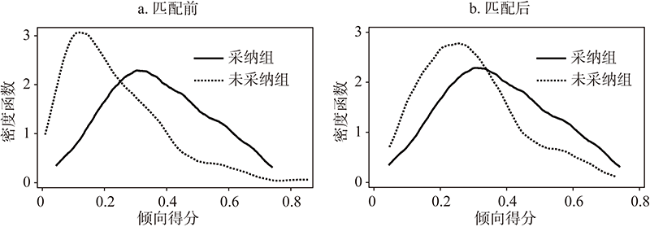
图1 匹配前后倾向得分的核密度分布Fig. 1 Distribution of kernel density of propensity scores before and after matching |
表3 倾向得分匹配后的数据平衡性检验Table 3 Balance test of propensity score matching |
| 变量 | 偏误/% | t值 |
|---|---|---|
| 户主特征 | ||
| 年龄 | -3.6 | -0.36 |
| 受教育程度 | -3.9 | -0.39 |
| 养殖经验 | 4.4 | 0.49 |
| 风险偏好 | -3.8 | -0.40 |
| 家庭特征 | ||
| 家庭总人口数 | -4.9 | -0.50 |
| 纵向合作 | 2.9 | 0.27 |
| 风险特征 | ||
| 天气致死 | -4.6 | -0.45 |
| 生猪病死率 | 3.9 | 0.39 |
表4 基于全样本的随机前沿函数模型与选择纠偏随机前沿函数模型的最大似然估计结果Table 4 Parameter estimates for the conventional and sample selection SPF models: full sample |
| 变量 | 随机前沿函数 | 选择纠偏随机前沿函数 | ||||
|---|---|---|---|---|---|---|
| 全体组 | 适应组 | 未适应组 | 适应组 | 未适应组 | ||
| 仔畜费 | 0.182** | 0.020 | 0.026*** | 0.022*** | 0.019*** | |
| (0.007) | (0.014) | (0.009) | (0.007) | (0.007) | ||
| 饲料费 | 0.335*** | 0.106* | 0.411*** | 0.349*** | 0.344*** | |
| (0.029) | (0.057) | (0.035) | (0.025) | (0.025) | ||
| 水电费 | -0.084** | 0.085 | -0.110*** | -0.094*** | -0.068** | |
| (0.028) | (0.068) | (0.042) | (0.033) | (0.031) | ||
| 医疗防疫费 | 0.190*** | 0.356*** | 0.117*** | 0.192*** | 0.194*** | |
| (0.036) | (0.065) | (0.046) | (0.040) | (0.038) | ||
| 养猪人数 | 0.321*** | 0.572*** | 0.321** | 0.077*** | 0.073*** | |
| (0.114) | (0.222) | (0.142) | (0.012) | (0.011) | ||
| 机械与房屋费用 | 0.102*** | 0.009 | 0.105*** | 0.270** | 0.237* | |
| (0.027) | (0.069) | (0.029) | (0.130) | (0.118) | ||
| 维修管理费 | 0.052*** | 0.565** | 0.034*** | 0.089*** | 0.085*** | |
| (0.011) | (0.023) | (0.013) | (0.023) | (0.022) | ||
| 猪舍面积 | 0.475*** | 0.397*** | 0.516*** | 0.499*** | 0.459*** | |
| (0.081) | (0.147) | (0.100) | (0.091) | (0.085) | ||
| 适应性行为决策 | 0.602*** | |||||
| (0.078) | ||||||
| 常数 | 4.733*** | 6.398*** | 3.691 | 5.466*** | 4.891*** | |
| (0.247) | (0.611) | (0.746) | (0.262) | (0.220) | ||
| 0.638** | 0.506*** | 0.654*** | 0.737*** | 0.730*** | ||
| (0.025) | (0.506) | (0.027) | (0.044) | (0.032) | ||
| 0.464*** | 0.630*** | 0.379*** | 0.802*** | 1.035*** | ||
| (0.041) | (0.080) | (0.047) | (0.065) | (0.055) | ||
| -0.452*** | 0.974*** | |||||
| (0.089) | (0.070) | |||||
| Loglikehood | -869.078 | -231.904 | -613.957 | -2054.818 | -1160.648 | |
| lamda | 0.728 | 1.244 | 0.580 | 1.088 | 1.416 | |
| 观察值 | 739 | 200 | 539 | 200 | 539 | |
注:**表示在5%的水平上显著,下同。 |
表5 基于匹配样本的随机前沿函数模型与选择纠偏随机前沿函数模型的最大似然估计结果Table 5 Parameter estimates for the conventional and sample selection SPF models: matched sample |
| 变量 | 随机前沿函数 | 选择纠偏随机前沿函数 | ||||
|---|---|---|---|---|---|---|
| 全体组 | 适应组 | 未适应组 | 适应组 | 未适应组 | ||
| 仔畜费 | 0.025*** | 0.037*** | 0.031*** | 0.026** | 0.023*** | |
| (0.009) | (0.013) | (0.011) | (0.010) | (0.007) | ||
| 饲料费 | 0.332*** | 0.009* | 0.447*** | 0.342*** | 0.385*** | |
| (0.033) | (0.055) | (0.041) | (0.030) | (0.021) | ||
| 水电费 | -0.020 | 0.103* | -0.067 | -0.026 | -0.005 | |
| (0.035) | (0.062) | (0.042) | (0.041) | (0.026) | ||
| 医疗防疫费 | 0.220*** | 0.340*** | 0.121** | 0.222*** | 0.185** | |
| (0.041) | (0.062) | (0.053) | (0.051) | (0.036) | ||
| 养猪人数 | 0.051*** | 0.038* | 0.031* | 0.084*** | 0.068*** | |
| (0.132) | (0.020) | (0.016) | (0.013) | (0.008) | ||
| 机械与房屋费用 | 0.192 | 0.701*** | 0.116* | 0.148 | 0.285** | |
| (0.130) | (0.220) | (0.162) | (0.175) | (0.116) | ||
| 维修管理费 | 0.033 | 0.036 | 0.035 | 0.037 | 0.066*** | |
| (0.032) | (0.064) | (0.036) | (0.027) | (0.021) | ||
| 猪舍面积 | 0.434*** | 0.285** | 0.512*** | 0.439*** | 0.310*** | |
| (0.090) | (0.139) | (0.125) | (0.103) | (0.070) | ||
| 适应性行为决策 | 0.579*** | |||||
| (0.081) | ||||||
| 常数 | 4.986*** | 6.078*** | 4.805*** | 5.512*** | 4.333*** | |
| (0.291) | (0.563) | (0.360) | (0.331) | (0.200) | ||
| 0.604*** | 0.442*** | 0.625*** | 0.726*** | 0.654*** | ||
| (0.027) | (0.046) | (0.031) | (0.076) | (0.022) | ||
| 0.460*** | 0.654*** | 0.352*** | 0.804*** | 1.000*** | ||
| (0.045) | (0.076) | (0.053) | (0.071) | (0.021) | ||
| -0.477** | 0.999*** | |||||
| (0.188) | (0.001) | |||||
| Loglikehood | -581.627 | -218.573 | -343.0584 | -1141.625 | -876.669 | |
| lamda | 0.761 | 1.480 | 0.563 | 1.108 | 1.528 | |
| 观察值 | 511 | 196 | 315 | 196 | 315 | |
表6 养殖户适应性行为与养殖业生产效率T检验结果Table 6 The T-test results of farmer adaptation and breeding production efficiency |
| 养殖业生产效率均值比较 | 适应组 | 未适应组 | 均值差异(T检验结果) |
|---|---|---|---|
| 全样本 | |||
| 随机前沿函数(全体组) | 0.652 | 0.657 | -0.005 |
| 随机前沿函数(适应组与未适应组) | 0.595 | 0.700 | -0.105*** |
| 选择纠偏随机前沿函数模型(适应组与未适应组) | 0.619 | 0.541 | 0.078*** |
| 匹配样本 | |||
| 随机前沿函数(全体组) | 0.663 | 0.658 | 0.005 |
| 随机前沿函数(适应组与未适应组) | 0.593 | 0.718 | -0.125*** |
| 选择纠偏随机前沿函数模型(适应组与未适应组) | 0.618 | 0.551 | 0.067*** |
| [1] |
陈兆波, 董文, 霍治国, 等. 中国农业应对气候变化关键技术研究进展及发展方向. 中国农业科学, 2013, 46(15):3097-3104.
[
|
| [2] |
|
| [3] |
潘根兴, 高民, 胡国华, 等. 气候变化对中国农业生产的影响. 农业环境科学学报, 2011, 30(9):1698-1706.
[
|
| [4] |
周洁红, 唐利群, 李凯. 应对气候变化的农业生产转型研究进展. 中国农村观察, 2015, (3):74-86, 97.
[
|
| [5] |
|
| [6] |
|
| [7] |
|
| [8] |
|
| [9] |
|
| [10] |
田素妍, 陈嘉烨. 可持续生计框架下农户气候变化适应能力研究. 中国人口·资源与环境, 2014, 24(5):31-37.
[
|
| [11] |
|
| [12] |
|
| [13] |
|
| [14] |
刘莹, 黄季焜. 农户多目标种植决策模型与目标权重的估计. 经济研究, 2010, 45(1):148-157, 160.
[
|
| [15] |
|
| [16] |
王建华, 邓远远, 朱淀. 生猪养殖中兽药投入效率测度: 基于损害控制模型的分析. 中国农村经济, 2018, (1):63-77.
[
|
| [17] |
朱红根, 康兰媛, 周曙东. 南方稻区季节性干旱农户适应行为及其影响因素实证分析. 自然资源学报, 2016, 31(9):1540-1552.
[
|
| [18] |
唐利群, 周洁红, 于晓华. 采用保护性耕作对减少水稻产量损失的实证分析: 基于4省1080个稻农的调研数据. 自然资源学报, 2017, 32(6):1016-1028.
[
|
| [19] |
|
| [20] |
|
| [21] |
|
| [22] |
张哲晰, 穆月英, 侯玲玲. 参加农业保险能优化要素配置吗? 农户投保行为内生化的生产效应分析. 中国农村经济, 2018, (10):53-70.
[
|
| [23] |
周洁红, 刘青, 王煜. 气候变化对水稻质量安全的影响: 基于水稻主产区1063个农户的调查. 浙江大学学报: 人文社会科学版, 2017, 47(2):148-160.
[
|
| [24] |
孙世民, 张媛媛, 张健如. 基于Logit-ISM模型的养猪场(户)良好质量安全行为实施意愿影响因素的实证分析. 中国农村经济, 2012, (10):24-36.
[
|
| [25] |
|
| [26] |
冯晓龙, 刘明月, 仇焕广, 等. 资产专用性与专业农户气候变化适应性生产行为: 基于苹果种植户的微观证据. 中国农村观察, 2018, (4):74-85.
[
|
| [27] |
|
| [28] |
|
| [29] |
|
| [30] |
|
| [31] |
毛慧, 周力, 应瑞瑶. 风险偏好与农户技术采纳行为分析: 基于契约农业视角再考察. 中国农村经济, 2018, (4):74-89.
[
|
| [32] |
张燕媛, 展进涛, 陈超. 专业化、认知度对养殖户生猪价格指数保险需求的影响. 中国农村经济, 2017, (2):70-83.
[
|
| [33] |
|
| [34] |
|
| [35] |
|
| [36] |
周力, 周曙东. 极端气候事件的灾后适应能力研究: 以水稻为例. 中国人口·资源与环境, 2012, 22(4):167-174.
[
|
| [37] |
杨志海. 老龄化、社会网络与农户绿色生产技术采纳行为: 来自长江流域六省农户数据的验证. 中国农村观察, 2018, (4):44-58.
[
|
| [38] |
应瑞瑶, 徐斌. 农户采纳农业社会化服务的示范效应分析: 以病虫害统防统治为例. 中国农村经济, 2014, (8):30-41.
[
|
| [39] |
汪伟, 姜振茂. 人口老龄化对技术进步的影响研究综述. 中国人口科学, 2016, 26(3):114-125, 128.
[
|
| [40] |
|
| [41] |
冯晓龙, 刘明月, 霍学喜, 等. 农户气候变化适应性决策对农业产出的影响效应: 以陕西苹果种植户为例. 中国农村经济, 2017, (3):31-45.
[
|
/
| 〈 |
|
〉 |