
过去300年台湾省耕地面积时空变化重建
|
杨绪红(1988- ),男,湖南湘潭人,博士,助理研究员,主要从事土地利用与国土规划、空间建模研究。E-mail: yangxhnju@nju.edu.cn |
收稿日期: 2019-11-20
修回日期: 2020-04-06
网络出版日期: 2021-10-28
基金资助
国家自然科学基金项目(41801065)
版权
Reconstruction of farmland dataset of Taiwan province in recent 300 years
Received date: 2019-11-20
Revised date: 2020-04-06
Online published: 2021-10-28
Copyright
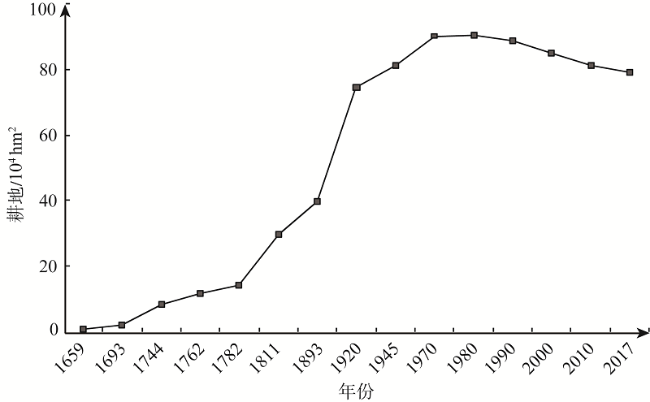
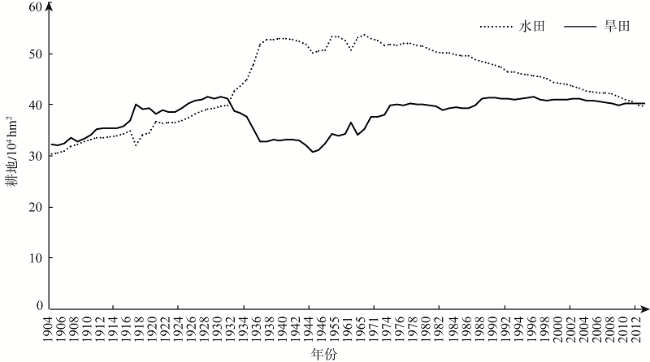
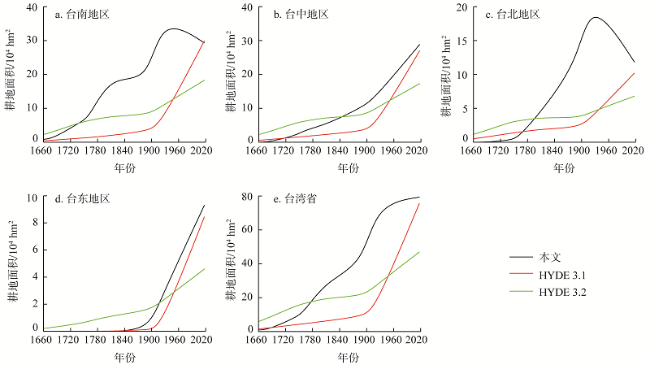
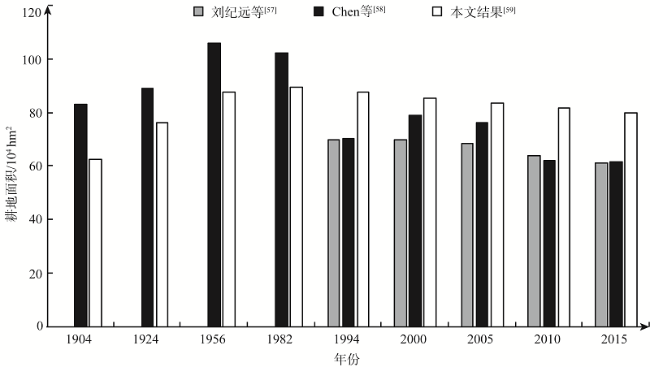
作为拓垦过程和人地交互作用显著的代表性区域,对台湾省历史耕地时空变化重建的研究,有利于深化对海峡两岸历史土地变化过程特征、差异和规律的认识。基于历史文献和统计年鉴,以历史人口数据为代用资料,分析了耕地和人口记录特征后,综合采用引用替代、线性内插、隐匿系数修正法、人均耕地系数法和余粮规模检验等方法,估算和订正了近300年来中国台湾省历史耕地的时空变化。结果表明:(1)台湾省耕地总量,由荷据时期的0.91×10⁴ hm2增长到当前的79.30×10⁴ hm2,增加了近86.60倍,阶段特征大体呈先增加后持续减少的态势,清前中期呈平稳低速增长,日据时期呈快速波动增长,国民党治台后中前期呈波动缓慢增长,中后期呈逐步降低态势。(2)百年尺度下,台湾省水田和旱田变化规律存在明显差异;水田规模呈先增加再波动后逐步减少的态势,旱田呈先增加再减少而后逐步增加的态势;1931年以前,旱田比例均高于水田,峰值期高了3%~5%;之后,水田比例超过旱地,居于优势地位,1936—1965年水田比例平均高于旱田22.23%。(3)台湾省的土地垦殖过程具有空间拓展性和区域不平衡性,土地开垦经历了由点到面、由南到北、由西往东的发展过程;台南地区是最先被开垦的区域,其后依次是台中和台北,台东地区是最后才被垦殖的区域;台南地区的垦殖强度一直高于其他地区,最高时达36.71%。(4)HYDE数据集与本文结果均呈逐步上升态势,但两者耕地规模和变化过程差异显著,国际数据集并不能反映近300年来台湾省耕地变化的客观史实。
杨绪红 , 薛樵风 , 周寅康 . 过去300年台湾省耕地面积时空变化重建[J]. 自然资源学报, 2021 , 36(8) : 2163 -2178 . DOI: 10.31497/zrzyxb.20210819
Taiwan is a representative region of the land reclamation and the intensive human-environment interaction. The study on the reconstruction of the spatial and temporal change of historical farmland in this province can deepen the understanding of the characteristics, differences and rules of the historical land change process on both Taiwan and the mainland. Based on historical literature and statistical yearbooks, this study uses population data to analyze the characteristics of farmland and population records. Then it comprehensively adopts methods such as citation substitution, linear interpolation, occult coefficient correction method and per capita farmland coefficient method to estimate and correct the spatial and temporal changes of historical farmland in Taiwan province in the past 300 years after verifying the surplus food quantity. The results are shown as follows: (1) The total amount of farmland in Taiwan increased from 0.91×10⁴ hm2 in the Dutch occupation period to the current 79.30×10⁴ hm2, up nearly 86.60 times. The stage characteristics generally increased first and then continued to decrease. In the middle and early periods of the Qing Dynasty, it showed steady and low-speed growth. During the Japanese occupation period, it showed rapid fluctuations. Then it experienced a slow fluctuation in the middle and early periods of the Republic of China, and gradually declined in the middle and late periods of the Republic of China. (2) On a 100-year scale, there are significant differences in the rules of change between paddy fields and dry fields in Taiwan; the amount of paddy fields increased first and then gradually decreased after volatility. However, the dry farmland increased first and then decreased and then gradually increased. Before 1931, the proportion of dry farmland was higher than that of paddy fields, and its peak period witnessed 3% to 5% higher; then the proportion of paddy fields exceeded that of dry farmland and was in an advantageous position. The average proportion of paddy fields from 1936 to 1965 was 22.23% higher than that of dry fields. (3) The land reclamation process in Taiwan has represented the imbalance between spatial expansion and regional expansion. Land reclamation experienced the development process from one region to the whole area of Taiwan Island, that is, from the south to the north, and from the west to the east. Tainan was the first region to be reclaimed, followed by Taichung and Taipei districts, and the Taitung region was the last one to be reclaimed. The reclamation intensity in Tainan was higher than that in the rest, with a maximum of 36.71%. (4) The HYDE dataset and the results of this study are gradually increasing, but the difference between the farmland area and the change process is significant. The international dataset does not reflect the objective historical facts of the change of farmland in Taiwan in the past 300 years.
表1 1683—1905年册载人口数据Table 1 The population of Taiwan province in historical archive during 1683-1905 (万人) |
| 年份 | 1683年 | 1782年 | 1811年 | 1811年 | 1811年 | 1887年 | 1893年 | 1905年 |
|---|---|---|---|---|---|---|---|---|
| 册载人口 | 3.07① | 91.29② | 200.39③ | 194.47④ | 190.18⑤ | 320③ | 254.57⑥⑦ | 258.77④ |
① [清] 蒋毓英. 《台湾府志》卷七《户口》. ② [民]《明清史料》戊编. 中研院历史语言研究院. 1961. ③ [民] 连横.《台湾通史》之《户役志》. 商务印书馆, 2010. ④ 《台湾省通志稿》卷二《人口篇》. 1956年. ⑤ 沈瑜庆, 陈衍. 《福建通志》之《户口志》. 1938年 ⑥ 伊能嘉矩. 台湾文化志. 台湾书房出版有限公司, 1985. ⑦ [清] 胡铁花. 《台东州采访册》. 台湾银行经济研究室, 1960年. |
表2 1683—1762年册载田亩数据Table 2 The farmland area of Taiwan province in historical archive during 1683 to 1762 (甲) |
| 年份 | 台湾县 | 凤山县 | 诸罗县 | 彰化县 | 淡水厅 | 澎湖厅 | 府志合计 |
|---|---|---|---|---|---|---|---|
| 1683 | 8562 | 5049 | 4844 | 18454 | |||
| 1693 | 10345 | 7249 | 8866 | 26460 | |||
| 1711 | 10459 | 9229 | 10821 | 30110 | |||
| 1744 | 12203 | 10960 | 15039 | 13030 | 1819 | 252 | 53051 |
| 1762 | 11994 | 12105 | 15352 | 18794 | 4746 | 62995 |
注:引自马波等[44],增添了澎湖厅数据。 |
表3 台湾省谷米内运部分记录Table 3 The part of records transporting grain from Taiwan province to the mainland |
| 时间 | 运送地点 | 数量 | 时间 | 运送地点 | 数量 |
|---|---|---|---|---|---|
| 雍正元年 | 浙江 | 米1万石 | 乾隆43年 | 浙江 | 米8.59万石 |
| 雍正2年 | 浙江 | 米4万石 | 乾隆50年 | 浙江 | 谷米20万石 |
| 雍正11年 | 浙江 | 谷2万石 | 乾隆51年 | 浙江 | 谷10万石 |
| 雍正13年 | 浙江 | 谷10万石 | 道光3年 | 浙江 | 谷0.6万石,米1.07万石 |
| 乾隆16年 | 浙江 | 谷米约15万石 | 道光4年 | 天津 | 米14万石 |
| 乾隆18年 | 浙江 | 数10万石 | 咸丰6年 | 北京 | 米30万石 |
| 乾隆24年 | 浙江 | 谷10万石 | 咸丰6年 | 江浙 | 数量不详 |
| 乾隆42年 | 浙江 | 谷10万石 | 咸丰10年 | 北京 | 数量不详 |
注:数据源自黄跃荣[46]。 |
表4 台湾省行政区划变迁沿革Table 4 The evolution of administrative divisions in Taiwan province from 1684 to 2000 |
| 时间/年 | 隶属 | 府 | 县 | 厅 | 备注 |
|---|---|---|---|---|---|
| 1684 | 福建 | 台湾 | 台湾、凤山、诸罗 | ||
| 1731 | 福建 | 台湾 | 台湾、凤山、诸罗、彰化 | 淡水、澎湖 | |
| 1812 | 福建 | 台湾 | 台湾、凤山、嘉义、彰化 | 淡水、澎湖、噶玛兰 | |
| 1885 | 福建 | 台湾、台北 | 台湾、凤山、嘉义、彰化、恒春、宜兰、淡水、新竹 | 基隆、埔里社澎湖 | |
| 1887 | 台湾 | 台湾、台北、台南 | 宜兰、淡水、新竹嘉义、安平、凤山、恒春 | 基隆、澎湖 | 台东直隶州 |
| 1894 | 台湾 | 台湾、台北、台南 | 淡水、新竹、宜兰、台湾、苗栗、彰化、云林、安平、嘉义、凤山、恒春 | 基隆、南雅、埔里社、澎湖 | 台东直隶州 |
| 时间/年 | 隶属 | 县 | 省辖市 | 县辖市 | 备注 |
| 1945—1949 | 台湾 | 台北、新竹、台中、高雄、台南、台东、花莲、澎湖 | 台北、基隆、新竹、台中、彰化、嘉义、高雄、台南、屏东 | 宜兰市、花莲市 | |
| 2000 | 台湾 | 宜兰、新竹、苗栗、彰化、南投、嘉义、云林、屏东、台东、花莲、澎湖、金门、连江 | 台北、新北、桃园、台中、台南、高雄 | 基隆、新竹、嘉义 |
表5 近300年台湾省垦殖率时空变化Table 5 The land reclamation ratio change of Taiwan province in the past 300 years (%) |
| 地区 | 1660年 | 1683年 | 1744年 | 1762年 | 1811年 | 1893年 | 1920年 | 2017年 |
|---|---|---|---|---|---|---|---|---|
| 台南 | 0.84 | 1.18 | 5.97 | 7.39 | 19.68 | 16.96 | 36.71 | 28.76 |
| 台中 | 0.08 | 1.96 | 3.39 | 5.00 | 10.04 | 12.75 | 27.35 | |
| 台北 | 0.40 | 1.24 | 6.30 | 16.58 | 29.80 | 16.32 | ||
| 台东 | 0.15 | 2.91 | 11.35 | |||||
| 平均垦殖率 | 0.24 | 0.35 | 2.33 | 3.32 | 8.27 | 11.07 | 20.71 | 21.91 |
| [1] |
|
| [2] |
石正国, 延晓冬, 尹崇华, 等. 人类土地利用的历史变化对气候的影响. 科学通报, 2007, 52(12): 1436-1444.
[
|
| [3] |
尹永飞, 陈星, 张洁, 等. 中国过去300年土地利用变化及其气候效应. 第四纪研究, 2009, 29(6): 1162-1169.
[
|
| [4] |
葛全胜, 戴君虎, 何凡能, 等. 过去300年中国部分省区耕地资源数量变化及驱动因素分析. 自然科学进展, 2003, 13(8): 825-832.
[
|
| [5] |
叶瑜, 方修琦, 任玉玉, 等. 东北地区过去300 年耕地覆盖变化. 中国科学: 地球科学, 2009, 39(3): 340-350.
[
|
| [6] |
李俊, 叶瑜, 魏学琼. 过去300 a 大清河上游南部流域耕地变化重建. 地理科学进展, 2019, 38(6): 883-895.
[
|
| [7] |
|
| [8] |
何凡能, 李士成, 张学珍. 北宋中期耕地面积及其空间分布格局重建. 地理学报, 2011, 66(11): 1531-1539.
[
|
| [9] |
曹雪, 金晓斌, 王金朔, 等. 近300 年中国耕地数据集重建与耕地变化分析. 地理学报, 2014, 69(7): 896-906.
[
|
| [10] |
何凡能, 李美娇, 刘浩龙. 北宋路域耕地面积重建及时空特征分析. 地理学报, 2016, 71(11): 1967-1978.
[
|
| [11] |
李美娇, 何凡能, 杨帆, 等. 元代前期省域耕地面积重建. 地理学报, 2018, 73(5): 832-842.
[
|
| [12] |
|
| [13] |
|
| [14] |
|
| [15] |
|
| [16] |
罗静, 张镱锂, 刘峰贵. 青藏高原东北部河湟谷地1726年耕地格局重建. 地理研究, 2014, 33(7): 1285-1296.
[
|
| [17] |
|
| [18] |
|
| [19] |
|
| [20] |
|
| [21] |
|
| [22] |
|
| [23] |
何凡能, 田砚宇, 葛全胜. 清代关中地区土地垦殖时空特征分析. 地理研究, 2003, 22(6): 687-697.
[
|
| [24] |
何凡能, 李士成, 张学珍, 等. 中国传统农区过去300年耕地重建结果的对比分析. 地理学报, 2012, 67(9): 1190-1200.
[
|
| [25] |
|
| [26] |
李蓓蓓, 方修琦, 叶瑜, 等. 全球土地利用数据集精度的区域评估: 以中国东北地区为例. 中国科学: 地球科学, 2010, 40(8): 1048-1059.
[
|
| [27] |
郭蓉, 刘峰贵, 陈琼, 等. 北宋后期黄河上游地区耕地格局重建: 以河湟谷地为例. 自然资源学报, 2021, 26(1): 27-37.
[
|
| [28] |
葛全胜, 戴君虎. 20世纪前、中期中国农林土地利用变化及驱动因素分析. 中国科学: D辑地球科学, 2005, 35(1): 54-63.
[
|
| [29] |
|
| [30] |
白淑英, 张树文, 张养贞. 土地利用/土地覆被时空分布100年数字重建: 以大庆市杜尔伯特蒙古族自治县为例. 地理学报, 2007, 62(4): 427-436.
[
|
| [31] |
匡文慧, 张树文, 张养贞, 等. 1900年以来长春市土地利用空间扩张机理分析. 地理学报, 2005, 60(5): 841-850.
[
|
| [32] |
张丽娟, 姜蓝齐, 张学珍, 等. 19世纪末黑龙江省的耕地覆盖重建. 地理学报, 2014, 69(4): 448-458.
[
|
| [33] |
李士成, 何凡能, 陈屹松. 清代西南地区耕地空间格局网格化重建. 地理科学进展, 2012, 31(9): 1196-1203.
[
|
| [34] |
李柯, 何凡能, 张学珍. 基于MODIS数据网格化重建历史耕地空间分布的方法: 以清代云南省为例. 地理研究, 2011, 30(12): 2281-2288.
[
|
| [35] |
|
| [36] |
王宇坤, 陶娟平, 刘峰贵, 等. 西藏雅鲁藏布江中游河谷地区1830年耕地格局重建. 地理研究, 2015, 34(12): 2355-2367.
[
|
| [37] |
石志新. 清代后期甘宁青地区人口与耕地变量分析. 中国农史, 2000, 19(1): 72-79.
[
|
| [38] |
罗静, 陈琼, 刘峰贵, 等. 青藏高原河谷地区历史时期耕地格局重建方法探讨: 以河湟谷地为例. 地理科学进展, 2015, 34(2): 207-216.
[
|
| [39] |
摆万奇, 姚丽娜, 张镱锂, 等. 近35 a西藏拉萨河流域耕地时空变化趋势. 自然资源学报, 2014, 29(4): 623-632.
[
|
| [40] |
李虎. 古亩折合市亩的三个公式. 中国农史, 1997, 16(3): 5-7.
[
|
| [41] |
谭其骧. 中国历史地图集(第八册). 北京: 中国地图出版社, 1996.
[
|
| [42] |
孔立. 早期台湾人口与耕地的重新估算: 兼论郑氏时代对开发的贡献. 台湾研究集刊, 1988, (3): 65-70.
[
|
| [43] |
蔣炳剑. 郑氏时代台湾农业的开发. 厦门大学学报: 哲学社会科学版, 1962, (1): 125-138.
[
|
| [44] |
马波, 张瑞清. 清代台湾的人口增长与土地开垦. 中国历史地理论丛, 1996, (2): 137-151.
[
|
| [45] |
段佩君. 清代台湾人口地理研究. 福州: 福建师范大学, 2008.
[
|
| [46] |
黄跃荣. 1683—1860年台湾米谷外销大陆研究. 厦门: 厦门大学, 2002.
[
|
| [47] |
周荣. 对清前期耕地面积的综合考察和重新估价. 中国社会经济史研究, 2001, (3): 39-49.
[
|
| [48] |
曹雪, 金晓斌, 周寅康. 清代耕地数据恢复重建方法与实证研究. 地理学报, 2013, 68(2): 245-256.
[
|
| [49] |
卜凯. 中国土地利用统计资料. 上海: 上海商务印刷馆, 1937.
[
|
| [50] |
李美娇, 何凡能, 刘浩龙. 北宋中期路域耕地面积的再估算. 地理研究, 2016, 35(12): 124-134.
[
|
| [51] |
周翔鹤. 近代台湾粮食和经济作物生产关系的一个定量分析. 中国社会经济史研究, 1994, (3): 70-77.
[
|
| [52] |
曾早早, 方修琦, 叶瑜. 基于聚落地名记录的过去300年吉林省土地开垦过程. 地理学报, 2011, 66(7): 985-993.
[
|
| [53] |
方修琦, 叶瑜, 葛全胜, 等. 从城镇体系的演变看清代东北地区的土地开发. 地理科学, 2005, 25(2): 129-134.
[
|
| [54] |
吕妍, 张树文, 杨久春. 基于地名志的东北历史时期土地利用变化研究: 以吉林省镇赉县为例. 地球信息科学学报, 2010, 12(2): 174-179.
[
|
| [55] |
|
| [56] |
|
| [57] |
刘纪远, 宁佳, 匡文慧, 等. 2010—2015年中国土地利用变化的时空格局与新特征. 地理学报, 2018, 73(5): 789-802.
[
|
/
| 〈 |
|
〉 |