
中国水禽产业时空演进及影响因素——基于全要素生产率增长视角
|
李刚(1990- ),男,贵州盘州人,博士研究生,研究方向为农业经济、环境科学与资源利用。E-mail: ligang520202@163.com |
收稿日期: 2020-01-10
修回日期: 2020-03-06
网络出版日期: 2021-10-28
基金资助
国家现代农业产业技术体系专项资金项目(CARS-42-28)
版权
Spatio-temporal evolution of waterfowl industry in China and its influencing factors:From the perspective of total factor productivity growth
Received date: 2020-01-10
Revised date: 2020-03-06
Online published: 2021-10-28
Copyright
水禽产业快速发展离不开技术进步的贡献。准确审视水禽产业全要素生产率的时空演进规律,探讨不同阶段水禽全要素生产率(TFP)的提升策略十分重要。基于中国水禽体系产业经济团队的调研数据和固定观测点数据,结合有关年鉴整理出水禽的投入和产出数据,运用GIS技术分析后得出结论:2010—2018年水禽产业时空演进特征为“东退西进,北向南移”。结合永续盘存法和索洛余值,运用数据包络分析法(DEA-Malmquist)估算全国29个省份水禽TFP指数,比较各地区的TFP增长率和贡献率,进而分析此期间的时空演进规律,结果显示:2014年TFP增长率大幅下跌,2015年又逐渐上升,2016年以后才趋于平稳增长,概括水禽TFP增长率的时空变化规律为先降后升的“U”型走势。运用Tobit模型分析其变动的影响因素,结果表明:受H7N9突发事件影响,水禽产业劳动力投入和资本投入发生了改变,主要影响因素为水电及燃料动力投入、基础设施维护及新增投入、疫苗防疫及医疗投入等,这些因素对水禽TFP增长的时空变动影响显著,进一步说明水禽技术效率有待提升,风险规避机制有待完善。
李刚 , 刘灵芝 . 中国水禽产业时空演进及影响因素——基于全要素生产率增长视角[J]. 自然资源学报, 2021 , 36(8) : 2095 -2112 . DOI: 10.31497/zrzyxb.20210814
The rapid development of waterfowl industry is inseparable from technological progress. It is very important to examine the evolution law of total factor productivity (TFP) in waterfowl industry and to explore the promotion strategies of TFP in different stages. Based on the survey data and fixed observation point data of the industrial economic team of China waterfowl system, combined with the input and output data of waterfowl industry sorted out in the relevant yearbooks, the paper uses GIS technology to analyze and draws the conclusion that the spatio-temporal evolution characteristics of waterfowl industry in 2010-2018 are "shift from east to west and from north to south". Combined with the perpetual inventory method and Solow residual value, data envelopment analysis DEA-Malmquist is used to estimate TFP of waterfowl industry in 29 provincial-level areas of China. The growth rate and contribution rate of TFP in each of six regions are compared, and then the spatio-temporal evolution law of this period is analyzed. The results show that the growth rate of TFP fell sharply in 2014, rose gradually in 2015, and then grew steadily after 2016. The spatio-temporal growth rate of TFP of waterfowl indutry is summarized. The curve of change presents a "U"-shaped pattern of first falling and then rising. Tobit model is used to examine the influencing factors of the changes. The results show that, affected by H7N9 emergencies, the labor and capital investment in waterfowl industry has changed. The main influencing factors are hydropower and fuel power investment, infrastructure maintenance and new investment, vaccine and epidemic prevention and medical investment. These factors have significant impact on the spatio-temporal changes in waterfowl TFP growth, which further shows that the technical efficiency of waterfowl industry needs to be enhanced, and the risk aversion mechanism should be improved.
表1 中国水禽产业全要素生产率投入产出指标Table 1 Total factor productivity input-output index of waterfowl industry in China |
| 基本指标 | 变量名称 | 符号 | 主要构成 | 单位 |
|---|---|---|---|---|
| 资本投入指标 | 仔畜投入 | k1 | 鸭苗费、鹅苗费等 | 元 |
| 饲料投入 | k2 | 精饲料、青饲料、饲料加工费等 | 元 | |
| 能源投入 | k3 | 电费、供暖燃料、其他燃料动力费等 | 元 | |
| 医疗防疫投入 | k4 | 医疗防疫、日常消毒费等 | 元 | |
| 其他直接投入 | k5 | 水资源太投入、死亡损失、修理维护、技术服务、材料费等 | 元 | |
| 其他间接投入 | k6 | 固定资产折旧、保险费、税费、污染治理费、管理费等 | 元 | |
| 劳动力投入 | 雇工工资 | l1 | 固定工人工资、临时工、兼职工工资 | 元 |
| 义务工折价 | l2 | 未直接支付报酬的劳动力折价、义务交换劳动力折价 | 元 | |
| 产出指标 | 净产值 | y | 禽肉净产值+禽蛋净产值 | 元 |
表2 2010—2018年中国水禽总产值区域分布Table 2 Regional distribution of national waterfowl gross output value from 2010-2018 (万元) |
| 年份 | 2010 | 2011 | 2012 | 2013 | 2014 | 2015 | 2016 | 2017 | 2018 |
|---|---|---|---|---|---|---|---|---|---|
| 华北地区 | 338277 | 358000 | 190484 | 117553 | — | 197949 | 218563 | 319215 | 724815 |
| 东北地区 | 1822496 | 1790717 | 631236 | 789928 | 764103 | 1227284 | 1275434 | 1562031 | 1775207 |
| 华东地区 | 4990274 | 5151465 | 5553743 | 5727207 | 886578 | 6599637 | 5978454 | 5021951 | 6344595 |
| 华中地区 | 1973832 | 2578259 | 3428056 | 2388793 | 452233 | 4462707 | 3632743 | 3581880 | 4052776 |
| 华南地区 | 2815493 | 3493586 | 2325219 | 3107384 | 1107089 | 2661606 | 2948174 | 2302182 | 2374557 |
| 西南地区 | 1384833 | 933473 | 576762 | 712900 | 91259 | 1522134 | 1123622 | 1440714 | 1458022 |
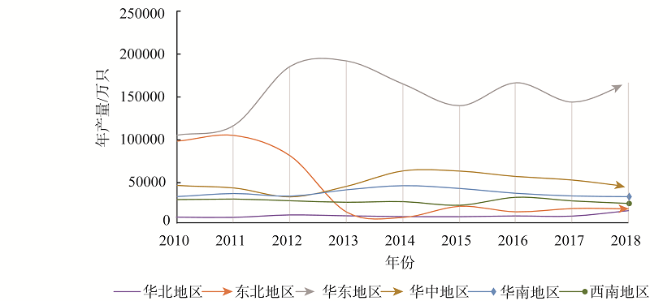
表3 2010—2018年中国水禽产量区域分布Table 3 Regional distribution of waterfowl production in China 2010-2018 (万只) |
| 年份 | 2010 | 2011 | 2012 | 2013 | 2014 | 2015 | 2016 | 2017 | 2018 |
|---|---|---|---|---|---|---|---|---|---|
| 华北地区 | 6120 | 5890 | 8621 | 7668 | 6745.64 | 6639 | 7505.45 | 7278 | 13487.63 |
| 东北地区 | 95123 | 102451 | 78371 | 12331 | 6254.9 | 19317 | 12775.04 | 16695.04 | 16280 |
| 华东地区 | 102351 | 114230 | 183694 | 189777 | 162648.8 | 137295.5 | 164259.5 | 141505.4 | 164379.4 |
| 华中地区 | 43340 | 41260 | 30831 | 43299.55 | 61324.43 | 61027.72 | 54728.07 | 50477.76 | 42670 |
| 华南地区 | 31251 | 35200 | 32108 | 39641.1 | 44395.59 | 41156.54 | 35472.19 | 32307.1 | 31513 |
| 西南地区 | 27154 | 28130 | 26112 | 24359.88 | 25120.47 | 20858.46 | 30208.83 | 25947.33 | 22937.99 |
表4 2012—2018年中国水禽产业全要素生产率指数构成时空分布Table 4 Spatio-temporal distribution of TFP index of waterfowl industry in China 2012-2018 |
| 区域 | 省(市、自治区) | 技术效 率指数(EFFCH) | 纯技术 效率指(PECH) | 规模效率指数 | 全要素生产率指数(TFP) | 区域 | 省(市、自治区) | 技术效率指数(EFFCH) | 纯技术效率指(PECH) | 规模效率指数 | 全要素生产率指数(TFP) |
|---|---|---|---|---|---|---|---|---|---|---|---|
| 全国平均 | 0.997 | 0.998 | 0.999 | 1.036 | 西南地区 | 贵州 | 0.948 | 0.974 | 0.973 | 0.985 | |
| 华北地区 | 北京 | 0.946 | 0.954 | 0.992 | 0.984 | 云南 | 1.035 | 1.014 | 1.021 | 1.076 | |
| 河北 | 1.060 | 1.056 | 1.004 | 1.102 | 四川 | 1.007 | 1.008 | 0.999 | 1.047 | ||
| 天津 | 0.996 | 1.006 | 0.99 | 1.036 | 重庆 | 0.977 | 0.963 | 1.014 | 1.016 | ||
| 山西 | 1.011 | 1.014 | 0.997 | 1.051 | 平均值 | 0.992 | 0.990 | 1.002 | 1.031 | ||
| 内蒙古 | 1.067 | 1.006 | 1.060 | 1.110 | 西北地区 | 宁夏 | 1.009 | 1.010 | 0.999 | 1.049 | |
| 平均值 | 1.016 | 1.007 | 1.009 | 1.057 | 陕西 | 1.026 | 1.052 | 0.975 | 1.067 | ||
| 东北地区 | 辽宁 | 0.976 | 0.997 | 0.979 | 1.014 | 甘肃 | 1.054 | 1.038 | 1.016 | 1.096 | |
| 吉林 | 0.950 | 0.983 | 0.967 | 0.988 | 青海 | 0.958 | 0.941 | 1.018 | 0.996 | ||
| 黑龙江 | 0.992 | 1.022 | 0.971 | 1.032 | 平均值 | 1.012 | 1.010 | 1.002 | 1.052 | ||
| 平均值 | 0.973 | 1.001 | 0.972 | 1.011 | 华东地区 | 浙江 | 0.986 | 0.998 | 0.988 | 1.025 | |
| 华南地区 | 广西 | 1.086 | 1.015 | 1.070 | 1.129 | 福建 | 1.031 | 1.032 | 0.999 | 1.072 | |
| 海南 | 0.979 | 0.989 | 0.990 | 1.018 | 山东 | 0.977 | 0.986 | 0.991 | 1.016 | ||
| 广东 | 1.040 | 1.007 | 1.033 | 1.082 | 上海 | 0.919 | 0.935 | 0.983 | 0.955 | ||
| 平均值 | 1.035 | 1.004 | 1.031 | 1.076 | 江苏 | 1.000 | 1.074 | 0.931 | 1.040 | ||
| 华中地区 | 河南 | 0.950 | 0.942 | 1.008 | 0.987 | 安徽 | 1.064 | 1.029 | 1.033 | 1.106 | |
| 湖北 | 0.961 | 0.962 | 0.999 | 0.999 | 江西 | 0.974 | 0.987 | 0.986 | 1.013 | ||
| 湖南 | 0.956 | 0.957 | 0.998 | 0.993 | 平均值 | 0.993 | 1.006 | 0.987 | 1.032 | ||
| 平均值 | 0.956 | 0.954 | 1.002 | 0.993 |
表5 2012—2018年中国水禽产业TFP增长率时空分布Table 5 Spatio-temporal distribution of TFP growth rate of waterfowl industry in China from 2012-2018 (%) |
| 区域 | 省(市、自治区) | 2012年 | 2013年 | 2014年 | 2015年 | 2016年 | 2017年 | 2018年 |
|---|---|---|---|---|---|---|---|---|
| 全国平均 | -1.303 | 0.199 | -0.223 | 0.140 | 0.118 | 0.125 | 0.160 | |
| 华北地区 | 北京 | -1.30 | 0.454 | -0.185 | -0.082 | 0.504 | -0.251 | -0.262 |
| 天津 | -0.10 | 1.023 | -0.135 | -0.435 | 0.564 | -0.205 | 0.005 | |
| 山西 | -3.00 | 0.666 | -0.078 | -0.375 | 0.349 | -0.109 | 0.172 | |
| 内蒙古 | -0.30 | 0.034 | -0.186 | 0.122 | 0.02 | 1.12 | -0.086 | |
| 河北 | 0.10 | -0.30 | 0.139 | 0.294 | -0.072 | 0.213 | 0.551 | |
| 平均值 | -0.92 | 0.374 | -0.089 | -0.095 | 0.273 | 0.1536 | 0.076 | |
| 东北地区 | 辽宁 | -3.20 | 0.028 | -0.131 | -0.003 | -0.015 | 0.198 | 0.036 |
| 吉林 | -3.80 | 0.883 | -0.053 | -0.468 | 0.535 | -0.479 | 0.226 | |
| 黑龙江 | -5.50 | 0.698 | -0.092 | -0.366 | 0.674 | -0.279 | 0.021 | |
| 平均值 | -4.167 | 0.536 | -0.09 | -0.28 | 0.398 | -0.19 | 0.094 | |
| 华南地区 | 广东 | -1.70 | 0.487 | -0.27 | -0.112 | 0.368 | 0.05 | 0.157 |
| 广西 | -1.60 | 0.194 | -0.215 | 0.102 | 0.404 | 0.249 | 0.143 | |
| 海南 | -1.10 | 0.044 | 0.011 | -0.118 | 0.348 | -0.221 | 0.139 | |
| 平均值 | -1.467 | 0.242 | -0.158 | -0.04 | 0.373 | 0.026 | 0.146 | |
| 华中地区 | 河南 | 2.50 | -0.33 | 0.123 | 0.085 | -0.135 | -0.163 | 0.558 |
| 湖北 | 0.60 | -0.04 | -0.309 | 0.507 | 0.061 | -0.16 | 0.114 | |
| 湖南 | -3.40 | 0.32 | -0.428 | 0.20 | -0.152 | 0.171 | 0.07 | |
| 平均值 | -0.100 | -0.02 | -0.205 | 0.264 | -0.075 | -0.051 | 0.247 | |
| 西南地区 | 四川 | -3.70 | -0.101 | -0.167 | 0.373 | -0.222 | 0.516 | 0.083 |
| 重庆 | -1.20 | -0.132 | -0.155 | 0.229 | -0.048 | 0.013 | 0.265 | |
| 云南 | 3.50 | 0.323 | -0.451 | 0.191 | 0.375 | 0.157 | 0.129 | |
| 贵州 | -0.20 | 0.201 | -0.167 | -0.23 | 0.211 | -0.1 | 0.09 | |
| 平均值 | -0.40 | 0.073 | -0.235 | 0.141 | 0.079 | 0.147 | 0.142 | |
| 西北地区 | 宁夏 | -0.40 | 0.586 | -0.373 | -0.239 | 0.507 | -0.011 | 0.18 |
| 甘肃 | -2.20 | -0.314 | 0.127 | 0.499 | -0.201 | 0.558 | 0.2 | |
| 青海 | -2.80 | -0.04 | -0.312 | 0.11 | 0.313 | -0.056 | 0.075 | |
| 陕西 | -2.20 | -0.015 | -0.474 | 0.999 | -0.076 | 0.14 | 0.352 | |
| 平均值 | -1.90 | 0.054 | -0.258 | 0.342 | 0.136 | 0.158 | 0.202 | |
| 华东地区 | 浙江 | -2.10 | 0.056 | -0.44 | 0.182 | -0.125 | 0.756 | 0.083 |
| 福建 | -0.90 | 0.527 | -0.441 | 0.292 | 0.26 | -0.166 | 0.309 | |
| 上海 | -2.40 | -0.209 | -0.177 | 0.374 | -0.318 | 0.306 | -0.047 | |
| 江苏 | -1.80 | 0.32 | -0.381 | 0.391 | -0.192 | 0.275 | 0.08 | |
| 安徽 | -0.10 | 0.157 | -0.332 | 0.111 | -0.024 | 0.54 | 0.418 | |
| 江西 | -1.90 | 0.054 | -0.295 | 0.492 | -0.129 | -0.281 | 0.551 | |
| 山东 | 2.40 | 0.195 | -0.611 | 0.923 | -0.356 | 0.835 | 0.04 | |
| 平均值 | -0.971 | 0.157 | -0.382 | 0.395 | -0.126 | 0.32 | 0.205 | |
表6 2012—2018年水禽产业全要素生产率的贡献率Table 6 Contribution rate of total factor productivity of waterfowl industry in 2012-2018 |
| 年份 | 技术效率(EFFCH) | 技术进步 (TECHCH) | 纯技术效率(PECH) | 规模效率(SECH) | 全要素生产率指数(TFP) | TFP贡献率/% |
|---|---|---|---|---|---|---|
| 平均值 | 1.020 | 1.060 | 1.020 | 1.000 | 1.040 | 152.3 |
| 2012 | 0.993 | 0.993 | 0.992 | 1.001 | 0.987 | 129.7 |
| 2013 | 0.898 | 1.281 | 0.84 | 1.069 | 1.150 | 173.1 |
| 2014 | 0.843 | 0.894 | 0.904 | 0.933 | 0.754 | 104.9 |
| 2015 | 1.567 | 0.690 | 1.592 | 0.984 | 1.082 | 170.3 |
| 2016 | 0.802 | 1.346 | 0.796 | 1.007 | 1.079 | 173.9 |
| 2017 | 1.037 | 1.030 | 1.000 | 1.037 | 1.068 | 160.7 |
| 2018 | 0.995 | 1.151 | 1.025 | 0.971 | 1.146 | 153.9 |
表7 水禽产业TFP增长主要影响因素指标描述性统计Table 7 Descriptive statistics of main factors affecting TFP growth of waterfowl industry |
| 变量 | 平均值 | 标准差 | 最小值 | 最大值 |
|---|---|---|---|---|
| 实际出栏量 | 15.54164 | 36.85861 | 0 | 960 |
| 劳动力投入 | 159.3645 | 253.4151 | 0 | 2760 |
| 含育雏成本 | 4.570106 | 2.391174 | 0 | 43.3 |
| 含逮禽费和交通运输费 | 0.391468 | 1.891666 | 0.01 | 36.8 |
| 单只鸭饲料投入成本 | 19.67983 | 7.484686 | 1.5 | 80 |
| 单只鸭疫苗费用 | 0.2706286 | 0.9206959 | 0 | 18.2 |
| 疾病用药 | 0.5075786 | 0.9672731 | 0 | 18.59 |
| 棚舍消毒,设备消毒费 | 0.1685448 | 0.9159442 | 0 | 18.05 |
| 电费 | 7874.853 | 9842.731 | 73.08 | 70000 |
| 水费 | 2761.552 | 4162.396 | 0 | 72000 |
| 生产设备、服务车辆燃油 | 17954.07 | 30737.54 | 710 | 653152.5 |
| 保险费 | 0.1301909 | 0.9140623 | 0 | 18 |
| 设备维修,新设备投入资金 | 3.893923 | 8.148326 | 0 | 60 |
| 化粪池,排污管道等 | 1555.169 | 1404.288 | 0 | 15000 |
表8 水禽产业TFP增长影响因素Tobit回归结果Table 8 Tobit regression results of TFP growth factors of waterfowl industry |
| 影响变量 | 变量解释 | Y |
|---|---|---|
| X1 | 雇工工资,义务工折算工资,逮禽投入 | 0.0468*** |
| (0.00692) | ||
| X2 | 出壳到育雏期间成本,或购苗成本 | -0.321 |
| (1.069) | ||
| X3 | 从育雏到出栏期间饲料成本 | -0.0821 |
| (0.186) | ||
| X4 | 疫苗,消毒,疾病治疗投入 | 2.512 |
| (3.873) | ||
| X5 | 水电及办公机动车燃油,设备燃油,天然气投入 | 0.000352*** |
| (3.75e-05) | ||
| X6 | 禽类死亡保险投入 | -12.89 |
| (11.75) | ||
| X7 | 基础设施维护,新增基础设施投入 | -0.728*** |
| (0.189) | ||
| X8 | 粪污处理设备投入 | -0.000167 |
| (0.000904) | ||
| 常量 | 常数项 | 3.485 |
| (6.091) | ||
| 观测值 | 样本量 | 859 |
| R2 | 0.145 |
注:***表示1%的统计显著性水平,Y表示产量,括号中内容表示标准误。 |
| [1] |
蔡跃洲, 付一夫. 全要素生产率增长中的技术效应与结构效应: 基于中国宏观和产业数据的测算及分解. 经济研究, 2017, 52(1): 72-88.
[
|
| [2] |
江飞涛, 李晓萍. 改革开放四十年中国产业政策演进与发展: 兼论中国产业政策体系的转型. 管理世界, 2018, 34(10): 73-85.
[
|
| [3] |
麦尔旦·吐尔孙, 尹宁, 王雅鹏, 等. 中国水禽产业发展现状与生产政策研究: 基于国际国内资源利用的视角. 广东农业科学, 2015, 42(17): 178-186.
[
|
| [4] |
潘丹, 应瑞瑶. 中国农业全要素生产率增长的时空变异: 基于文献的再研究. 经济地理, 2012, 32(7): 113-117.
[
|
| [5] |
易明, 李纲, 彭甲超, 等. 长江经济带绿色全要素生产率的时空分异特征研究. 管理世界, 2018, 34(11): 178-179.
[
|
| [6] |
赵俊伟, 陈永福, 余乐, 等. 中国生猪养殖业地理集聚时空特征及影响因素. 经济地理, 2019, 39(2): 180-189.
[
|
| [7] |
李兰冰. 中国能源绩效的动态演化、地区差距与成因识别: 基于一种新型全要素能源生产率变动指标. 管理世界, 2015, 31(11): 40-52.
[
|
| [8] |
左永彦, 冯兰刚. 中国规模生猪养殖全要素生产率的时空分异及收敛性: 基于环境约束的视角. 经济地理, 2017, 37(7): 166-174.
[
|
| [9] |
王佳月, 李秀彬, 辛良杰. 中国土地流转的时空演变特征及影响因素研究. 自然资源学报, 2018, 33(12): 2067-2083.
[
|
| [10] |
闫建伟, 王雅鹏. 我国肉鸭产业布局分析: 基于2010—2013年全国21个肉鸭主产区的面板数据. 华中农业大学学报: 社会科学版, 2015, (3): 28-33.
[
|
| [11] |
|
| [12] |
赵文, 程杰. 中国农业全要素生产率的重新考察: 对基础数据的修正和两种方法的比较. 中国农村经济, 2011, (10): 4-15.
[
|
| [13] |
|
| [14] |
李谷成, 范丽霞, 成刚, 等. 农业全要素生产率增长: 基于一种新的窗式DEA生产率指数的再估计. 农业技术经济, 2013, (5): 4-17.
[
|
| [15] |
|
| [16] |
任若恩, 孙琳琳. 我国行业层次的TFP估计: 1981—2000. 经济学: 季刊, 2009, 8(3): 925-950.
[
|
| [17] |
郝大明. 我国劳动力资源配置效率的实证研究. 北京: 首都经济贸易大学, 2007.
[
|
| [18] |
杨帆, 夏海勇. 我国农业部门劳动力投入的经济增长效应. 人口与经济, 2012, (5): 8-13.
[
|
| [19] |
|
| [20] |
王文静. 人力资本对区域经济增长的作用及收敛性研究. 长春: 东北师范大学, 2013.
[
|
| [21] |
|
| [22] |
李平. 提升全要素生产率的路径及影响因素: 增长核算与前沿面分解视角的梳理分析. 管理世界, 2016, (9): 1-11.
[
|
| [23] |
王欢, 穆月英, 侯玲玲. 玉米生产环境成本及全要素生产率的时空研究. 自然资源学报, 2017, 32(7): 1204-1216.
[
|
| [24] |
宋海岩, 刘淄楠, 蒋萍. 改革时期中国总投资决定因素的分析. 世界经济文汇, 2003, (1): 44-56.
[
|
| [25] |
黄勇峰, 任若恩. 中美两国制造业全要素生产率比较研究. 经济学: 季刊, 2002, (4): 161-180.
[
|
| [26] |
肖红叶, 郝枫. 资本永续盘存法及其国内应用. 财贸经济, 2005, (3): 55-97.
[
|
| [27] |
张军, 吴桂英, 张吉鹏. 中国省际物质资本存量估算: 1952—2000. 经济研究, 2004, (10): 35-44.
[
|
| [28] |
杨超, 程宝栋, 谢屹, 等. 中国木材产业发展的阶段识别及时空分异特征. 自然资源学报, 2017, 32(2): 235-244.
[
|
| [29] |
崔盼盼, 张艳平, 张丽君, 等. 中国省域隐含碳排放及其驱动机理时空演变分析. 自然资源学报, 2018, 33(5): 879-892.
[
|
| [30] |
张聪颖, 畅倩, 霍学喜. 中国苹果生产区域变迁分析. 经济地理, 2018, 38(8): 141-151.
[
|
| [31] |
孙才志, 姜坤, 赵良仕. 中国水资源绿色效率测度及空间格局研究. 自然资源学报, 2017, 32(12): 1999-2011.
[
|
| [32] |
杨志海, 王雅鹏, 尔旦·吐尔孙. 农户耕地质量保护性投入行为及其影响因素分析: 基于兼业分化视角. 中国人口·资源与环境, 2015, 25(12): 105-112.
[
|
/
| 〈 |
|
〉 |