
中国红色旅游经典景区网络关注度时空演变及影响因素
|
唐鸿(1988-),男,湖南凤凰人,博士研究生,讲师,主要从事区域旅游管理与旅游规划研究。E-mail: 47030393@qq.com |
收稿日期: 2021-02-18
要求修回日期: 2021-04-20
网络出版日期: 2021-09-28
基金资助
国家自然科学基金项目(41971187)
版权
Spatio-temporal evolution and influencing factors of Chinese red tourism classic scenic spots network attention
Received date: 2021-02-18
Request revised date: 2021-04-20
Online published: 2021-09-28
Copyright
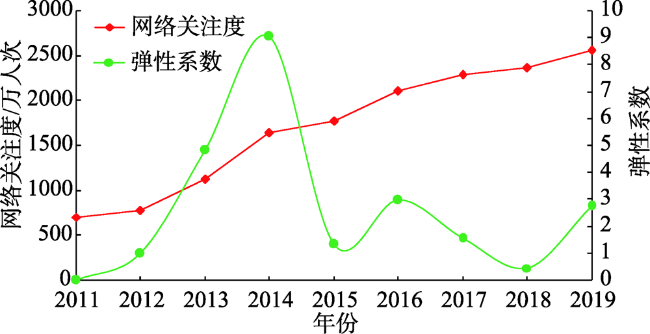
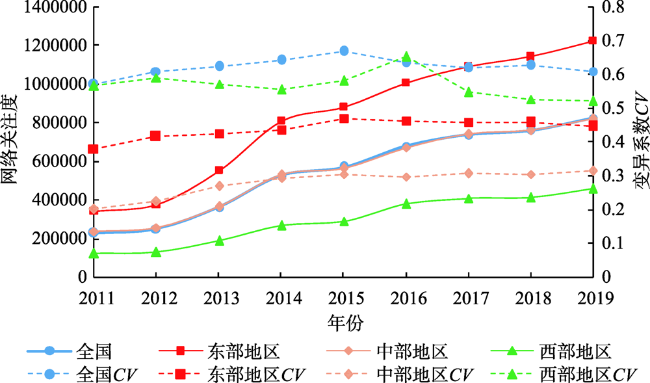
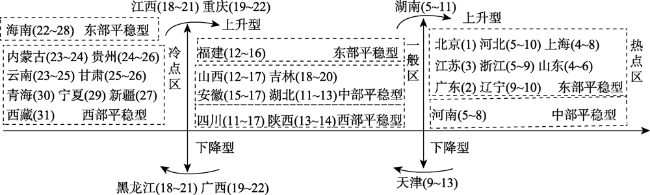
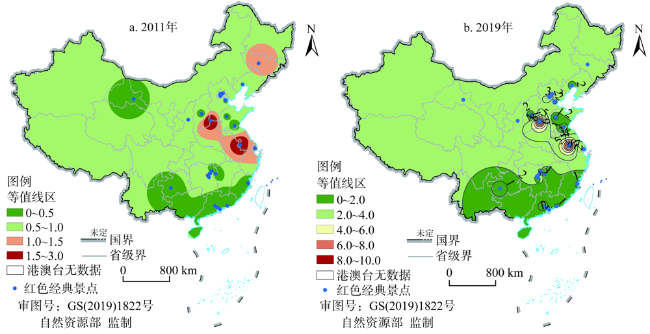
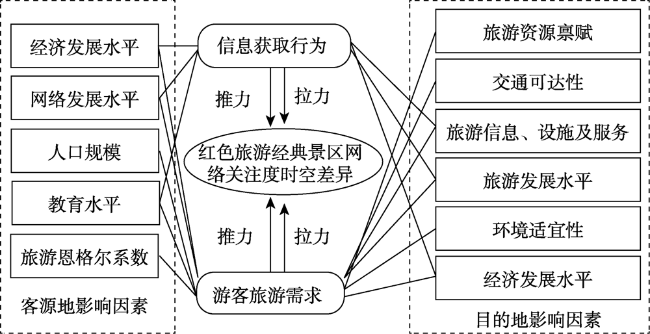
借助“百度指数”,获取2011—2019年中国31个省(市、自治区)对红色旅游经典景区的网络关注度,结合区域差异分析法、景区偏好系数分析红色旅游经典景区网络关注度的时空演变特征,利用面板数据回归模型和地理探测器揭示其影响机理。研究发现:(1)从时序上看,2011—2019年红色旅游经典景区的网络关注度持续上升,具有明显的季节性差异,呈“M”型变化形态。(2)从区域上看,东—中—西部具有明显的梯度递减特征,区域差异呈东—西—中部依次递减态势,空间结构比较均衡,东部地区多位于热点区,中部地区多处于一般区,西部地区则属于冷点区,各省(市、自治区)存在一定季节性差异。(3)景区角度方面,景区的月际变化分为单峰型、双峰型和多峰型三种,单峰型季节差异显著,双峰型和多峰型的季节差异较小,景区偏好类型呈“金字塔”结构,具有“多中心”分布特征,整体格局相对稳定。(4)影响因素方面,客源地网络发展水平的贡献>人口规模>教育水平>经济发展水平,而旅游恩格尔系数的影响不显著,目的地的星级酒店数量、旅游化水平、市外交通可达性是重要影响因素,信息化水平、空气质量、旅行社及公共管理能力是主要影响因素,其他因素影响力较小。
唐鸿 , 许春晓 . 中国红色旅游经典景区网络关注度时空演变及影响因素[J]. 自然资源学报, 2021 , 36(7) : 1792 -1810 . DOI: 10.31497/zrzyxb.20210712
The network attention of red tourism classic scenic spots in 31 provinces (autonomous regions and municipalities) of China from 2011 to 2019 was obtained by means of "Baidu Index". The spatio-temporal evolution characteristics and the preference degree of the network attention of the red tourism classic scenic spots were analyzed through coefficients of scenic spot preference. The influence mechanism of the changes in the network attention of the red tourism classic scenic spots was revealed by using panel data regression model and geographic detector model. The research found that: (1) In terms of time series, the network attention of red tourism classic scenic spots continuously increased from 2011 to 2019, with obvious seasonal differences, showing an "M"-shaped variation form. (2) From the regional perspective, network attention of red tourism classic scenic spots in the eastern-central-western regions showed obvious gradient-descending characteristics. The regional differences show a decreasing trend from east, west to center, with a relatively balanced spatial structure. The majority of eastern provinces are located in hot spots, central provinces are mostly at an average level, and western provinces are in cold spots. The eastern and western regions have relatively stable order series, the central region mostly showed an upward trend, and there are certain seasonal differences between provinces, but the time series do not change greatly. (3) From the perspective of scenic spots, the inter-monthly variations of scenic spots are divided into three types, namely, unimodal type, bimodal type and multimodal type. The seasonal difference of unimodal type is significant, but the seasonal difference between bimodal type and multimodal type is small. The preference of scenic spots with a "pyramid" structure is characterized by "multi-center" distribution with a relatively stable pattern on the whole. (4) Regarding influencing factors, the contribution is listed in the order of the development level of the tourist source network>population size>education level>economic development level. But the influence of the tourism Engel coefficient is not significant. The number of star-rated hotels in the destination and tourist level and the transportation accessibility outside the city are important influencing factors. The informatization level, air quality, travel agency and public management ability are the primary influencing factors.
表1 2011—2019年中国红色经典景区网络关注度及季节集中度指数Table 1 Red classic scenic spots network attention and seasonal concentration index in China (2011-2019) |
| 月份 | 网络关注度指数 | 季节集中度指数 | |||||||||
|---|---|---|---|---|---|---|---|---|---|---|---|
| 2011年 | 2013年 | 2015年 | 2017年 | 2019年 | 2011年 | 2013年 | 2015年 | 2017年 | 2019年 | ||
| 1 | 500578 | 474238 | 1251358 | 1355407 | 1446062 | 1.714 | 16.965 | 1.600 | 5.750 | 6.933 | |
| 2 | 447276 | 482416 | 1035693 | 1595619 | 1647947 | 4.230 | 16.372 | 6.164 | 1.813 | 3.377 | |
| 3 | 546747 | 731548 | 1243989 | 1626995 | 2197771 | 0.438 | 3.363 | 1.707 | 1.463 | 0.108 | |
| 4 | 725479 | 658166 | 1395736 | 1993455 | 2057726 | 3.405 | 6.178 | 0.202 | 0.156 | 0.050 | |
| 5 | 571394 | 643176 | 1633681 | 1760582 | 2075263 | 0.100 | 6.858 | 0.798 | 0.390 | 0.024 | |
| 6 | 594592 | 744711 | 1285935 | 1763034 | 2447231 | 0.001 | 2.948 | 1.145 | 0.377 | 1.719 | |
| 7 | 741144 | 1142174 | 1667828 | 2482277 | 2283066 | 4.264 | 3.285 | 1.180 | 6.420 | 0.441 | |
| 8 | 572336 | 1362012 | 2021341 | 2116735 | 2761272 | 0.092 | 14.171 | 9.500 | 0.872 | 6.494 | |
| 9 | 570505 | 1167674 | 1624512 | 2417933 | 2222093 | 0.108 | 4.157 | 0.708 | 5.073 | 0.180 | |
| 10 | 725634 | 1373753 | 1909108 | 2038088 | 2364489 | 3.413 | 14.967 | 5.995 | 0.348 | 0.970 | |
| 11 | 552571 | 1449696 | 1364981 | 1725748 | 2202870 | 0.336 | 20.640 | 0.389 | 0.604 | 0.121 | |
| 12 | 581564 | 1031894 | 1278056 | 1973064 | 1677542 | 0.030 | 0.694 | 1.242 | 0.093 | 2.962 | |
| 全国 | 7129820 | 11261458 | 17712218 | 22848937 | 25383332 | 1.229 | 3.036 | 1.598 | 1.395 | 1.396 | |
表2 景区网络关注度类型及偏好系数Table 2 Type and preference coefficient of scenic spot network attention |
| 景区 | 类型 | 季节集中度指数 | 景区 | 类型 | 季节集中度指数 | 景区 | 类型 | 季节集中度指数 |
|---|---|---|---|---|---|---|---|---|
| 毛泽东故居 | 单峰型 | 9.038 | 彭德怀故居 | 多峰型 | 1.584 | 上海城市规划展示馆 | 多峰型 | 1.940 |
| 杨开慧故居 | 单峰型 | 4.196 | 任弼时故居 | 多峰型 | 2.971 | 上海世博园 | 多峰型 | 1.541 |
| 福建革命历史纪念馆 | 单峰型 | 2.765 | 胡耀邦故居 | 多峰型 | 1.544 | 宋庆龄故居 | 多峰型 | 2.166 |
| 玉门油田 | 单峰型 | 4.827 | 岳麓山景区 | 多峰型 | 0.846 | 宛平城 | 多峰型 | 1.245 |
| 中国人民革命军事博物馆 | 单峰型 | 3.426 | 红旗渠 | 多峰型 | 1.308 | 王若飞故居 | 多峰型 | 3.038 |
| 华东革命烈士陵园 | 双峰型 | 3.125 | 济南战役纪念馆 | 多峰型 | 2.500 | 新文化运动纪念馆 | 多峰型 | 3.551 |
| 黄花岗七十二烈士墓 | 双峰型 | 3.359 | 北京规划展览馆 | 多峰型 | 3.318 | 鸦片战争博物馆 | 多峰型 | 1.072 |
| 焦庄户地道战遗址纪念馆 | 双峰型 | 3.246 | 李大钊烈士陵园 | 多峰型 | 3.166 | 延安革命纪念馆 | 多峰型 | 2.748 |
| 彭湃故居 | 双峰型 | 4.714 | 莲花山公园 | 多峰型 | 1.172 | 圆明园遗址公园 | 多峰型 | 2.336 |
| 刘胡兰纪念馆 | 双峰型 | 3.550 | 辽沈战役纪念馆 | 多峰型 | 2.582 | 长春电影制片厂 | 多峰型 | 1.665 |
| 天安门广场 | 双峰型 | 3.450 | 林则徐纪念馆 | 多峰型 | 1.623 | 中国人民抗日战争纪念馆 | 多峰型 | 2.167 |
| 中国国家博物馆 | 双峰型 | 1.590 | 卢沟桥 | 多峰型 | 1.236 | 中山陵 | 多峰型 | 1.107 |
| 北京奥林匹克公园 | 多峰型 | 1.965 | 平津战役纪念馆 | 多峰型 | 2.105 | 周恩来邓颖超纪念馆 | 多峰型 | 2.899 |
| 雷锋纪念馆 | 多峰型 | 2.197 | 中国航空博物馆 | 多峰型 | 1.881 |
图2 2011—2019年各区域红色旅游经典景区网络关注度Fig. 2 Network attention of variation of red tourism classic scenic spots in various regions (2011-2019) |
表3 2011—2019年全国红色经典景区网络关注度空间差异Table 3 The spatial differences of the network attention in red classic scenic spots (2011-2019) |
| 年份 | 全国地区 | 东部地区 | 中部地区 | 西部地区 | |||||||||||
|---|---|---|---|---|---|---|---|---|---|---|---|---|---|---|---|
| 赫芬达尔系数H | 地理集中度G | 首位度P | 赫芬达尔系数H | 地理集中度G | 首位度P | 赫芬达尔系数H | 地理集中度G | 首位度P | 赫芬达尔系数H | 地理集中度G | 首位度P | ||||
| 2011 | 0.043 | 20.673 | 1.632 | 0.104 | 32.256 | 1.632 | 0.130 | 36.075 | 1.290 | 0.110 | 33.196 | 1.192 | |||
| 2012 | 0.044 | 21.039 | 1.653 | 0.107 | 32.671 | 1.653 | 0.131 | 36.240 | 1.166 | 0.112 | 33.536 | 1.176 | |||
| 2013 | 0.045 | 21.160 | 1.440 | 0.107 | 32.774 | 1.440 | 0.134 | 36.613 | 1.003 | 0.111 | 33.253 | 1.161 | |||
| 2014 | 0.046 | 21.335 | 1.413 | 0.108 | 32.905 | 1.413 | 0.136 | 36.849 | 1.026 | 0.109 | 33.032 | 1.115 | |||
| 2015 | 0.047 | 21.590 | 1.456 | 0.111 | 33.324 | 1.456 | 0.137 | 36.967 | 1.040 | 0.111 | 33.378 | 1.122 | |||
| 2016 | 0.045 | 21.267 | 1.365 | 0.110 | 33.221 | 1.365 | 0.136 | 36.887 | 1.013 | 0.119 | 34.477 | 1.492 | |||
| 2017 | 0.045 | 21.119 | 1.412 | 0.110 | 33.187 | 1.412 | 0.137 | 36.993 | 1.014 | 0.108 | 32.930 | 1.177 | |||
| 2018 | 0.045 | 21.186 | 1.396 | 0.110 | 33.153 | 1.396 | 0.137 | 36.962 | 1.019 | 0.106 | 32.628 | 1.054 | |||
| 2019 | 0.044 | 21.043 | 1.323 | 0.109 | 33.005 | 1.323 | 0.137 | 37.053 | 1.073 | 0.106 | 32.556 | 1.100 | |||
表4 红色经典景区游客偏好系数及类型Table 4 Tourist preference coefficient and types of red classic scenic spots |
| 景区 | 2011年 | 2019年 | 均值 | 景区 | 2011年 | 2019年 | 均值 |
|---|---|---|---|---|---|---|---|
| 天安门广场 | 2.837(中强偏好) | 11.734(强偏好) | 4.602(强偏好) | 宛平城 | 0(弱偏好) | 1.803(较弱偏好) | 0.536(弱偏好) |
| 中山陵 | 3.368(中强偏好) | 8.851(强偏好) | 4.055(强偏好) | 中国人民抗日战争纪念馆 | 0.348(弱偏好) | 1.513(较弱偏好) | 0.510(弱偏好) |
| 红旗渠 | 3.459(中强偏好) | 9.283(强偏好) | 3.887(中强偏好) | 平津战役纪念馆 | 0.425(弱偏好) | 1.483(较弱偏好) | 0.418(弱偏好) |
| 卢沟桥 | 3.702(中强偏好) | 7.558(强偏好) | 3.588(中强偏好) | 雷锋纪念馆 | 0(弱偏好) | 0.455(弱偏好) | 0.361(弱偏好) |
| 岳麓山景区 | 2.129(中强偏好) | 6.316(强偏好) | 2.555(中强偏好) | 周恩来邓颖超纪念馆 | 0(弱偏好) | 1.208(较弱偏好) | 0.358(弱偏好) |
| 中国国家博物馆 | 2.499(中强偏好) | 6.716(强偏好) | 2.428(中强偏好) | 胡耀邦故居 | 0(弱偏好) | 0.714(弱偏好) | 0.231(弱偏好) |
| 毛泽东故居 | 1.823(较弱偏好) | 1.824(较弱偏好) | 1.551(较弱偏好) | 刘胡兰纪念馆 | 0(弱偏好) | 0.921(弱偏好) | 0.216(弱偏好) |
| 上海世博园 | 2.049(中强偏好) | 2.897(中强偏好) | 1.486(较弱偏好) | 上海城市规划展示馆 | 0(弱偏好) | 0.451(弱偏好) | 0.184(弱偏好) |
| 宋庆龄故居 | 1.630(较弱偏好) | 3.246(中强偏好) | 1.454(较弱偏好) | 王若飞故居 | 0(弱偏好) | 0.391(弱偏好) | 0.152(弱偏好) |
| 长春电影制片厂 | 1.432(较弱偏好) | 2.229(中强偏好) | 1.037(较弱偏好) | 济南战役纪念馆 | 0.254(弱偏好) | 0.422(弱偏好) | 0.148(弱偏好) |
| 莲花山公园 | 0.764(弱偏好) | 3.389(中强偏好) | 1.022(较弱偏好) | 鸦片战争博物馆 | 0(弱偏好) | 0.502(弱偏好) | 0.146(弱偏好) |
| 中国航空博物馆 | 0.850(弱偏好) | 2.135(中强偏好) | 0.842(弱偏好) | 彭湃故居 | 0(弱偏好) | 0.813(弱偏好) | 0.102(弱偏好) |
| 奥林匹克公园 | 0.959(弱偏好) | 1.992(较弱偏好) | 0.822(弱偏好) | 北京规划展览馆 | 0(弱偏好) | 0.246(弱偏好) | 0.084(弱偏好) |
| 圆明园遗址公园 | 0.361(弱偏好) | 2.278(中强偏好) | 0.816(弱偏好) | 华东革命烈士陵园 | 0(弱偏好) | 0.190(弱偏好) | 0.083(弱偏好) |
| 延安革命纪念馆 | 0.742(弱偏好) | 2.881(中强偏好) | 0.803(弱偏好) | 任弼时故居 | 0(弱偏好) | 0.317(弱偏好) | 0.077(弱偏好) |
| 玉门油田 | 0(弱偏好) | 2.492(中强偏好) | 0.794(弱偏好) | 新文化运动纪念馆 | 0(弱偏好) | 0.384(弱偏好) | 0.073(弱偏好) |
| 杨开慧故居 | 0(弱偏好) | 2.754(中强偏好) | 0.625(弱偏好) | 李大钊烈士陵园 | 0(弱偏好) | 0.300(弱偏好) | 0.061(弱偏好) |
| 辽沈战役纪念馆 | 0.743(弱偏好) | 1.657(较弱偏好) | 0.591(弱偏好) | 福建革命历史纪念馆 | 0(弱偏好) | 0.253(弱偏好) | 0.057(弱偏好) |
| 中国人民革命军事博物馆 | 0(弱偏好) | 2.546(中强偏好) | 0.559(弱偏好) | 焦庄户地道战遗址纪念馆 | 0(弱偏好) | 0.188(弱偏好) | 0.054(弱偏好) |
| 彭德怀故居 | 0(弱偏好) | 1.690(较弱偏好) | 0.552(弱偏好) | 黄花岗七十二烈士墓 | 0(弱偏好) | 0.128(弱偏好) | 0.040(弱偏好) |
| 林则徐纪念馆 | 0.618(弱偏好) | 1.531(较弱偏好) | 0.538(弱偏好) |
表5 相关性分析Table 5 Correlation analysis |
| 影响因素 | 经济发展水平ec | 人口规模ps | 网络发展水平in | 教育水平ed | 旅游恩格尔系数te |
|---|---|---|---|---|---|
| 测量指标 | 人均GDP | 年末常住人口 | 互联网覆盖率 | 大专以上人数占常住人口比例 | 根据孙根年等[28]的研究成果计算得到 |
| redtour | 0.969*** | 0.979*** | 0.991*** | 0.842*** | 0.741*** |
注:***表示1%水平下显著。 |
表6 平稳性检验结果Table 6 The stationary test of panel data |
| 变量 | LLC | ADF | PP | 结论 | 变量 | LLC | ADF | PP | 结论 | ||||||||||
|---|---|---|---|---|---|---|---|---|---|---|---|---|---|---|---|---|---|---|---|
| 统计值 | P值 | 统计值 | P值 | 统计值 | P值 | 统计值 | P值 | 统计值 | P值 | 统计值 | P值 | ||||||||
| lnredtour | -9.869 | 0 | 59.772 | 0.556 | 156.176 | 0.311 | 不平稳 | △lnredtour | -24.015 | 0 | 163.509 | 0 | 345.286 | 0 | 平稳 | ||||
| lnec | -3.539 | 0.002 | 57.539 | 0.637 | 105.337 | 0.005 | 不平稳 | △lnec | -8.443 | 0 | 103.597 | 0 | 125.551 | 0 | 平稳 | ||||
| lnps | 0.152 | 0.560 | 55.293 | 0.648 | 114.962 | 0 | 不平稳 | △lnps | -34.535 | 0 | 86.142 | 0.023 | 99.772 | 0.002 | 平稳 | ||||
| lnin | -6.607 | 0 | 1.467 | 0.929 | 46.165 | 0.934 | 不平稳 | △lnin | -8.607 | 0 | 88.349 | 0.001 | 124.222 | 0 | 平稳 | ||||
| lned | 2.174 | 0.985 | 57.079 | 0.653 | 40.669 | 0.984 | 不平稳 | △lned | -3.993 | 0 | 98.099 | 0.002 | 102.379 | 0.001 | 平稳 | ||||
| lnte | -4.347 | 0 | 53.673 | 0.765 | 55.137 | 0.719 | 不平稳 | △lnte | -15.746 | 0 | 166.905 | 0 | 218.521 | 0 | 平稳 | ||||
表7 面板数据回归模型结果Table 7 The regression results of panel data model |
| 变量 | 模型1(混合效应模型) | 模型2(固定效应模型) | 模型3(随机效应模型) | |||||
|---|---|---|---|---|---|---|---|---|
| 相关系数 | T统计值 | 相关系数 | T统计值 | 相关系数 | T统计值 | |||
| c(常数项) | -10.281*** | -19.453 | -36.134*** | -6.946 | -11.125*** | -21.724 | ||
| lnec | 0.435*** | 4.689 | 0.395*** | 3.969 | 0.542*** | 6.732 | ||
| lnps | 0.300** | 3.017 | 0.662*** | 5.139 | 0.325*** | 3.313 | ||
| lnin | 1.172** | 8.524 | 1.968*** | 18.413 | 1.911*** | 19.167 | ||
| lned | 0.707*** | 7.951 | 0.449*** | 3.793 | -0.118 | -1.167 | ||
| lnte | 0.476** | 3.249 | -0.131 | -1.171 | -0.058 | -0.539 | ||
| 干扰项标准差 | 0.966 | 0.151 | 0.175 | |||||
| R2 | 0.897 | 0.979 | 0.888 | |||||
| 调整后的R2 | 0.895 | 0.975 | 0.885 | |||||
| F值 | 47.792 | 317.018 | 430.890 | |||||
注:**、***分别表示变量在5%和1%置信水平下显著。 |
表8 红色经典景区网络关注度目的地环境影响因素Table 8 The destination environmental factors of red classic scenic spots network attention |
| 影响维度 | 具体指标 | 指标阐释 |
|---|---|---|
| 旅游资源 | 旅游资源优势度X1 | 世界遗产、国家级风景名胜区、国家自然保护区、国家地质公园、国家级非物质文化遗产、3A级以上景区通过赋值法计算得到 |
| 交通可达性 | 外部交通可达性X2 | 旅客客运量/万人 |
| 内部交通可达性X3 | 万人拥有公共汽车数辆/辆 | |
| 旅游信息、服务及接待能力 | 互联网覆盖率X4 | 互联网上网人数/常住人口比例/% |
| 星级酒店数量X5 | 三星级以上酒店数量之和/个 | |
| 旅行社数量X6 | 旅行社总数/个 | |
| 旅游发展水平 | 旅游经济贡献X7 | 旅游总收入/地区GDP/% |
| 旅游总收入X8 | 国内外旅游收入之和/亿元 | |
| 旅游接待人次X9 | 国内外旅游接待人数之和/万人次 | |
| 环境适宜性 | 空气质量X10 | 空气质量达标天数/天 |
| 生态绿色环境X11 | 建成区绿化覆盖率/% | |
| 市容环境卫生X12 | 道路清扫保洁面积/万m2 | |
| 公共管理及社会保障X13 | 年交通事故/次 | |
| 经济发展水平 | 区域经济整体水平X14 | 人均GDP/元 |
| 居民生活水平X15 | 城镇居民可支配收入/元 | |
| 城市化水平X16 | 城镇化率/% |
表9 地理探测结果Table 9 Geographical detection results |
| 指标维度 | 探测因素 | q值 | 指标维度 | 探测因素 | q值 |
|---|---|---|---|---|---|
| 旅游资源系统 | 旅游资源禀赋X1 | 0.272** | 环境适宜性 | 空气质量X10 | 0.208* |
| 交通可达性 | 外部交通可达性X2 | 0.225** | 生态绿色环境X11 | 0.123** | |
| 内部交通可达性X3 | 0.091 | 市容环境卫生X12 | 0.134* | ||
| 旅游信息、服务及接待能力 | 互联网覆盖率X4 | 0.212** | 公共管理及社会保障X13 | 0.182 | |
| 星级酒店数量X5 | 0.235** | 经济发展水平 | 区域经济整体水平X14 | 0.169** | |
| 旅行社数量X6 | 0.194* | 居民生活水平X15 | 0.069* | ||
| 旅游发展水平 | 旅游经济贡献X7 | 0.232** | 城市化水平X16 | 0.181** | |
| 旅游总收入X8 | 0.234** | ||||
| 旅游接待人次X9 | 0.153** |
注:*、**分别表示通过0.05、0.01的置信度检验。 |
| [1] |
贾楠. 改革开放以来红色旅游发展的历史考察. 当代中国史研究, 2019, 26(4):63-76.
[
|
| [2] |
人民网. 2017 年红色旅游影响力报告. http://yuqing. people.com.cn/n1/2018/0131/c394872-29798399.html.
[People's Daily Online. 2017 Red tourism impact report. http://yuqing. people.com.cn/n1/2018/0131/c394872-29798399.html. ]
|
| [3] |
高楠, 张新成, 王琳艳. 中国红色旅游网络关注度时空特征及影响因素. 自然资源学报, 2020, 35(5):1068-1089.
[
|
| [4] |
|
| [5] |
|
| [6] |
|
| [7] |
|
| [8] |
|
| [9] |
|
| [10] |
|
| [11] |
吴必虎, 余青. 红色旅游开发管理与营销. 北京: 中国建筑工业出版社, 2006: 36-49.
[
|
| [12] |
范力, 焦世泰, 韦复生. 左右江红色旅游区红色旅游产品开发展模式研究. 中国软科学, 2013,(111):170-177.
[
|
| [13] |
张河清, 陈宁英. 红色旅游城市的市场竞争态分析: 以6大红色旅游城市为例. 旅游学刊, 2008, 23(11):26-29.
[
|
| [14] |
石培新. 红色旅游教育功能提升与可持续发展. 宏观经济管理, 2020,(15):83-90.
[
|
| [15] |
王钦安, 吴俏. 安徽省红色旅游资源结构评价与优化. 山西师范大学学报: 自然科学版, 2020, 34(2):44-53.
[
|
| [16] |
刘颖洁. 张家界与韶山景区游客满意度的影响因素比较研究. 经济地理, 2016, 36(10):216-221.
[
|
| [17] |
徐克帅. 红色旅游和社会记忆. 旅游学刊, 2016, 31(3):35-42.
[
|
| [18] |
龙茂兴, 孙根年, 龙珍付. 遵义红色旅游网络关注度的客流响应研究. 地理与地理信息科学, 2013, 29(5):98-101.
[
|
| [19] |
郑华伟. 红色旅游价值观内化的网络文本文: 兼论国民幸福感的生成机制. 旅游学刊, 2016, 31(5):111-118.
[
|
| [20] |
蔡卫民, 彭晶, 覃娟娟. 韶山的全国网络关注热度矩阵及推广策略研究. 旅游科学, 2016, 30(4):61-72.
[
|
| [21] |
黄先开, 张丽峰, 丁于思. 百度指数与旅游景区游客量的关系及预测研究: 以北京故宫为例. 旅游学刊, 2013, 28(11):93-100.
[
|
| [22] |
江恋. 湖南“红三角”景区网络关注度时空分布特征及形成机理. 湘潭: 湘潭大学, 2016.
[
|
| [23] |
陈晓威, 孙建军, 汤志伟, 等. 链接分析视角下我国红色旅游网站的网络结构及影响力研究. 情报科学, 2018, 36(1):152-157.
[
|
| [24] |
|
| [25] |
李莉, 侯国林, 夏四友, 等. 成都市休闲旅游资源空间分布特征及影响因素. 自然资源学报, 2020, 35(3):683-697.
[
|
| [26] |
|
| [27] |
邹永广, 林炜铃, 郑向敏. 旅游安全网络关注度时空特征及其影响因素. 旅游学刊, 2015, 30(2):101-109.
[
|
| [28] |
孙根年, 杨亚丽. 2.0版中国旅游恩格尔系数构建及时空变化研究. 人文地理, 2014,(13):121-127.
[
|
| [29] |
李伯华, 曾灿, 刘沛林, 等. 传统村落人居环境转型发展的系统特征及动力机制研究: 以江永县兰溪村为例. 经济地理, 2019, 39(8):153-159.
[
|
| [30] |
麻学锋, 崔盼盼. 旅游演艺业对旅游产业成长的响应过程与影响机制: 以张家界“魅力湘西”为例. 地理与地理科学信息, 2019, 35(1):118-124.
[
|
| [31] |
郭向阳, 穆学青, 明庆忠, 等. 旅游地交通服务功能与旅游强度协调时空分异特征: 以云南省为例. 自然资源学报, 2020, 35(6):167-186.
[
|
| [32] |
赵黎明, 杨其元. 旅游城市系统. 武汉: 华中科技大学出版社, 2007: 56-74.
[
|
/
| 〈 |
|
〉 |