
中国生猪耗粮系数时空演变特征
|
刘晓宇(1997- ),女,湖北襄阳人,硕士,主要从事土地利用变化与效应研究。E-mail: liuxy.19s@igsnrr.ac.cn |
收稿日期: 2020-10-12
要求修回日期: 2021-02-03
网络出版日期: 2021-08-28
基金资助
国家重点研发计划项目(2017YFE0104600)
版权
Spatial and temporal variations of grain consumption coefficient of pig in China
Received date: 2020-10-12
Request revised date: 2021-02-03
Online published: 2021-08-28
Copyright
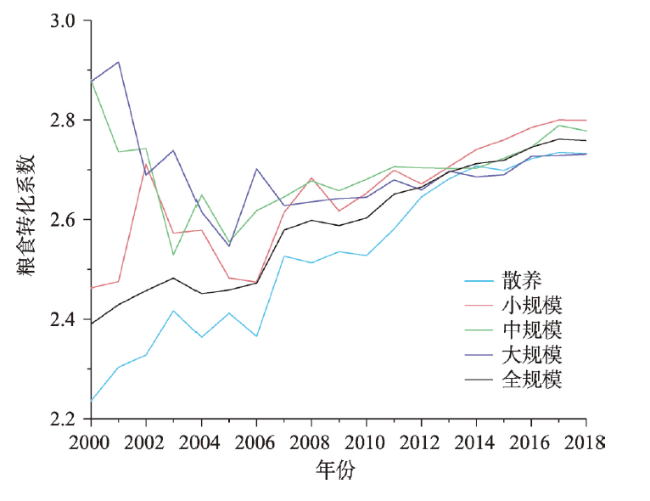
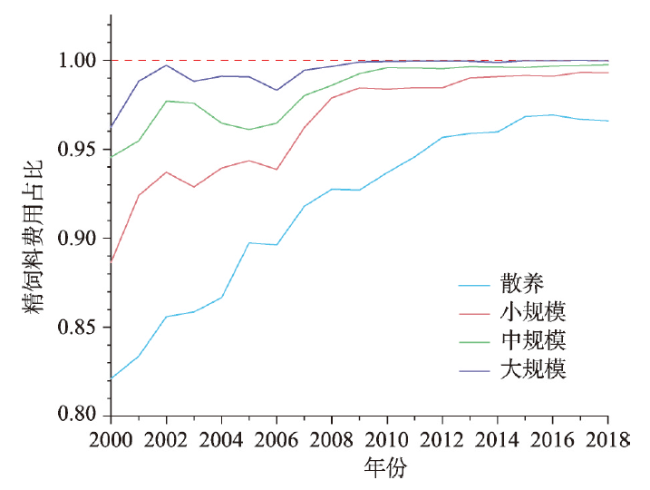
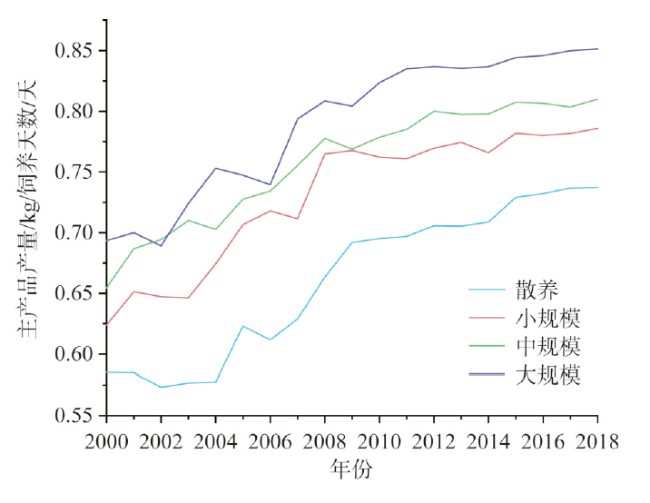
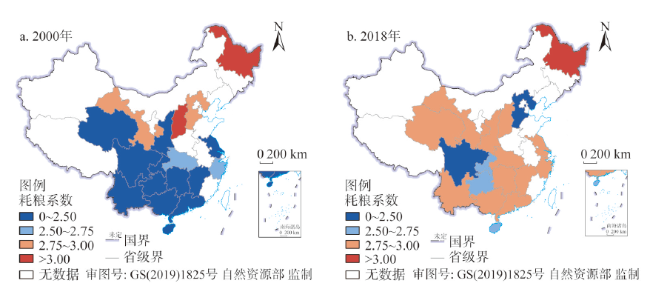
当代中国,生猪饲料粮的生产与消费已经逐渐成为影响我国粮食安全保障的重要问题。耗粮系数是合理测算饲料粮需求量的核心,厘清其时空演变特征对准确测算饲料粮数量具有重要意义。通过着重测算2000—2018年中国不同规模饲养生猪耗粮系数,探讨其时空演变特征及可能原因,得到以下主要结论:(1)近年来我国生猪耗粮系数呈现出明显的上升趋势,由2000年的2.39上升至2018年的2.76,年均增长0.023。(2)不同规模饲养生猪耗粮系数的差距逐渐缩小,主要受到饲养过程中使用的精饲料占比变化趋同的影响。(3)大规模饲养生猪的粮食转化效率和时间效率均高于其他规模。(4)散养生猪的耗粮系数在空间上呈现“南北高,中部低”,其他规模则呈现“北高南低,中部高东西低”的格局。从提高粮食利用效率的角度,我国生猪养殖宜继续推动大规模饲养。
刘晓宇 , 辛良杰 . 中国生猪耗粮系数时空演变特征[J]. 自然资源学报, 2021 , 36(6) : 1494 -1504 . DOI: 10.31497/zrzyxb.20210611
The production and consumption of pig feed grain have gradually become the primary factor affecting China's food security. The grain consumption coefficient, which is easily influenced by the natural environment and economic conditions, is the core of reasonable estimation of feed grain demand. Therefore, it is important to clarify the spatial and temporal variation characteristics. Accordingly, taking pigs as an example, we measured the spatial and temporal variations of the grain consumption coefficient and the possible causes of different feeding scales in different provinces from 2000 to 2018. The conclusions can be drawn as follows: (1) The grain consumption coefficients of a backyard, small-scale, and the average value of all the scales showed an increasing trend while those of the medium and large scales showed a decreasing and then an increasing trend. (2) The gap between the grain consumption coefficients of different scales was narrowed gradually with the decreasing percentage of concentrated feed costs. (3) The grain conversion efficiency and time efficiency of a large scale were higher than those of other scales. (4) Except for backyard feeding, the grain consumption coefficients of other scales were higher in northern China and lower in southern China while those of the central region of China were higher than the eastern and western regions. The high grain conversion coefficient of consumption in northern China may be due to the fact that pigs need more energy to protect themselves from cold and need to consume more feed, while the differences in southern China may be related to the breed and feed type composition of the pigs. In addition, in order to improve efficiency and save food, it is significant to promote the large-scale pig feeding pattern, to standardize, intensify, mechanize and automate the construction of pig rearing, and to improve the efficiency of pig breeding. Large-scale farming should be distributed in Xinjiang, Qinghai, Sichuan, Guangxi, Hebei, Shandong, and Henan, and over-farming is not recommended in the northeast region as well as Hubei and Hunan. Provinces in the central region, such as Sichuan, Shaanxi, Guizhou, and Hunan, are appropriate for backyard pig farming. To improve feed utilization efficiency, it is advisable to promote large-scale pig breeding.
表1 每户饲养数量及规模转换系数取值Table 1 The values of pigs per household and scale conversion factor |
| 《全国农产品成本 收益资料汇编》 规模分类 | 《中国畜牧兽医年鉴》规模分类 | ||||||
|---|---|---|---|---|---|---|---|
| 2003—2007年 | 2008—2018年 | ||||||
| 规模/头 | 每户饲养数量取值/头 | 规模转换 系数取值 | 规模/头 | 每户饲养数量取值/头 | 规模转换 系数取值 | ||
| 散养 (≤30头) | 1~9 | 5 | 1 | 1~49 | 25 | 0.6 | |
| 10~49 | 30 | 0.5 | |||||
| 小规模 (31~100头) | 10~49 | 30 | 0.5 | 1~49 | 25 | 0.4 | |
| 50~99 | 75 | 1 | 50~99 | 75 | 1 | ||
| 中规模 (101~1000头) | 100~499 | 300 | 1 | 100~499 | 300 | 1 | |
| 500~2999 | 1750 | 0.2 | 500~999 | 750 | 1 | ||
| 大规模 (>1000头) | 500~2999 | 1750 | 0.8 | 1000~2999 | 2000 | 1 | |
| 3000~9999 | 6500 | 1 | 3000~4999 | 4000 | 1 | ||
| 10000~49999 | 30000 | 1 | 5000~9999 | 7500 | 1 | ||
| >50000 | 60000 | 1 | 10000~49999 | 30000 | 1 | ||
| >50000 | 60000 | 1 | |||||
表2 不同规模耗粮系数线性拟合结果Table 2 Linear fitting results of grain consumption coefficients of different scales |
| 饲养规模 | 线性拟合方程 | R2 |
|---|---|---|
| 散养 | 0.912 | |
| 小规模 | 0.862 | |
| 中规模 | 0.885 | |
| 大规模 | 0.630 | |
| 全规模 | 0.935 |
注:表中的x为年份,y为耗粮系数。各方程的拟合斜率、截距及R2均在0.01水平上显著。考虑到2000—2004年数据有较大波动,线性拟合从2005年开始。 |
图4 2000年和2018年全规模生猪耗粮系数空间分布注:本图基于自然资源部标准地图服务系统下载的标准地图制作,底图无修改。 Fig. 4 Spatial distributions of the average grain consumption coefficients in 2000 and 2018 |
表3 2018年中国各省份不同规模生猪耗粮系数数值Table 3 Values of grain consumption coefficients for pig of different scales in different provinces of China in 2018 |
| 省(市、自治区) | 散养 | 小规模 | 中规模 | 大规模 | 全规模 |
|---|---|---|---|---|---|
| 平均 | 2.733 | 2.799 | 2.778 | 2.731 | 2.758 |
| 北京 | — | — | 2.081 | 2.484 | — |
| 天津 | — | — | 2.595 | 2.639 | — |
| 河北 | 2.504 | 2.468 | 2.483 | 2.442 | 2.472 |
| 山西 | 2.948 | 2.947 | 2.966 | 3.009 | 2.977 |
| 内蒙古 | — | 3.207 | 3.056 | 2.885 | — |
| 辽宁 | — | 2.799 | 2.788 | 2.785 | — |
| 吉林 | — | 2.784 | 2.808 | 2.825 | — |
| 黑龙江 | 2.887 | 3.308 | 3.371 | 3.371 | 3.281 |
| 上海 | — | — | — | 2.369 | — |
| 江苏 | 2.745 | 2.950 | 2.858 | 2.809 | 2.833 |
| 浙江 | 3.369 | 2.713 | 2.564 | 2.557 | 2.729 |
| 安徽 | — | — | 2.892 | 2.805 | — |
| 福建 | 2.704 | — | 3.685 | 3.114 | — |
| 江西 | 2.676 | 2.986 | 2.934 | 2.897 | 2.883 |
| 山东 | — | 2.599 | 2.616 | 2.543 | — |
| 河南 | — | 2.369 | 2.337 | 2.317 | — |
| 湖北 | 2.755 | 2.987 | 3.016 | 2.966 | 2.916 |
| 湖南 | 2.394 | 2.958 | 3.154 | 3.050 | 2.849 |
| 广东 | 2.947 | 2.697 | 2.868 | 2.778 | 2.814 |
| 广西 | 3.376 | 2.352 | 2.317 | 2.384 | 2.762 |
| 海南 | 2.654 | 2.523 | 2.687 | 2.711 | 2.641 |
| 重庆 | 2.122 | 3.200 | 2.912 | 2.712 | 2.595 |
| 四川 | 2.331 | 2.224 | 2.266 | 2.331 | 2.287 |
| 贵州 | 2.398 | 2.773 | 2.712 | 2.894 | 2.567 |
| 云南 | 2.987 | 2.842 | 2.790 | 2.847 | 2.911 |
| 西藏 | — | — | — | — | — |
| 陕西 | 2.193 | 2.971 | 3.100 | 2.891 | 2.769 |
| 甘肃 | 2.945 | 2.953 | 2.841 | 2.777 | 2.927 |
| 青海 | 2.932 | 2.702 | 2.646 | 2.586 | 2.822 |
| 宁夏 | — | 2.669 | 2.733 | — | — |
| 新疆 | — | — | 2.399 | 2.312 | — |
注:“—”表示无数据。 |
| [1] |
|
| [2] |
罗其友, 米健, 高明杰. 中国粮食中长期消费需求预测研究. 中国农业资源与区划, 2014,35(5):1-7.
[
|
| [3] |
辛良杰, 王佳月, 王立新. 基于居民膳食结构演变的中国粮食需求量研究. 资源科学, 2015,37(7):1347-1356.
[
|
| [4] |
赵萱, 邵一珊. 我国粮食供需的分析与预测. 农业现代化研究, 2014,35(3):277-280.
[
|
| [5] |
|
| [6] |
|
| [7] |
周道玮, 刘华伟, 孙海霞, 等. 中国肉品供给安全及其生产保障途径. 中国科学院院刊, 2013,28(6):733-739.
[
|
| [8] |
王涛, 吕昌河. 基于合理膳食结构的人均食物需求量估算. 农业工程学报, 2012,28(5):273-277.
[
|
| [9] |
|
| [10] |
王明华. 对我国饲料粮供需形势的分析. 调研世界, 2012, (2):24-26.
[
|
| [11] |
马永欢, 牛文元. 基于粮食安全的中国粮食需求预测与耕地资源配置研究. 中国软科学, 2009, (3):11-16.
[
|
| [12] |
陈恭军. 中国饲料粮供需变化对未来粮食自给的影响. 中国畜牧杂志, 2012,48(4):23-26.
[
|
| [13] |
|
| [14] |
韩昕儒, 陈永福, 钱小平. 中国目前饲料粮需求量究竟有多少. 农业技术经济, 2014, (8):60-68.
[
|
| [15] |
黄季焜, 王济民, 解伟, 等. 现代农业转型发展与食物安全供求趋势研究. 中国工程科学, 2019,21(5):1-9.
[
|
| [16] |
|
| [17] |
|
| [18] |
|
| [19] |
唐华俊, 李哲敏. 基于中国居民平衡膳食模式的人均粮食需求量研究. 中国农业科学, 2012,45(11):2315-2327.
[
|
| [20] |
封志明. 中国未来人口发展的粮食安全与耕地保障. 人口研究, 2007,31(2):15-29.
[
|
| [21] |
张绪美, 董元华, 沈文忠. 我国主要畜禽养殖量及饲料粮需求量估算. 饲料研究, 2015, (4):8-11.
[
|
| [22] |
辛良杰, 王立新, 刘爱民. 我国饲料粮区域产消平衡特征及政策启示. 自然资源学报, 2018,33(6):965-977.
[
|
| [23] |
黄泽颖, 郭燕枝, 孙君茂. 种子投入产出效率、饲料粮转化效率与粮食和营养安全. 中国农业科技导报, 2019,21(11):17-26.
[
|
| [24] |
|
| [25] |
郭华, 蔡建明, 杨振山. 城市食物生态足迹的测算模型及实证分析. 自然资源学报, 2013,28(3):417-425.
[
|
| [26] |
|
| [27] |
辛良杰. 中国大陆可能的膳食消费水平与粮食需求量: 基于中国台湾的历程判断. 中国工程科学, 2018,20(5):135-141.
[
|
| [28] |
国家发展与改革委员会价格司. 全国农产品成本收益资料汇编(2000—2018). 北京: 中国统计出版社, 2000-2018.
[ Price Department of National Development and Reform Commission. National Agricultural Product Cost and Benefit Data Collection (2000-2018). Beijing: China Statistics Press, 2000-2018.]
|
| [29] |
《中国畜牧兽医年鉴》编辑部. 中国畜牧兽医年鉴(2003—2018). 北京: 中国农业出版社, 2003-2018.
[ Editorial Office of "China Animal Husbandry and Veterinary Yearbook". China Animal Husbandry and Veterinary Yearbook (2003-2018). Beijing: China Agriculture Press, 2003-2018.]
|
| [30] |
胡向东, 王济民. 我国生猪饲料耗粮量估算及结构分析. 农业技术经济, 2015, (10):4-13.
[
|
| [31] |
孙景春. 影响肉猪料肉比的因素及对策. 现代畜牧科技, 2016, (4):44.
[
|
| [32] |
刘婷, 周扬. 我国不同规模生猪养殖成本效率, 影响因素及区域差异分析. 黑龙江畜牧兽医, 2020, (14):22-26.
[
|
/
| 〈 |
|
〉 |