
全球人口与粮食的空间错位演变及影响因素分析
|
罗秀丽(1994- ),女,福建三明人,硕士,主要从事乡村发展与土地利用研究。E-mail: luoxiuli66@163.com |
收稿日期: 2020-05-18
要求修回日期: 2020-07-20
网络出版日期: 2021-08-28
基金资助
国家自然科学基金项目(41871177)
国家自然科学基金项目(41801088)
广东省重点领域研发计划项目(2020B0202010002)
广州市科技计划项目(201707010097)
版权
Spatial mismatch evolution of global population and food and its influencing factors
Received date: 2020-05-18
Request revised date: 2020-07-20
Online published: 2021-08-28
Copyright
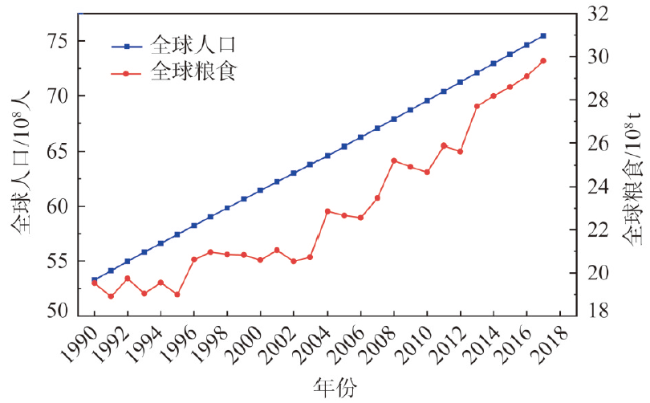
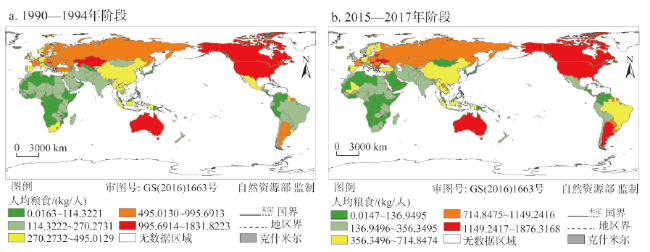
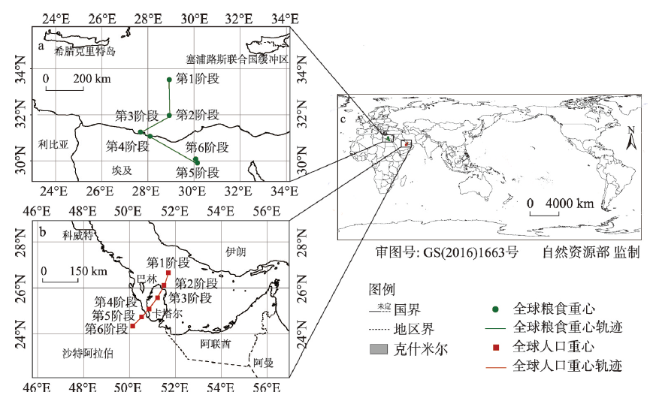
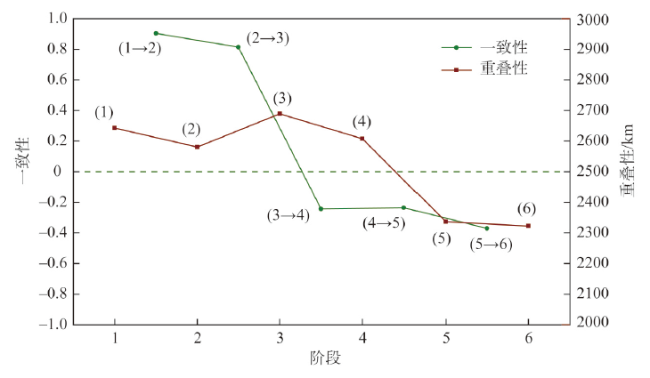
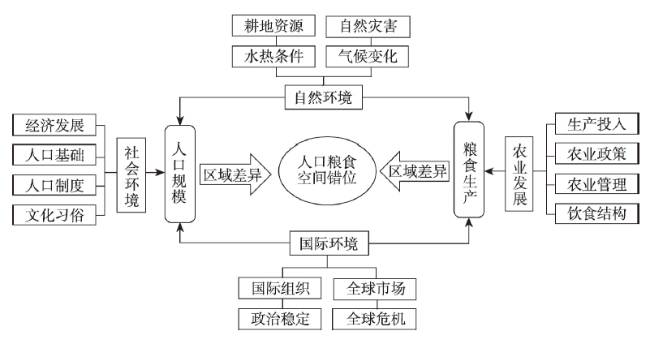
基于重心模型和空间错位指数方法,系统分析了1990—2017年全球人口与粮食的时空格局、空间错位特征及影响因素等。结果表明:(1)近30年来,全球人口与粮食均呈增长态势,两者的时序变化特征存在明显差异,全球人均粮食产量的区域差异特征显著,多数国家的“人粮关系”矛盾突出。(2)在全球尺度,人口与粮食重心存在显著的空间错位特征,两者在空间分布上呈现反向错位发展的态势。(3)在国家尺度,人口与粮食的空间错位格局呈现由南至北依次为“正错位区—负错位区—正错位区”。负向高错位区稳定在印度、日本等国家,正向高错位区稳定在美国、加拿大等国家。(4)全球各大洲人口与粮食的空间错位格局基本稳定,空间错位指数发生转向的国家分布在亚洲、欧洲、南美洲和非洲。(5)自然环境、国际环境、农业发展、社会环境等多种因素综合作用致使人口规模和粮食产量在空间分布上存在区域差异,促成全球人口与粮食的空间错位格局。政策启示:中国有必要加快农业供给侧结构性改革,增强农业竞争力和粮食自给率,合理统筹配置两种资源和处理两个市场之间的关系,建立规避世界粮食贸易波动和不确定性风险的应对策略,构建中国农业生态安全和粮食安全的保障体系。
罗秀丽 , 杨忍 , 徐茜 . 全球人口与粮食的空间错位演变及影响因素分析[J]. 自然资源学报, 2021 , 36(6) : 1381 -1397 . DOI: 10.31497/zrzyxb.20210603
In this paper, the spatial center of gravity model and spatial mismatch index method was applied to systematically analyze the spatio-temporal pattern, spatial mismatch characteristics, and influencing factors of global population and food in 1990-2017. The results showed that: (1) In the past 30 years, the global population and food has showed a growth trend, but their change characteristics are obviously different in temporal distribution. The per capita food production has obvious spatial differences in the world, and the contradiction between population and food in most countries is serious. (2) On the global scale, there is an obvious spatial mismatch between the center of gravity of population and food, which shows a trend of reverse mismatch in spatial distribution. (3) On the national scale, the regional difference of spatial mismatch between population and food is obvious, showing a spatial pattern of "positive mismatch area - negative mismatch area - positive mismatch area" from south to north. Negative high mismatch regions are stable in countries such as India and Japan, and positive high mismatch regions are stable in countries such as the United States and Canada. (4) The spatial mismatch pattern of population and food on all continents is basically stable, and the countries whose spatial mismatch index changes direction are distributed in Asia, Europe, South America and Africa. (5) The combined effect of natural environment, international environment, agricultural development and social factors has obvious regional differences in the spatial distribution of population and food, thus forming a spatial mismatch pattern between global population and food. It is necessary to accelerate the structural reform of agricultural supply side, enhance agricultural competitiveness and food self-sufficiency rate, reasonably allocate and deal with both domestic and international markets and resources, construct countermeasures to avoid fluctuations and uncertainties in world grain trade, and build a guarantee system for China's agricultural ecological security and food security.
Key words: food security; population growth; food production; spatial mismatch; global scale
表1 1990—2017年全球人口与粮食重心计算结果Table 1 The result of spatial center of gravity of global population and food in 1990-2017 |
| 时间段 | 人口重心 | 粮食重心 | |||||
|---|---|---|---|---|---|---|---|
| 距离/km | 方向 | 偏转角度/(°) | 距离/km | 方向 | 偏转角度/(°) | ||
| 第1阶段→第2阶段 | 61.02 | 西南 | -112.13 | 170.18 | 东南 | -86.79 | |
| 第2阶段→第3阶段 | 66.67 | 西南 | -116.36 | 164.92 | 西南 | -151.92 | |
| 第3阶段→第4阶段 | 68.34 | 西南 | -127.50 | 54.93 | 东南 | -23.45 | |
| 第4阶段→第5阶段 | 53.11 | 西南 | -133.73 | 254.30 | 东南 | -30.13 | |
| 第5阶段→第6阶段 | 60.57 | 西南 | -134.02 | 18.19 | 西北 | 114.37 | |
表2 1990—2017年全球人口和粮食高错位国家Table 2 Countries with high spatial mismatch index between global population and food during 1990-2017 |
| 阶段 | 1990—1994年 | 1995—1999年 | 2000—2004年 | 2005—2009年 | 2010—2014年 | 2015—2017年 |
|---|---|---|---|---|---|---|
| 负向高错位区 | 印度(-6.01) | 印度(-6.00) | 印度(-6.43) | 印度(-6.97) | 印度(-6.89) | 印度(-7.54) |
| 日本(-1.56) | 日本(-1.50) | 中国(-2.34) | 日本(-1.40) | 日本(-1.37) | 日本(-1.34) | |
| 中国(-1.51) | 日本(-1.45) | 中国(-1.09) | 尼日利亚(-1.51) | 尼日利亚(-1.52) | ||
| 巴基斯坦(-1.01) | 尼日利亚(-1.05) | 巴基斯坦(-1.17) | 巴基斯坦(-1.27) | |||
| 巴基斯坦(-1.01) | ||||||
| 正向高错位区 | 美国(11.43) | 美国(11.30) | 美国(11.47) | 美国(11.83) | 美国(10.88) | 美国(11.07) |
| 加拿大(2.15) | 澳大利亚(1.27) | 法国(2.08) | 法国(1.82) | 法国(1.67) | 俄罗斯(2.07) | |
| 俄罗斯(2.11) | 加拿大(2.04) | 加拿大(1.67) | 加拿大(1.64) | 加拿大(1.50) | 中国(1.87) | |
| 法国(1.90) | 法国(2.04) | 澳大利亚(1.27) | 俄罗斯(1.52) | 乌克兰(1.38) | 阿根廷(1.63) | |
| 俄罗斯(1.22) | 阿根廷(1.23) | 加拿大(1.55) | ||||
| 阿根廷(1.06) | 澳大利亚(1.12) | 乌克兰(1.52) | ||||
| 俄罗斯(1.11) | 法国(1.34) | |||||
| 澳大利亚(1.07) |
表3 1990—2017年全球人口和粮食空间错位根本性转变国家Table 3 Countries with fundamental change in spatial mismatch index between global population and food during 1990-2017 |
| 国家 | 所属洲 | 空间错位指数 | 方向变化 | |||||
|---|---|---|---|---|---|---|---|---|
| 1990—1994年 | 1995—1999年 | 2000—2004年 | 2005—2009年 | 2010—2014年 | 2015—2017年 | |||
| 中国 | 亚洲 | -1.5111 | -0.0248 | -2.3394 | -1.0925 | 0.3514 | 1.8736 | 负→正 |
| 印度尼西亚 | 亚洲 | -0.6350 | -0.5362 | -0.5080 | -0.4128 | -0.1897 | 0.0023 | 负→正 |
| 柬埔寨 | 亚洲 | -0.0500 | -0.0138 | 0.0066 | 0.1027 | 0.1627 | 0.1479 | 负→正 |
| 朝鲜 | 亚洲 | 0.0356 | -0.2044 | -0.1810 | -0.1714 | -0.1607 | -0.1647 | 正→负 |
| 老挝 | 亚洲 | -0.0056 | -0.0006 | 0.0314 | 0.0612 | 0.0829 | 0.0973 | 负→正 |
| 土库曼斯 | 亚洲 | -0.0232 | -0.0221 | 0.0353 | 0.0126 | -0.0184 | -0.0233 | 负→正→负 |
| 越南 | 亚洲 | -0.1363 | 0.1355 | 0.4349 | 0.4628 | 0.5540 | 0.4192 | 负→正 |
| 吉尔吉斯斯坦 | 亚洲 | -0.0090 | -0.0105 | 0.0003 | -0.0113 | -0.0227 | -0.0217 | 负→正→负 |
| 英国 | 欧洲 | 0.0620 | 0.1338 | 0.0920 | -0.0160 | -0.1002 | -0.0931 | 正→负 |
| 希腊 | 欧洲 | 0.0776 | 0.0490 | 0.0538 | 0.0465 | 0.0263 | -0.0128 | 正→负 |
| 意大利 | 欧洲 | -0.0478 | 0.0362 | 0.0649 | -0.0212 | -0.1285 | -0.2182 | 负→正→负 |
| 黑山 | 欧洲 | 0.2043 | 0.2544 | 0.2005 | -0.0090 | -0.0086 | -0.0082 | 正→负 |
| 巴西 | 南美洲 | -0.7016 | -0.6237 | -0.1436 | -0.0098 | 0.5675 | 0.7531 | 负→正 |
| 巴拉圭 | 南美洲 | -0.0377 | -0.0225 | -0.0113 | 0.0264 | 0.1119 | 0.1555 | 负→正 |
| 马里 | 非洲 | -0.0501 | -0.0535 | -0.0551 | -0.0194 | 0.0149 | 0.0534 | 负→正 |
| [1] |
|
| [2] |
|
| [3] |
|
| [4] |
|
| [5] |
|
| [6] |
|
| [7] |
王祥, 强文丽, 牛叔文, 等. 全球农产品贸易网络及其演化分析. 自然资源学报, 2018,33(6):940-953.
[
|
| [8] |
|
| [9] |
封志明, 赵霞, 杨艳昭. 近50年全球粮食贸易的时空格局与地域差异. 资源科学, 2010,32(1):2-10.
[
|
| [10] |
|
| [11] |
马恩朴, 蔡建明, 林静, 等. 2000—2014年全球粮食安全格局的时空演化及影响因素. 地理学报, 2020,75(2):332-347.
[
|
| [12] |
|
| [13] |
|
| [14] |
|
| [15] |
周墨竹, 王介勇. 基于复杂网络的全球稻米贸易格局演化及其启示. 自然资源学报, 2020,35(5):1055-1067.
[
|
| [16] |
|
| [17] |
|
| [18] |
吴文斌, 唐华俊, 杨鹏, 等. 基于空间模型的全球粮食安全评价. 地理学报, 2010,65(8):907-918.
[
|
| [19] |
|
| [20] |
李忠佩, 李德成, 张桃林. 土地退化对全球粮食安全的威胁及防治对策. 水土保持通报, 2001,21(4):65-69.
[
|
| [21] |
|
| [22] |
|
| [23] |
|
| [24] |
|
| [25] |
曾永明, 张利国. 新经济地理学框架下人口分布对经济增长的影响效应: 全球126个国家空间面板数据的证据: 1992—2012. 经济地理, 2017,37(10):17-26.
[
|
| [26] |
|
| [27] |
|
| [28] |
|
| [29] |
|
| [30] |
|
| [31] |
|
| [32] |
赵霞, 封志明, 杨艳昭. 1961年至2007年全球粮食生产的时空演变特征与地域格局. 资源科学, 2010,32(5):907-916.
[
|
| [33] |
贾琨, 杨艳昭, 封志明. “一带一路”沿线国家粮食生产的时空格局分析. 自然资源学报, 2019,34(6):1135-1145.
[
|
| [34] |
|
| [35] |
刘敏, 张芙蓉, 解智涵. 山西省A级景区与旅游收入的空间错位分析. 地域研究与开发, 2020,39(2):82-87, 93.
[
|
| [36] |
曾通刚, 赵媛. 中国老龄事业发展水平时空演化及其与经济发展水平的空间匹配. 地理研究, 2019,38(6):1497-1511.
[
|
| [37] |
李名升, 张建辉, 罗海江, 等. 经济发展与污染排放的空间错位分析. 生态环境学报, 2013,22(9):1620-1624.
[
|
| [38] |
王美红, 孙根年, 康国栋. 我国自然资本、人力资本与经济资本的空间错位分析. 科学学研究, 2009,27(1):59-65.
[
|
| [39] |
樊杰, 陶岸君, 吕晨. 中国经济与人口重心的耦合态势及其对区域发展的影响. 地理科学进展, 2010,29(1):87-95.
[
|
| [40] |
|
| [41] |
|
| [42] |
|
| [43] |
|
| [44] |
袁平. 国际粮食市场演变趋势及其对中国粮食进出口政策选择的启示. 南京农业大学学报: 社会科学版, 2013,13(1):46-55.
[
|
| [45] |
樊胜根, 张玉梅, 陈志钢. 逆全球化和全球粮食安全思考. 农业经济问题, 2019, (3):4-10.
[
|
| [46] |
李文华, 成升魁, 梅旭荣, 等. 中国农业资源与环境可持续发展战略研究. 中国工程科学, 2016,18(1):56-64.
[
|
/
| 〈 |
|
〉 |
