
煤炭资源型城市环境效率及其环境生产率变动分析──基于山西省11个地级市面板数据
|
李德山(1984- ),男,山西运城人,博士,副教授,研究方向为人口资源与环境。E-mail: lwfaaa3@163.com |
收稿日期: 2019-08-30
要求修回日期: 2020-02-23
网络出版日期: 2021-05-28
基金资助
国家自然科学基金项目(71742004)
教育部人文社科基金项目(19YJC790057)
四川省循环经济研究中心项目(XHJJ-1904)
版权
Change of environmental efficiency and environmental productivity of coal cities: Based on panel data of 11 cities in Shanxi province
Received date: 2019-08-30
Request revised date: 2020-02-23
Online published: 2021-05-28
Copyright
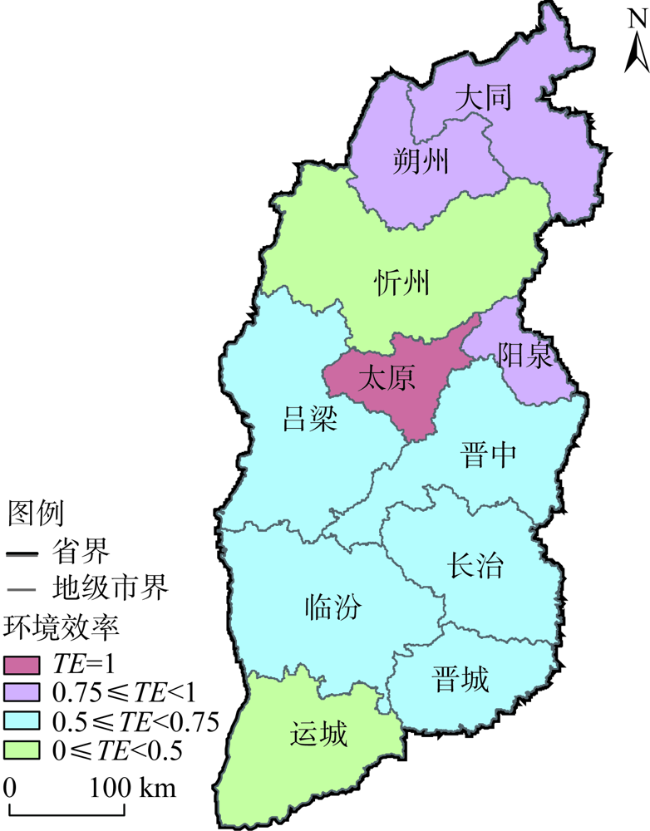
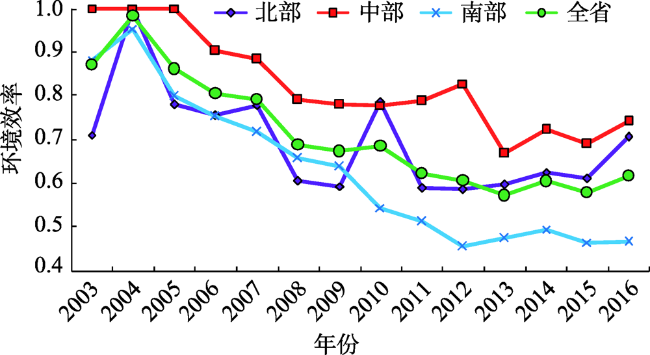
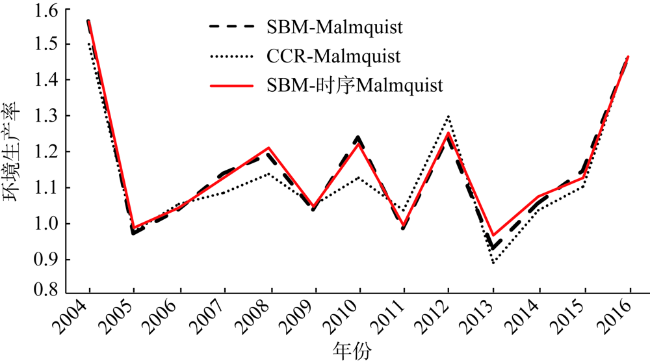
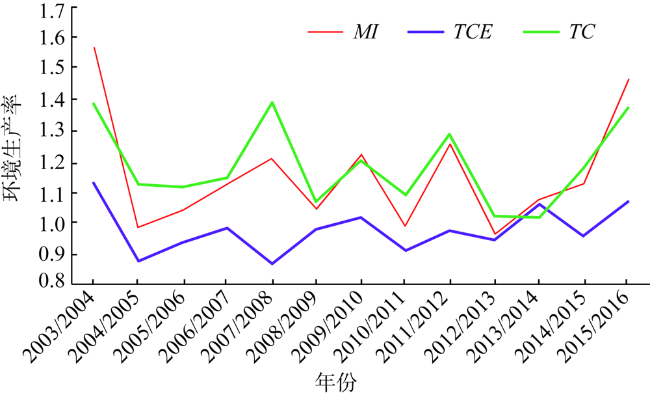
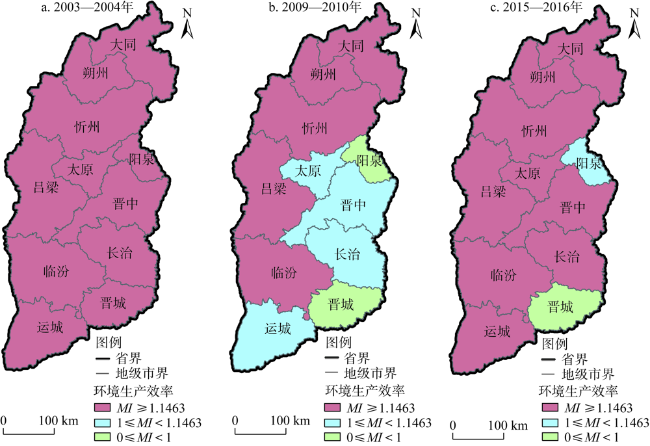
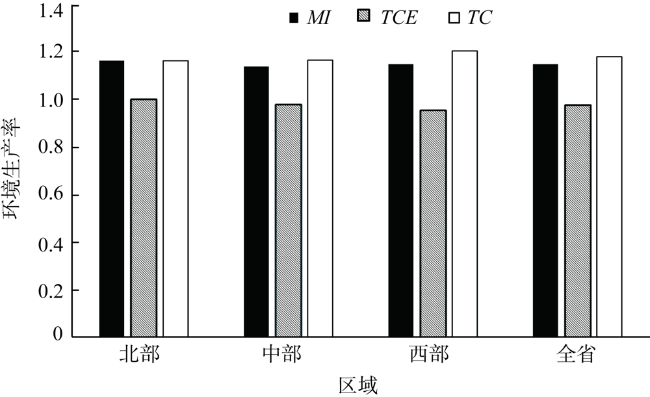
绿色环境效率反映经济发展与资源环境之间的平衡关系,合理评价资源型城市的环境效率对于促进经济高质量发展具有重要的现实意义。首先从异质性环境污染排放角度出发,选取了四种环境压力指标,采用非径向的Slacks Based Model(SBM)模型和Sequential Malmquist指数模型,对山西省2003—2016年11个地级市的环境效率和环境生产率的区域差异及其动态演进进行了深入分析,然后采用固定效应模型、差分广义矩估计模型和面板分位数回归模型分析了环境规制对山西环境生产率的影响。研究结果表明:(1)在维持现有技术水平不变的前提下,山西省整体的环境效率仍有25.31%的改进潜力;中部地区的环境效率值高于北部与南部地区,但是三大区域的环境效率值都呈下降趋势。(2)山西省环境生产率平均每年提高14.63%,其中技术效率对环境生产率的增长表现为负效应,而技术进步是环境生产率提高的主要来源。(3)环境规制与环境生产率之间并不存在正向或者负向的线性关系,而是存在显著的“U”型关系;不同分位点上环境规制对环境生产率变动的影响表现出明显的异质性。
关键词: 煤炭资源型城市; 环境压力; 环境生产率; SBM模型; Sequential Malmquist指数
李德山 , 赵颖文 , 李琳瑛 . 煤炭资源型城市环境效率及其环境生产率变动分析──基于山西省11个地级市面板数据[J]. 自然资源学报, 2021 , 36(3) : 618 -633 . DOI: 10.31497/zrzyxb.20210307
Green environmental efficiency reflects the balance between economic development and resources environment. It is of great practical significance to evaluate the environmental efficiency of resource-based cities comprehensively for promoting high-quality economic development. From the perspective of heterogeneous environmental pollution emissions, this paper selects four environmental pressure indicators, and uses non-radial SBM model and Sequential Malmquist index model to conduct an in-depth analysis of the regional differences and dynamic evolution of environmental efficiency and environmental productivity of 11 cities in Shanxi Province during 2003-2016. Then it adopts the fixed effect model, differential generalized moment estimation model and panel quantile regression model to analyze the impact of environmental regulation on environmental productivity in Shanxi. The results show that: (1) Under the premise of maintaining the existing technology level, the overall environmental efficiency of the study area still has 25.31% potential for improvement; the environmental efficiency value of the central part is higher than that of the northern and southern parts, but the environmental efficiency values of the three regions are declining. (2) The average annual growth rate of environmental productivity is 14.63%. The increase of technical efficiency to environmental productivity shows a "negative effect", and technological progress is the main source of the increase of environmental productivity. (3) There is no linear relationship between environmental regulation and environmental productivity, but there is a significant "U" type relationship. In different quantiles, the impact of environmental regulation on environmental productivity shows significant heterogeneity.
表1 主要指标的统计性描述Table 1 Statistical description of main indicators |
| 变量 | 观测值 | 均值 | Std. Dev. | 最小值 | 最大值 |
|---|---|---|---|---|---|
| 地区生产总值/万元 | 154 | 4637772.00 | 2741752.00 | 1093822.00 | 15300000.00 |
| 煤炭产量/万t | 154 | 6451.01 | 4158.22 | 28.00 | 22091.00 |
| 工业二氧化碳/t | 154 | 95439.75 | 28360.69 | 14328.00 | 183656.00 |
| 工业烟尘/t | 154 | 127149.10 | 483326.00 | 15163.00 | 5168812.00 |
| 工业废水/万t | 154 | 3601.03 | 2301.18 | 458.00 | 14365.00 |
| PM2.5/(μg/m3) | 154 | 27.74 | 6.69 | 15.52 | 51.11 |
表2 2003—2016年山西省环境效率值Table 2 Environmental efficiency values in Shanxi province from 2003 to 2016 |
| 地区/年份 | 2003 | 2004 | 2005 | 2006 | 2007 | 2008 | 2009 | 2010 | 2011 | 2012 | 2013 | 2014 | 2015 | 2016 | 平均 |
|---|---|---|---|---|---|---|---|---|---|---|---|---|---|---|---|
| 大同 | 1.0000 | 1.0000 | 0.9695 | 0.8631 | 1.0000 | 0.6240 | 0.6068 | 1.0000 | 0.5749 | 0.5322 | 0.5480 | 0.6380 | 0.6524 | 1.0000 | 0.7617 |
| 朔州 | 0.4696 | 1.0000 | 1.0000 | 1.0000 | 1.0000 | 1.0000 | 1.0000 | 1.0000 | 1.0000 | 1.0000 | 1.0000 | 1.0000 | 1.0000 | 1.0000 | 0.9474 |
| 忻州 | 0.7641 | 1.0000 | 0.4885 | 0.4995 | 0.4732 | 0.3566 | 0.3439 | 0.4858 | 0.3572 | 0.3797 | 0.3881 | 0.3852 | 0.3509 | 0.3520 | 0.4481 |
| 北部平均 | 0.7106 | 1.0000 | 0.7795 | 0.7554 | 0.7793 | 0.6060 | 0.5931 | 0.7861 | 0.5900 | 0.5869 | 0.5969 | 0.6264 | 0.6117 | 0.7061 | 0.6864 |
| 太原 | 1.0000 | 1.0000 | 1.0000 | 1.0000 | 1.0000 | 1.0000 | 1.0000 | 1.0000 | 1.0000 | 1.0000 | 1.0000 | 1.0000 | 1.0000 | 1.0000 | 1.0000 |
| 阳泉 | 1.0000 | 1.0000 | 1.0000 | 0.7977 | 0.8401 | 1.0000 | 1.0000 | 0.6190 | 0.7952 | 1.0000 | 1.0000 | 1.0000 | 1.0000 | 1.0000 | 0.9238 |
| 吕梁 | 1.0000 | 1.0000 | 1.0000 | 1.0000 | 0.7299 | 0.5752 | 0.5563 | 1.0000 | 1.0000 | 1.0000 | 0.4856 | 0.4762 | 0.4292 | 0.3913 | 0.7147 |
| 晋中 | 1.0000 | 1.0000 | 1.0000 | 0.8342 | 1.0000 | 0.6842 | 0.6679 | 0.5953 | 0.4852 | 0.4704 | 0.4092 | 0.5716 | 0.5318 | 0.7764 | 0.6850 |
| 中部平均 | 1.0000 | 1.0000 | 1.0000 | 0.9032 | 0.8849 | 0.7921 | 0.7807 | 0.7791 | 0.7881 | 0.8282 | 0.6677 | 0.7223 | 0.6912 | 0.7424 | 0.8201 |
| 长治 | 1.0000 | 1.0000 | 0.7739 | 0.7575 | 0.7986 | 0.7431 | 0.7047 | 0.6109 | 0.4897 | 0.4644 | 0.4714 | 0.5219 | 0.5319 | 0.5581 | 0.6516 |
| 临汾 | 1.0000 | 1.0000 | 1.0000 | 1.0000 | 0.8800 | 0.6036 | 0.5538 | 0.6667 | 0.5409 | 0.4095 | 0.4990 | 0.5645 | 0.5252 | 0.5933 | 0.6718 |
| 运城 | 0.6082 | 0.8281 | 0.5288 | 0.4231 | 0.4094 | 0.4186 | 0.4273 | 0.3852 | 0.4912 | 0.4563 | 0.4544 | 0.3802 | 0.3362 | 0.4296 | 0.4578 |
| 晋城 | 1.0000 | 1.0000 | 1.0000 | 1.0000 | 0.9248 | 1.0000 | 1.0000 | 0.5578 | 0.5325 | 0.4937 | 0.4786 | 0.5364 | 0.5006 | 0.3312 | 0.6920 |
| 南部平均 | 0.8831 | 0.9540 | 0.7998 | 0.7524 | 0.7182 | 0.6582 | 0.6390 | 0.5439 | 0.5131 | 0.4549 | 0.4756 | 0.4951 | 0.4657 | 0.4659 | 0.6102 |
| 平均 | 0.8708 | 0.9830 | 0.8614 | 0.8050 | 0.7923 | 0.6884 | 0.6735 | 0.6854 | 0.6230 | 0.6063 | 0.5724 | 0.6056 | 0.5791 | 0.6182 | 0.7016 |
表3 2003—2016年山西省年环境生产率变动Table 3 Changes in environmental productivity in Shanxi province from 2003 to 2016 |
| 地区/年份 | 2004 | 2005 | 2006 | 2007 | 2008 | 2009 | 2010 | 2011 | 2012 | 2013 | 2014 | 2015 | 2016 | 平均 |
|---|---|---|---|---|---|---|---|---|---|---|---|---|---|---|
| 大同 | 1.3385 | 0.9882 | 0.8947 | 1.3046 | 1.0224 | 1.0150 | 1.8516 | 0.7760 | 1.1218 | 1.0409 | 1.1643 | 1.1722 | 2.0924 | 1.1698 |
| 朔州 | 3.1672 | 1.0116 | 1.1570 | 1.2872 | 1.2938 | 1.1311 | 1.2297 | 1.0711 | 1.3120 | 1.0191 | 1.0110 | 1.0821 | 1.3036 | 1.2465 |
| 忻州 | 1.8818 | 0.5011 | 1.0662 | 1.1100 | 0.9443 | 1.0231 | 1.6725 | 0.7855 | 1.2835 | 1.0225 | 1.0154 | 1.0396 | 1.2496 | 1.0714 |
| 北部平均 | 1.9981 | 0.7942 | 1.0335 | 1.2307 | 1.0770 | 1.0551 | 1.5616 | 0.8675 | 1.2362 | 1.0274 | 1.0612 | 1.0966 | 1.5049 | 1.1603 |
| 太原 | 1.3895 | 1.1063 | 1.1014 | 1.1175 | 1.2587 | 1.0367 | 1.1390 | 1.0321 | 1.0629 | 1.0568 | 1.0425 | 1.3223 | 1.4393 | 1.1544 |
| 阳泉 | 1.5602 | 1.0103 | 0.9865 | 1.2788 | 1.7479 | 1.0486 | 0.6732 | 1.3858 | 1.6253 | 1.0095 | 1.0050 | 1.0632 | 1.0239 | 1.1493 |
| 吕梁 | 1.3209 | 1.1517 | 1.2431 | 0.8085 | 1.0479 | 1.0255 | 2.0356 | 1.0290 | 2.1417 | 0.4856 | 0.9913 | 0.9740 | 1.1552 | 1.1124 |
| 晋中 | 1.3081 | 1.0877 | 0.8471 | 1.3741 | 1.0048 | 1.0602 | 1.0415 | 0.8781 | 1.1261 | 0.8728 | 1.4244 | 1.0913 | 2.0361 | 1.1321 |
| 中部平均 | 1.3912 | 1.0878 | 1.0342 | 1.1225 | 1.2337 | 1.0427 | 1.1291 | 1.0662 | 1.4287 | 0.8200 | 1.1029 | 1.1056 | 1.3645 | 1.1369 |
| 长治 | 1.3610 | 0.8078 | 1.0398 | 1.2409 | 1.2880 | 0.9917 | 1.0284 | 0.8646 | 1.1367 | 1.0237 | 1.1443 | 1.1952 | 1.7013 | 1.1200 |
| 临汾 | 1.3104 | 1.2680 | 1.2273 | 0.9425 | 1.1342 | 0.9298 | 1.5774 | 0.8488 | 0.8760 | 1.2548 | 1.1449 | 1.1826 | 1.8833 | 1.1689 |
| 运城 | 1.7468 | 1.1481 | 0.9504 | 1.1001 | 1.2791 | 1.0814 | 1.0412 | 1.2757 | 1.0399 | 1.041 | 0.8435 | 1.1572 | 1.8372 | 1.1674 |
| 晋城 | 1.4772 | 1.0142 | 1.0314 | 0.9679 | 1.4759 | 1.1832 | 0.8589 | 1.1444 | 1.4607 | 1.0055 | 1.1231 | 1.1410 | 0.9640 | 1.1256 |
| 南部平均 | 1.4647 | 1.0450 | 1.0576 | 1.0564 | 1.2887 | 1.0422 | 1.0975 | 1.0174 | 1.1090 | 1.0768 | 1.0555 | 1.1688 | 1.5434 | 1.1453 |
| 平均 | 1.5646 | 0.9839 | 1.0424 | 1.1259 | 1.2078 | 1.0459 | 1.2209 | 0.9909 | 1.2525 | 0.9629 | 1.0741 | 1.1257 | 1.4657 | 1.1463 |
表4 主要变量的统计性描述Table 4 Statistical description of main variables |
| 变量 | 观测值 | 均值 | Std. Dev. | 最小值 | 最大值 |
|---|---|---|---|---|---|
| MI | 143 | 1.184 | 0.332 | 0.486 | 3.167 |
| ER | 143 | 1.090 | 1.567 | 0.017 | 8.197 |
| agdp | 143 | 17174.45 | 8170.548 | 4199.384 | 45410.11 |
| endow | 143 | 0.17 | 0.177 | 0 | 0.516 |
| emstr | 143 | 55.023 | 16.179 | 27.24 | 91.26 |
| trans | 143 | 43.932 | 28.919 | 6.904 | 142.042 |
| fdi | 143 | 0.036 | 0.035 | 0.001 | 0.154 |
| gov | 143 | 0.389 | 0.753 | 0.08 | 4.035 |
| pd | 143 | 282.09 | 132.426 | 24.42 | 531.02 |
| fin | 143 | 0.179 | 0.349 | 0.007 | 2.043 |
| indus | 143 | 54.739 | 8.53 | 36.12 | 73.71 |
表5 基本回归结果Table 5 Basic regression results |
| 变量 | (1) | (2) | (3) | (4) | (5) |
|---|---|---|---|---|---|
| ER | 0.129** | -0.236** | -0.218* | -0.209** | -0.273 |
| (2.035) | (-2.599) | (-2.021) | (-2.312) | (-1.382) | |
| ER2 | — | 0.0430*** | 0.0423*** | 0.0350*** | 0.0415*** |
| — | (6.537) | (6.087) | (4.869) | (3.253) | |
| lnagdp | -0.433 | -0.215 | -1.153 | 1.645 | 2.444 |
| (-1.221) | (-0.625) | (-0.749) | (1.617) | (0.652) | |
| lnagdp2 | — | — | 0.0500 | -0.105* | -0.136 |
| — | — | (0.599) | (-1.837) | (-0.855) | |
| endow | 1.170* | 1.423** | 1.423*** | 1.095** | 1.208 |
| (1.911) | (3.126) | (3.227) | (2.446) | (1.631) | |
| emstr | 0.00811* | 0.00881*** | 0.00917*** | 0.00671** | 0.0139* |
| (1.877) | (4.884) | (4.216) | (3.121) | (2.022) | |
| trans | 0.00182 | 0.00133 | 0.00154 | 0.00331*** | 0.00385*** |
| (1.144) | (1.369) | (1.450) | (3.526) | (3.152) | |
| fdi | -0.360 | -0.500 | -0.605 | -1.013 | -3.656 |
| (-0.318) | (-0.432) | (-0.493) | (-0.881) | (-1.241) | |
| gov | -0.494*** | -0.692*** | -0.690*** | -0.717*** | -0.859*** |
| (-3.129) | (-8.321) | (-8.388) | (-9.352) | (-3.880) | |
| lnpd | -2.353** | -1.738*** | -1.842*** | -0.926 | -1.059 |
| (-2.012) | (-3.945) | (-4.124) | (-1.304) | (-0.997) | |
| lnfin | 0.252 | 0.187 | 0.175 | 0.249 | 0.343 |
| (1.179) | (0.938) | (0.832) | (1.140) | (0.773) | |
| indus | -0.0120** | -0.0114* | -0.0106* | -0.00556 | -0.0199 |
| (-2.185) | (-2.057) | (-1.954) | (-0.709) | (-1.102) | |
| L.lnMI | — | — | — | -0.263*** | -0.197** |
| — | — | — | (-3.699) | (-2.302) | |
| 城市效应 | — | — | — | 控制 | 控制 |
| 时间效应 | — | — | — | 控制 | 控制 |
| 观测值 | 143 | 143 | 143 | 132 | 121 |
注:1. *、**、***分别表示在10%、5%、1%的水平下显著,下同。2. 为了尽可能减少异方差的影响,MI、agdp、pd和fin都取了对数。3. 在回归分析时使用的是聚类稳健标准误。4.“—”表示没有控制该变量。 |
表6 面板分位数模型回归结果Table 6 Regression results of panel quantile model |
| 变量 | (1) | (2) | (3) | (4) | (5) |
|---|---|---|---|---|---|
| ER | 0.132*** | -0.0642*** | -0.0333 | -0.172*** | -0.0400 |
| (203.8) | (-12.51) | (-0.793) | (-4.139) | (-0.873) | |
| ER2 | 0.00163*** | 0.0132*** | 0.00766* | 0.0342*** | 0.0312*** |
| (26.99) | (19.06) | (1.733) | (7.104) | (5.241) | |
| lnagdp | 0.312*** | 0.655*** | -3.145*** | -6.130*** | -3.007*** |
| (148.8) | (5.223) | (-5.725) | (-5.067) | (-4.625) | |
| lnagdp2 | -0.0243*** | -0.0334*** | 0.163*** | 0.315*** | 0.156*** |
| (-232.1) | (-4.995) | (6.236) | (4.893) | (4.736) | |
| endow | -0.226*** | -0.0123 | 0.319*** | 0.527*** | 0.646*** |
| (-127.1) | (-0.644) | (3.345) | (4.761) | (8.241) | |
| emstr | 0.00108*** | 0.00156*** | 0.00356*** | 0.00607*** | 0.00689*** |
| (125.4) | (3.994) | (5.121) | (4.358) | (4.386) | |
| trans | -0.000249*** | 4.95e-05 | 0.000644 | -0.000525* | -0.00166** |
| (-28.18) | (0.686) | (1.022) | (-1.834) | (-2.094) | |
| fdi | -0.474*** | -0.119 | -1.106*** | -0.390 | -0.657*** |
| (-198.3) | (-1.484) | (-3.909) | (-1.057) | (-3.425) | |
| gov | -0.671*** | -0.123*** | -0.120*** | -0.322*** | -0.622*** |
| (-2,899) | (-10.73) | (-10.81) | (-12.12) | (-19.82) | |
| lnpd | -0.281*** | -0.0668*** | -0.0430* | -0.0816*** | -0.236*** |
| (-383.9) | (-8.127) | (-1.668) | (-3.187) | (-10.43) | |
| lnfin | 0.0851*** | 0.0264*** | 0.0393* | 0.0259 | -0.0545** |
| (372.4) | (5.316) | (1.883) | (1.510) | (-2.207) | |
| indus | -0.00428*** | -0.00253*** | 0.00384*** | 0.00463*** | -0.0103*** |
| (-175.1) | (-8.926) | (2.520) | (2.595) | (-5.591) | |
| 观测值 | 143 | 143 | 143 | 143 | 143 |
| [1] |
Eco-efficiency indicators and reporting: Report on the status of the project (A basis 11 for the final printed report).Eco-efficiency Metrics and Reporting.. Geneva: WBCSD, 2000.
|
| [2] |
王兆峰, 刘庆芳. 长江经济带旅游生态效率时空演变及其与旅游经济互动响应. 自然资源学报, 2019,34(9):1945-1961.
[
|
| [3] |
史丹, 王俊杰. 基于生态足迹的中国生态压力与生态效率测度与评价. 中国工业经济, 2016, ( 5):7-23.
[
|
| [4] |
罗能生, 李佳佳, 罗富政. 中国城镇化进程与区域生态效率关系的实证研究. 中国人口·资源与环境, 2013,23(11):55-62.
[
|
| [5] |
邹炎平, 于瑛英, 唐孝文, 等. 基于DEA模型的中国区域能源与环境效率评估. 数学的实践与认识, 2019, ( 18):98-109.
[
|
| [6] |
|
| [7] |
|
| [8] |
|
| [9] |
杨文举. 中国省份工业的环境绩效影响因素: 基于跨期DEA-Tobit模型的经验分析. 北京理工大学学报: 社会科学版, 2015,17(2):40-48.
[
|
| [10] |
汪克亮, 孟祥瑞, 杨宝臣. 生态压力、生态技术差距与地区生态经济效率: 基于2006—2015年中国省际面板数据的实证分析. 山西财经大学学报, 2017,39(12):1-14.
[
|
| [11] |
|
| [12] |
|
| [13] |
|
| [14] |
|
| [15] |
李占风, 张建. 资源环境约束下中国工业环境技术效率的地区差异及动态演. 统计研究, 2018,35(12):45-55.
[
|
| [16] |
黄建欢, 方霞, 黄必红. 中国城市生态效率空间溢出的驱动机制: 见贤思齐VS见劣自缓. 中国软科学, 2018, ( 3):97-109.
[
|
| [17] |
白雪洁, 汪海凤, 闫文凯. 资源衰退、科教支持与城市转型: 基于坏产出动态SBM模型的资源型城市转型效率研究. 中国工业经济, 2014, ( 11):30-43.
[
|
| [18] |
肖滢, 卢丽文. 资源型城市工业绿色转型发展测度: 基于全国108个资源型城市的面板数据分析. 财经科学, 2019, ( 9):86-98.
[
|
| [19] |
陈诗一. 能源消耗、二氧化碳排放与中国工业的可持续发展. 经济研究, 2009, ( 4):41-55.
[
|
| [20] |
|
| [21] |
邓翔, 李德山, 李双强, 等. 价格扭曲、资源错配与全要素生产率. 软科学, 2017,31(9):25-29.
[
|
| [22] |
聂雷, 郭忠兴, 彭冲. 基于SBM-Undesirable和Meta-frontier模型的城市建设用地利用效率研究. 资源科学, 2017,39(5):836-845.
[
|
| [23] |
|
| [24] |
刘悦, 汪克亮, 史利娟, 等. 中国省域生态效率的时空差异、要素分解与节能减排潜力. 安徽理工大学学报: 社会科学版, 2018,85(2):35-43.
[
|
| [25] |
|
| [26] |
金刚, 沈坤荣. 以邻为壑还是以邻为伴? 环境规制执行互动与城市生产率增长. 管理世界, 2018,34(12):43-55.
[
|
| [27] |
|
| [28] |
何爱平, 安梦天. 地方政府竞争、环境规制与绿色发展效率. 中国人口·资源与环境, 2019,29(3):21-30.
[
|
| [29] |
陈菁泉, 刘伟, 杜重华. 环境规制下全要素生产率逆转拐点的空间效应: 基于省际工业面板数据的验证. 经济理论与经济管理, 2016, ( 5):57-67.
[
|
| [30] |
王杰, 刘斌. 环境规制与企业全要素生产率: 基于中国工业企业数据的经验分析. 中国工业经济, 2014, ( 3):44-56.
[
|
| [31] |
董直庆, 王辉. 环境规制的“本地—邻地”绿色技术进步效应. 中国工业经济, 2019, ( 1):100-118.
[
|
| [32] |
斯日吉模楞, 毛培. 资源型地区自然资源对经济增长影响的实证分析: 基于2000—2016年中国重点煤炭城市样本. 自然资源学报, 2019,34(12):2491-2503.
[
|
| [33] |
|
| [34] |
杜龙政, 赵云辉, 陶克涛, 等. 环境规制、治理转型对绿色竞争力提升的复合效应: 基于中国工业的经验证据. 经济研究, 2019,54(10):106-120.
[
|
| [35] |
|
/
| 〈 |
|
〉 |