
农业产业化经营项目空间分布及驱动因素分析——以京津冀地区为例
|
陈凡(1989- ),女,河北石家庄人,博士研究生,主要从事农业资源区划研究。E-mail: 965087205@qq.com |
收稿日期: 2019-08-01
要求修回日期: 2019-10-21
网络出版日期: 2021-04-28
基金资助
财政部农业研究专项(2017-40)
版权
Spatial distribution of agricultural industrialization operation projects and its driving factors in Beijing-Tianjin-Hebei region
Received date: 2019-08-01
Request revised date: 2019-10-21
Online published: 2021-04-28
Copyright
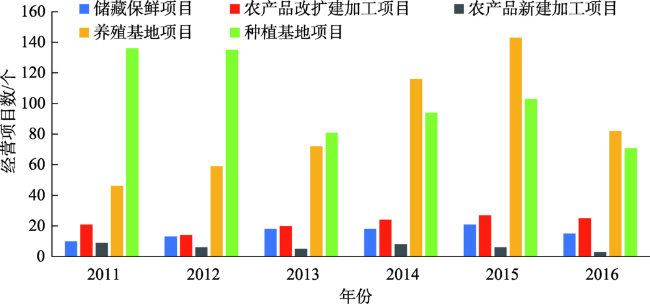
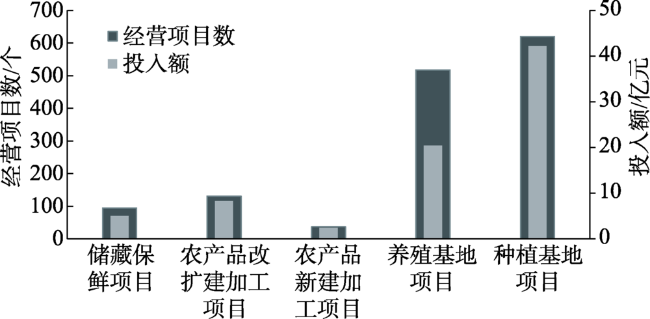
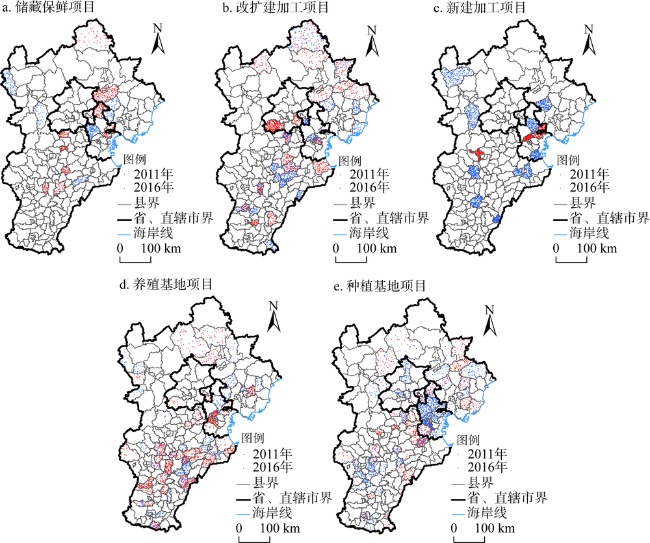
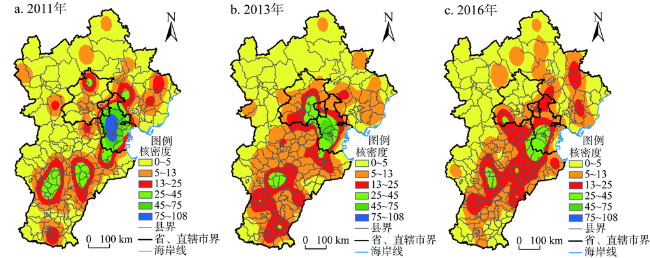
农业产业化经营项目是农业产业发展基础,是京津冀协同发展下调整农业产业结构、提高农业综合生产能力的重要内容。基于京津冀地区2011—2016年数据,利用核密度指数等方法研究产业化经营项目的空间分布及影响因素。结果显示:(1)京津冀地区农业产业化经营项目形成“斜一字型”核密度分布结构,密度由中部向东北、西南方向递减;(2)种植基地项目主要分布在河北省西南部、天津东部,养殖基地项目主要集中在河北省南部、天津市中部,储藏保鲜项目、改扩建加工项目分别向京津冀地区中北、东北方向迁移;(3)农业机械总动力、年末金融机构各项贷款余额是经营项目空间分布格局重要的影响因素,分别在农业发展“硬件”条件、配套资金供给方面影响经营项目分布。
陈凡 , 郭剑 , 栗欣如 , 李建平 . 农业产业化经营项目空间分布及驱动因素分析——以京津冀地区为例[J]. 自然资源学报, 2021 , 36(2) : 513 -524 . DOI: 10.31497/zrzyxb.20210219
Operation projects are the bases of agricultural industry development. What's more, they are important contents of adjusting agricultural industrial structure and improving agricultural comprehensive production capacity under the background of collaborative development in the Beijing-Tianjin-Hebei region. Based on the data of agricultural industrialization management projects in the study area from 2011 to 2016, this paper analyzes the spatial distribution and influencing factors using nuclear density index and other analysis methods. The results showed that: (1) The spatial distribution of operation projects formed an "oblique line" structure nuclear density, which declined from the central part to northeast and southwest. (2) Planting base projects were mainly distributed in southwest Hebei province and east Tianjin maunicipality, and breeding base projects were mainly in south Hebei and central Tianjin. Storage and fresh preservation projects as well as reconstruction and expansion processing projects were respectively transferred to the central north and northeast of the Beijing-Tianjin-Hebei region. (3) The distribution of operation projects were influenced by the total power of agricultural machinery and loan balance of financial institutions, which directly affected the "hardware" conditions of agricultural development and the supply of supporting funds.
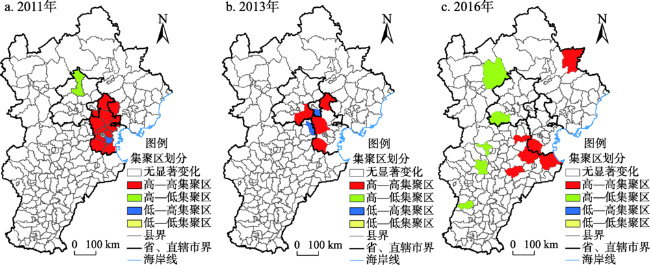
表1 京津冀地区经营项目全局Moran's I指数Table 1 Overall Moran's I index of operation projects in the Beijing-Tianjin-Hebei region |
| 年份 | Moran's I指数 | Z检验值 | 显著性水平 | 空间结构类型 |
|---|---|---|---|---|
| 2011 | 0.308057 | 7.894073 | 0.01 | 集聚型 |
| 2012 | 0.127197 | 3.293039 | 0.01 | 集聚型 |
| 2013 | 0.155715 | 3.963021 | 0.01 | 集聚型 |
| 2014 | 0.169022 | 4.270417 | 0.01 | 集聚型 |
| 2015 | 0.119545 | 3.020926 | 0.01 | 集聚型 |
| 2016 | 0.121237 | 3.062449 | 0.01 | 集聚型 |
表2 数据描述性统计特征Table 2 Descriptive statistical characteristics of data |
| 变量名称 | 单位 | 符号 | 均值 | 标准差 | 最小值 | 最大值 | 观测值 |
|---|---|---|---|---|---|---|---|
| 项目数量 | 个 | N | 0.69 | 0.62 | 0.00 | 2.64 | 768 |
| 固定资产投资额 | 万元 | far | 13.82 | 0.71 | 11.60 | 15.93 | 768 |
| 农业机械总动力 | 万kW | mach | 4.04 | 0.71 | 0.00 | 5.56 | 768 |
| 年末金融机构各项贷款余额 | 万元 | sav | 13.28 | 0.82 | 11.33 | 16.48 | 768 |
| 第一产业从业人员占比 | % | popstruc | 0.58 | 0.13 | 0.17 | 1.00 | 768 |
| 受教育程度 | % | edu | 0.12 | 0.02 | 0.05 | 0.19 | 768 |
| 固定电话用户 | 户 | inform | 10.71 | 0.78 | 8.07 | 13.46 | 768 |
| 公共财政支出占地区GDP比例 | % | fprop | 1.90 | 47.91 | 0.01 | 1327.77 | 768 |
注:表中为处理后的数据。 |
表3 固定效应回归模型结果Table 3 Regression model results of fixed effect |
| 固定效应模型 | 模型1 | 模型2 | 模型3 | 模型4 | 模型5 | 模型6 | 模型7 |
|---|---|---|---|---|---|---|---|
| far | 0.126** (2.30) | 0.138** (2.49) | -0.063 (-0.66) | -0.075 (-0.77) | -0.104 (-1.03) | -0.105 (-1.05) | -0.106 (-1.06) |
| mach | 0.101 (1.33) | 0.137* (1.79) | 0.135* (1.75) | 0.155** (1.98) | 0.167** (2.07) | 0.164** (2.03) | |
| sav | 0.253*** (2.58) | 0.239** (2.36) | 0.250** (2.46) | 0.241** (2.34) | 0.239** (2.32) | ||
| popstruc | 0.114 (0.52) | 0.170 (0.76) | 0.150 (0.67) | 0.151 (0.67) | |||
| edu | 2.775 (1.33) | 2.654 (1.26) | 2.651 (1.26) | ||||
| inform | -0.049 (-0.66) | -0.049 (-0.66) | |||||
| fpop | -0.0003 (-0.71) | ||||||
| 常数项 | -1.044 (-1.38) | -1.621* (-1.86) | -2.352*** (-2.58) | -2.062* (-1.93) | -2.245** (-2.08) | -1.605 (-1.10) | -1.539 (-1.06) |
| R2 | 0.008 | 0.011 | 0.021 | 0.022 | 0.024 | 0.025 | 0.026 |
注:***、**、*分别表示在1%、5%、10%水平下显著;括号内数据为t值;空白项为未加入的变量。 |
| [1] |
王洪桥, 袁家冬, 孟祥君. 东北地区A级旅游景区空间分布特征及影响因素. 地理科学, 2017,37(6):895-903.
[
|
| [2] |
李荣生. 资源环境约束下的西北农业结构调整与产业化发展对策. 自然资源学报, 2002,17(5):737-742.
[
|
| [3] |
贾琨, 杨艳昭, 封志明. “一带一路”沿线国家粮食生产的时空格局分析. 自然资源学报, 2019,34(6):1135-1145.
[
|
| [4] |
黄红球. 农业产业化经营评价指标体系设置及评价方法研究: 基于广东省的证据. 农业技术经济, 2013, (7):110-117.
[
|
| [5] |
郭海丽, 王礼力, 李敏. 农业综合开发产业化经营项目投资绩效评价: 基于灰色综合关联度的分析. 西北农林科技大学学报: 社会科学版, 2012,12(5):53-60.
[
|
| [6] |
郭海丽, 王礼力, 李敏. 资金来源方式与农民收入的动态关系研究: 以农业综合开发产业化经营项目为例. 软科学, 2012,26(7):81-85.
[
|
| [7] |
田祥宇, 孔荣. 农业综合开发产业化经营项目投资绩效分析: 基于农民收入促进作用的视角. 财政研究, 2010, (7):64-67.
[
|
| [8] |
田祥宇, 孔荣. 农业综合开发产业化经营项目投资绩效分析: 基于资金拉动效应的视角. 西北农林科技大学学报: 社会科学版, 2010,10(3):28-31.
[
|
| [9] |
万伦来, 周莹, 高翔. 中国农业综合开发产业化经营财政支出的受益归宿分析: 来自1997—2011年安徽省农业综合开发产业化经营的经验证据. 中国农村经济, 2013, (12):60-71.
[
|
| [10] |
杨安文, 潘泽江, 陈池波. 农业综合开发投入促进农民增收的实证分析. 统计与决策, 2013, (10):105-107.
[
|
| [11] |
刘玉, 潘瑜春, 唐林楠. 京津冀地区县域农业发展与农民收入的时空耦合特征. 经济地理, 2017,37(2):141-147.
[
|
| [12] |
李蕊. 京津冀农业产业协同发展信托机制的法律构造. 中国政法大学学报, 2018, (1):144-155.
[
|
| [13] |
谢宏, 李颖灏, 韦有义. 浙江省特色小镇的空间结构特征及影响因素研究. 地理科学, 2018,38(8):1283-1291.
[
|
| [14] |
纪小美, 陶卓民, 陈金华, 等. 中国国际旅游省份差异的时空交互特征: 基于主要客源市场的对比. 地理研究, 2016,35(2):363-376.
[
|
| [15] |
王洪桥, 孟祥君, 孙浩亮, 等. 吉林省旅游资源的基本特征及空间结构分析. 干旱区资源与环境, 2012,26(7):190-194.
[
|
| [16] |
|
| [17] |
闫庆武, 卞正富. 基于GIS-SDA的居民点空间分布研究. 地理与地理信息科学, 2008,24(3):57-61.
[
|
| [18] |
方叶林, 黄震方, 李经龙, 等. 中国特色小镇的空间分布及其产业特征. 自然资源学报, 2019,34(6):1273-1284.
[
|
| [19] |
杨晓, 刘爱民, 贾盼娜, 等. 中国大豆压榨企业空间格局及其演变机制. 自然资源学报, 2019,34(7):1440-1456.
[
|
| [20] |
梁晨霞, 王艳慧, 徐海涛, 等. 贫困村空间分布及影响因素分析: 以乌蒙山连片特困区为例. 地理研究, 2019,38(6):1389-1402.
[
|
| [21] |
龙飞, 刘家明, 朱鹤, 等. 长三角地区民宿的空间分布及影响因素. 地理研究, 2019,38(4):950-960.
[
|
/
| 〈 |
|
〉 |