
河北省大气污染时空变化特征及其影响因素
|
何振芳(1983- ),女,山东泰安人,博士,讲师,研究方向为GIS与RS应用。E-mail: hezhenfang@lcu.edu.cn |
收稿日期: 2019-09-12
要求修回日期: 2020-05-09
网络出版日期: 2021-04-28
基金资助
国家自然科学基金项目(41472162)
山东省社科规划研究项目(18CKPJ34)
山东省高等学校人文社会科学计划项目(J18RA196)
黄土与第四纪地质国家重点实验室开放基金资助项目(SKLLQG1907)
版权
Spatio-temporal variation characteristics of air pollution and influencing factors in Hebei province
Received date: 2019-09-12
Request revised date: 2020-05-09
Online published: 2021-04-28
Copyright
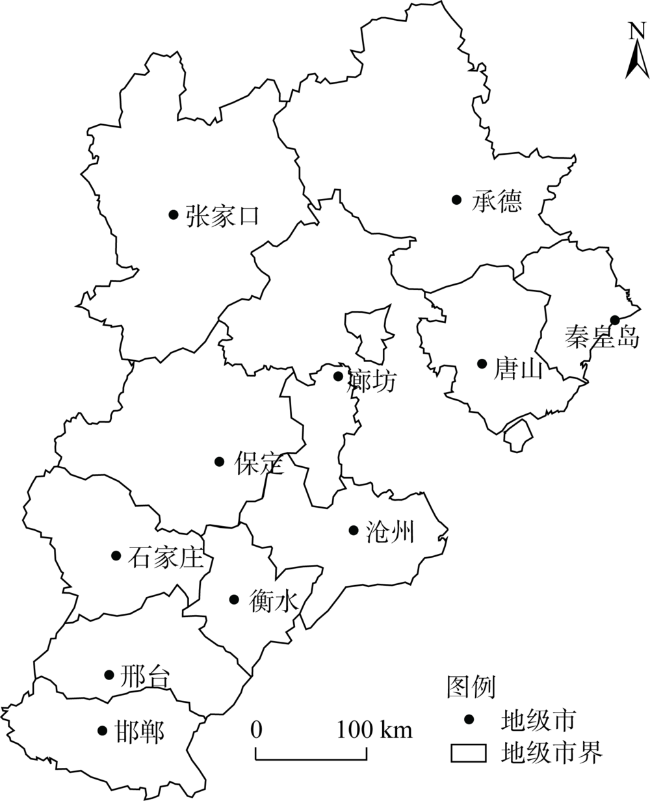
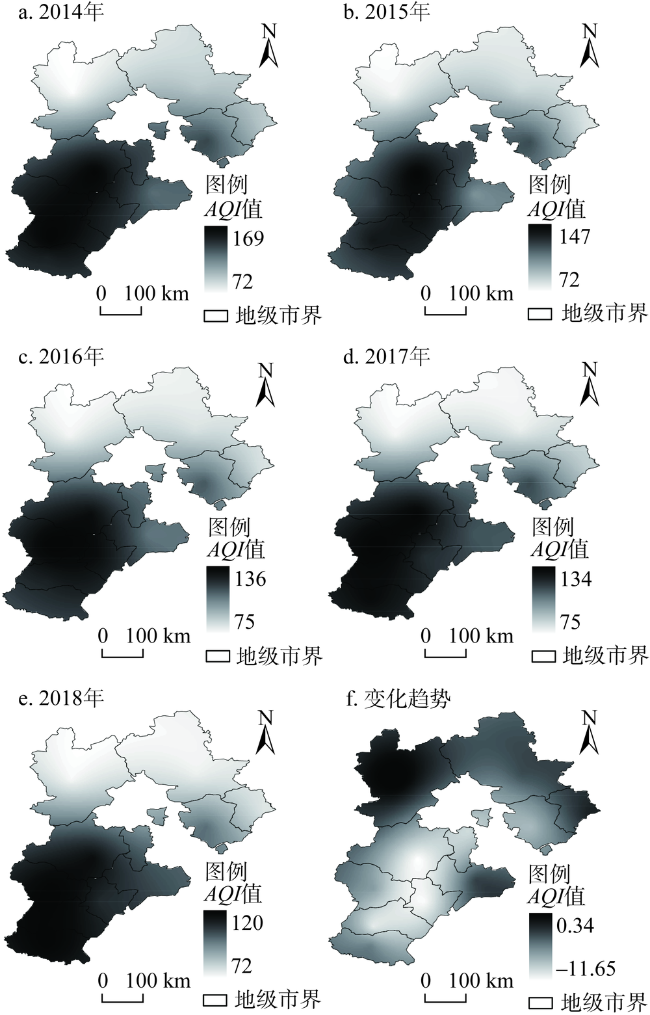
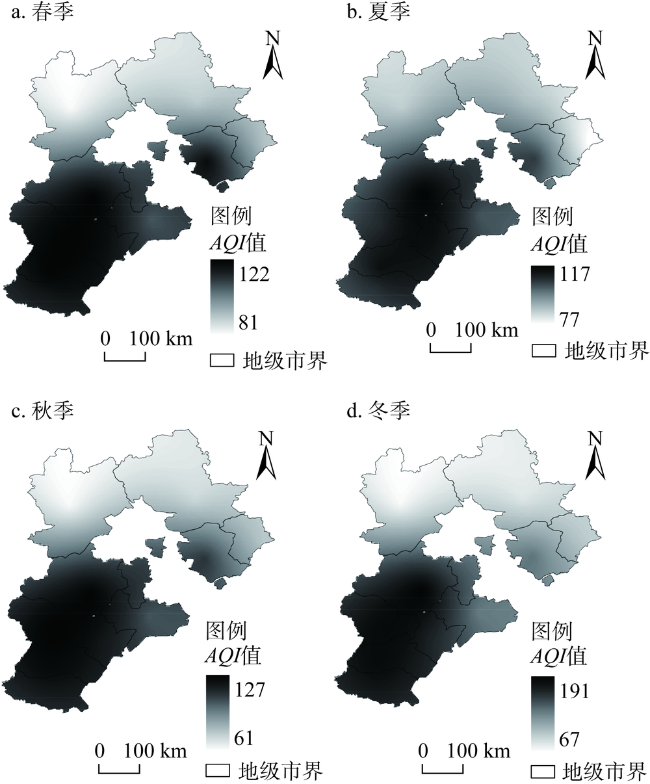
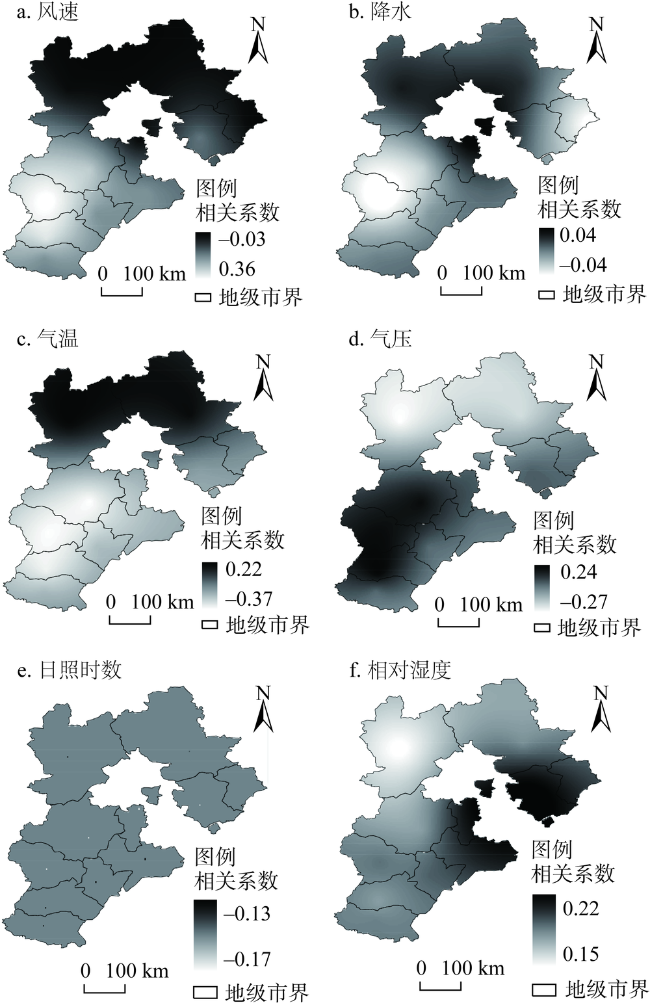
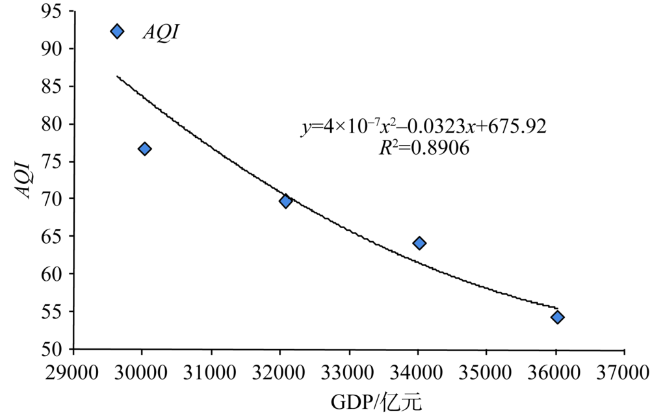
河北省是中国污染最严重的省份,研究该省大气污染的时空变化与影响因素具有十分重要的意义。利用逐日空气质量指数(AQI)、气象要素观测资料以及社会经济数据,统计分析与空间分析法结合分析了河北省AQI时空变化特征及其与影响因素的定量关系。结果表明:河北省大气污染主要发生在中西部和南部,尤以邯郸、邢台与石家庄等地最为严重,北部地区相对较少。河北省AQI总体呈现逐年减少的趋势,2014—2018年河北省平均AQI线性趋势为-8.845/年,而且与风速、气温、降水、GDP、人口、电力消耗量和第二产业呈现显著负相关关系,而和NOx与SO2的排放量呈正相关。气候条件是河北省大气污染的诱导因素,而人为排放是河北省大气重污染的主要因素。随着河北经济的飞速发展,大气污染综合防治经费的投入增加,河北省经济增长与环境污染处于反向阶段,大气污染与经济发展的非线性关系早已过了环境库兹涅兹曲线(EKC)“拐点”。研究结果可为河北省空气污染治理提供理论依据。
何振芳 , 郭庆春 , 刘加珍 , 张莹莹 , 刘杰 , 丁航 . 河北省大气污染时空变化特征及其影响因素[J]. 自然资源学报, 2021 , 36(2) : 411 -419 . DOI: 10.31497/zrzyxb.20210211
Hebei is the most polluted province in China. It is significant to study the spatio-temporal variation of air pollution and its influencing factors. Based on the daily air quality index (AQI), meteorological data and socio-economic data, the spatial and temporal variation characteristics of air quality index and its relationship with influencing factors in Hebei province were examined by statistical analysis and spatial interpolation. The results show that air pollution mainly occurs in the central and southern parts of the province, especially in Handan, Xingtai and Shijiazhuang, but rarely in the north. The air quality index of the province shows a decreasing trend year by year, with a linear trend of -8.845/year, and it has a good negative correlation with wind speed, temperature, precipitation, gross domestic product (GDP), population, electricity consumption and secondary industry, while it has a positive correlation with sulfur dioxide emissions and nitrogen oxide emissions. Adverse climatic conditions are the inducement of atmospheric pollution, and high emission intensity is the main cause of heavy atmospheric pollution. With the rapid economic development and the increase of money invested in full control of air pollution in Hebei, its economy and pollution are on the right side of the EKC curve of environmental Kuznets. The relationship between air quality and economic development in Hebei has passed the "inflection point" of the environmental Kuznets curve. These results can provide theoretical basis for air pollution control in this province.
Key words: air pollution; Hebei province; air quality index; temperature; precipitation; socio-economy
表1 AQI范围及相应的空气质量类别Table 1 Air quality index scope and air quality classifications |
| AQI | 等级 | 状况 |
|---|---|---|
| 0~50 | Ⅰ | 优 |
| 51~100 | Ⅱ | 良 |
| 101~150 | Ⅲ | 轻度污染 |
| 151~200 | Ⅳ | 中度污染 |
| 201~300 | Ⅴ | 重度污染 |
| >300 | Ⅵ | 严重污染 |
表2 河北省空气质量监测数据的相对误差Table 2 Relative error of air quality monitoring data in Hebei province (%) |
| 城市 | PM2.5 | PM10 | SO2 | CO | NO2 | O3 |
|---|---|---|---|---|---|---|
| 保定 | 3.5982 | 2.9698 | 4.3388 | 3.9598 | 2.3788 | 2.8441 |
| 沧州 | 3.153 | 2.6298 | 3.3088 | 3.1208 | 2.0205 | 2.483 |
| 承德 | 3.6425 | 2.8918 | 3.3894 | 2.7278 | 1.983 | 2.4802 |
| 邯郸 | 3.3848 | 2.644 | 3.8454 | 3.0217 | 2.0908 | 2.7091 |
| 衡水 | 3.2628 | 2.8221 | 3.8933 | 2.9621 | 2.2107 | 2.4266 |
| 廊坊 | 4.082 | 3.1345 | 4.9266 | 3.3862 | 2.1872 | 2.8967 |
| 秦皇岛 | 3.7035 | 2.906 | 3.6954 | 3.2137 | 1.8202 | 2.5462 |
| 石家庄 | 3.8578 | 3.0932 | 4.1925 | 3.649 | 2.2642 | 2.9504 |
| 唐山 | 3.3202 | 2.6416 | 3.2847 | 2.7789 | 1.6204 | 2.844 |
| 邢台 | 3.5518 | 2.7978 | 3.9367 | 3.0046 | 1.8408 | 2.8689 |
| 张家口 | 3.8823 | 3.2757 | 4.542 | 2.6313 | 2.395 | 2.0458 |
表3 2014—2018年河北省AQI年际变化趋势Table 3 The interannual trends of AQI in Hebei province from 2014 to 2018 |
| 地区 | 保定 | 沧州 | 承德 | 邯郸 | 衡水 | 廊坊 | 秦皇岛 | 石家庄 | 唐山 | 邢台 | 张家口 | 河北省 |
|---|---|---|---|---|---|---|---|---|---|---|---|---|
| 变化趋势 | -11.683 | -3.8667 | -4.333 | -6.0083 | -11.508 | -9.975 | -2.4583 | -7.225 | -8.4917 | -10.775 | 0.375 | -8.845 |
表4 2018年河北省AQI分级出现频率Table 4 The occurence frequency of the grading AQI in Hebei province in 2018 (%) |
| 城市 | 优 | 良 | 轻度污染 | 中度污染 | 重度污染 | 严重污染 |
|---|---|---|---|---|---|---|
| 保定 | 6.85 | 38.36 | 33.15 | 13.42 | 7.67 | 0.27 |
| 沧州 | 5.21 | 47.12 | 30.68 | 12.05 | 3.56 | 0.55 |
| 承德 | 22.19 | 55.34 | 14.52 | 4.66 | 0.55 | 0 |
| 邯郸 | 0.55 | 43.56 | 34.25 | 13.15 | 5.48 | 1.92 |
| 衡水 | 2.47 | 54.25 | 28.49 | 9.32 | 4.56 | 1.1 |
| 廊坊 | 18.36 | 50.96 | 24.38 | 9.32 | 2.47 | 0.27 |
| 秦皇岛 | 18.36 | 61.92 | 15.89 | 2.47 | 0.82 | 0 |
| 石家庄 | 1.37 | 40 | 32.6 | 13.42 | 9.32 | 1.1 |
| 唐山 | 5.48 | 50.96 | 27.4 | 9.04 | 3.29 | 0.55 |
| 邢台 | 2.74 | 46.85 | 29.86 | 11.23 | 6.58 | 1.37 |
| 张家口 | 27.95 | 51.23 | 15.62 | 1.64 | 0.55 | 0 |
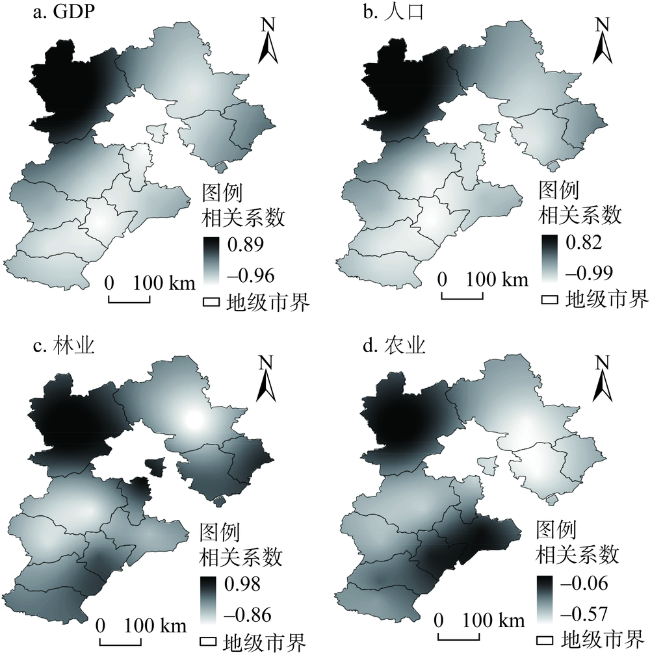
表5 河北省社会经济因素与AQI的相关系数Table 5 Correlation coefficients between socio-economic factors and AQI in Hebei province |
| 因素 | GDP | 人均GDP | 人口 | 电力消费量 | SO2排放量 | NOx排放量 |
|---|---|---|---|---|---|---|
| 相关系数 | -0.9344** | -0.9274** | -0.9768** | -0.3259** | 0.9462** | 0.9780** |
| 因素 | 第三产业 | 第一产业 | 第二产业 | 农业 | 耕地面积 | 森林面积 |
| 相关系数 | 0.7677** | 0.4897** | -0.7243** | -0.6167** | 0.9997** | -0.9968** |
注:**代表通过了0.01显著性水平检验。 |
| [1] |
|
| [2] |
|
| [3] |
|
| [4] |
尹志聪, 王会军, 袁东敏. 华北黄淮冬季霾年代际增多与东亚冬季风的减弱. 科学通报, 2015,60(15):1395-1401.
[
|
| [5] |
梅梅, 朱蓉, 孙朝阳. 京津冀及周边“2+26”城市秋冬季大气重污染气象条件及其气候特征研究. 气候变化研究进展, 2019,15(3):270-281.
[
|
| [6] |
刘海猛, 方创琳, 黄解军, 等. 京津冀城市群大气污染的时空特征与影响因素解析. 地理学报, 2018,73(1):177-191.
[
|
| [7] |
周兆媛, 张时煌, 高庆先, 等. 京津冀地区气象要素对空气质量的影响及未来变化趋势分析. 资源科学, 2014,36(1):191-199.
[
|
| [8] |
魏文秀, 张欣, 田国强. 河北霾分布与地形和风速关系分析. 自然灾害学报, 2010,19(1):49-52.
[
|
| [9] |
丁一汇, 王会军. 近百年中国气候变化科学问题的新认识. 科学通报, 2016,61(10):1029-1041.
[
|
| [10] |
王静, 邱粲, 刘焕彬, 等. 山东重点城市空气质量及其与气象要素的关系. 生态环境学报, 2013,22(4):644-649.
[
|
| [11] |
李婷苑, 邓雪娇, 范绍佳, 等. 2010年广州亚运期间空气质量与污染气象条件分析. 环境科学, 2012,33(9):2932-2938.
[
|
| [12] |
景瑞环, 麻金继, 汪超. 基于多源数据的PM2.5反演方法. 大气与环境光学学报, 2015,1:51-62.
[
|
| [13] |
丁一汇, 柳艳菊. 近50年我国雾和霾的长期变化特征及其与大气湿度的关系. 中国科学: 地球科学, 2014,44(1):37-48.
[
|
| [14] |
康恒元, 刘玉莲, 李涛. 黑龙江省重点城市AQI指数特征及其与气象要素之关系. 自然资源学报, 2017,32(4):692-703.
[
|
| [15] |
|
| [16] |
蔺雪芹, 王岱. 中国城市空气质量时空演化特征及社会经济驱动力. 地理学报, 2016,71(8):1357-1371.
[
|
| [17] |
姚尧, 李江风, 胡涛, 等. 中国城市NO2浓度的时空分布及社会经济驱动力. 资源科学, 2017,39(7):1383-1393.
[
|
| [18] |
|
| [19] |
杨昆, 杨玉莲, 朱彦辉, 等. 中国PM2.5污染与社会经济的空间关系及成因. 地理研究, 2016,35(6):1051-1060.
[
|
| [20] |
贺灿飞, 张腾, 杨晟朗. 环境规制效果与中国城市空气污染. 自然资源学报, 2013,28(10):1651-1663.
[
|
| [21] |
徐冬, 黄震方, 黄睿, 等. 中国中东部雾霾污染与入境旅游的时空动态关联分析. 自然资源学报, 2019,34(5):1108-1120.
[
|
| [22] |
王艳华, 苗长虹, 胡志强, 等. 专业化、多样性与中国省域工业污染排放的关系. 自然资源学报, 2019,34(3):586-599.
[
|
/
| 〈 |
|
〉 |