
山东省农业多功能的时空演化特征与驱动机制分析
|
刘建志(1994- ),男,山东枣庄人,博士研究生,研究方向为人文地理与乡村发展。E-mail: liujz027@nenu.edu.cn |
收稿日期: 2019-11-01
要求修回日期: 2020-03-03
网络出版日期: 2021-02-28
基金资助
国家社会科学基金项目(15BJL108)
版权
Spatio-temporal evolution characteristics and driving mechanisms of agricultural multifunctions in Shandong province
Received date: 2019-11-01
Request revised date: 2020-03-03
Online published: 2021-02-28
Copyright
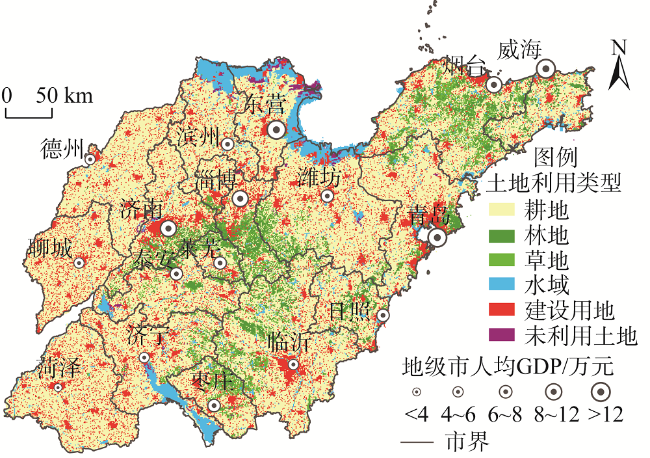
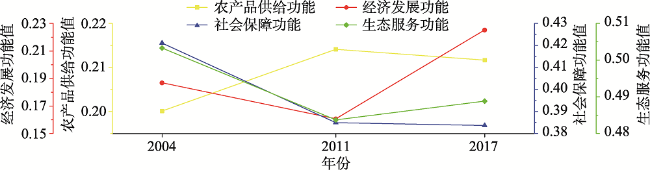
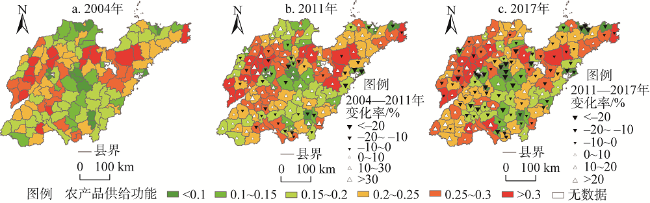
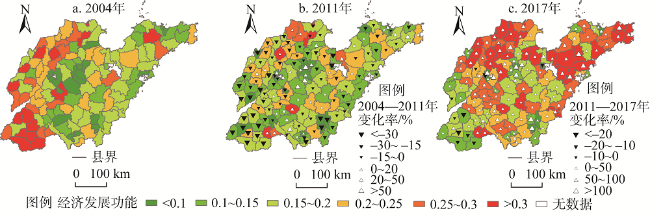
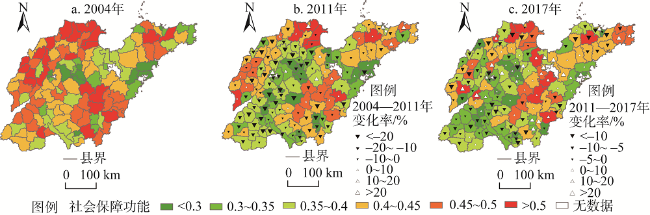
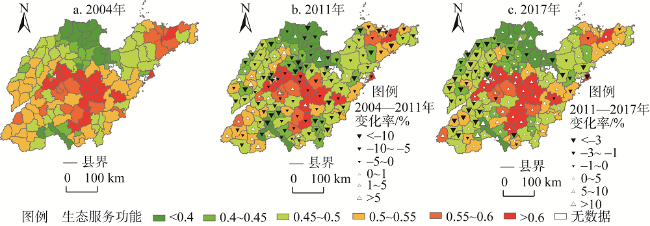
农业供给侧改革与乡村振兴背景下,深入挖掘各地区农业多种功能,统筹不同农业功能特征地域的协调发展,成为促进农业增收、实现农业可持续发展、保障食物安全的关键。农业多功能的演变受到区域农业资源禀赋与社会经济发展水平和阶段的复杂影响。以山东省为例,选取2004年、2011年、2017年三个时间截面,构建农业多功能评价指标体系,运用空间错位指数、回归分析等方法对县域农业多功能的时空演变规律与驱动机制进行分析。研究发现:(1)2004—2017年,山东省农业的农产品供给功能和经济发展功能分别呈先升后降和先降后升的增长态势,社会保障功能和生态服务功能分别呈持续下降和先降后升的下降趋势。(2)研究期内,农产品供给功能与生态服务功能对农业资源禀赋依赖较强,分别呈现出沿平原—丘陵—山地递减与递增的空间格局;经济发展功能与社会保障功能受社会经济发展水平和阶段影响较大,时空差异明显。(3)各驱动因子对于同一功能中不同要素的作用方向与强度存在差异,引发农业各功能结构的变化。基于功能视角提出山东省农业转型发展的路径选择与分区优化策略。
刘建志 , 房艳刚 , 王如如 . 山东省农业多功能的时空演化特征与驱动机制分析[J]. 自然资源学报, 2020 , 35(12) : 2901 -2915 . DOI: 10.31497/zrzyxb.20201207
Under the background of the agricultural supply-side structural reform and rural revitalization, it is critical to raise farmers' income, realize sustainable agricultural development and guarantee food security by developing multiple agriculture functions in various regions and coordinating the development of regions with different agricultural functional characteristics. The spatio-temporal differentiation of agricultural multifunctions results from the comprehensive effects of the agricultural resource endowments and the socio-economic development level and stages. This paper constructs an evaluation index system of agricultural multifunctions. Taking Shandong province as an example, this paper analyzes the spatio-temporal evolution characteristics and driving mechanisms of agricultural multifunctions at county level from 2004 to 2017 by using spatial mismatch, regression analysis and so on. The results are shown as follows: The spatio-temporal evolution characteristics of agricultural functions in the province were significantly different during 2004-2017. Among them, the agricultural products supplying function showed a growth trend of increasing first and decreasing afterwards, and its high-value areas were mainly distributed in the "half-ring" area surrounding the south-central mountainous area of Shandong province; the economic development function showed a growth trend of decreasing first and increasing afterwards, and its high-value areas were transformed from traditional agricultural areas with high proportion of agriculture to modern agricultural areas with high agricultural output value and distinctive agricultural areas which have high-value agricultural products or prosperous correlative industries such as agricultural tourism; the social security function showed a downward trend, and its high-value areas were concentrated in the grain producing areas with large farmland area per labor and the mountainous-hilly areas with distinctive agriculture; the ecological service function showed a downward trend of decreasing first and increasing afterwards, and its high-value areas were mainly distributed in mountainous-hilly areas with good ecological basement. The impact of factors on different elements of the same function differed in direction and extent, which resulted in changes of agricultural functional structure. Finally, based on the functional perspective, this paper proposes the development paths and zoning optimization strategies for agriculture in Shandong province.
表1 农业多功能的评价指标体系Table 1 The evaluation index system of agricultural multifunctions |
| 准则层 | 要素层 | 指标层 | 指标计算方法 | 权重 | 指标来源 |
|---|---|---|---|---|---|
| 农产品供给功能F1 | 粮食供给能力F11 | 粮食自给率/(kg/人) | 粮食产量/区域总人口-400 kg/人 | 0.1355 | 房艳刚等[17] |
| 粮食单产/(t/hm2) | 粮食产量/粮食播种面积 | 0.0286 | 鲁莎莎等[5] | ||
| 非粮供给能力F12 | 人均蔬菜产量/(kg/人) | 蔬菜产量/区域总人口 | 0.2020 | ||
| 人均水果产量/(kg/人) | 水果产量/区域总人口 | 0.0994 | |||
| 人均油料作物产量/(kg/人) | 油料作物产量/区域总人口 | 0.1690 | |||
| 人均肉蛋奶产量/(kg/人) | 肉蛋奶产量/区域总人口 | 0.1172 | |||
| 人均水产品产量/(kg/人) | 水产品产量/区域总人口 | 0.1147 | |||
| 供给稳定性F13 | 有效灌溉面积占比/% | 有效灌溉面积/耕地面积 | 0.1336 | 谭雪兰等[18] | |
| 经济发展功能F2 | 经济比例F21 | 第一产业增加值占比/% | 一产增加值/地区生产总值 | 0.3726 | 房艳刚等[17] |
| 经济效益F22 | 人均第一产业增加值/(元/人) | 一产增加值/区域总人口 | 0.1408 | ||
| 经济带动F23 | 人均农林牧渔服务业增加值/(元/人) | 农林牧渔服务业增加值/区域总人口 | 0.2300 | 房艳刚等[17] | |
| 县域农业旅游示范点个数/个 | 原国家旅游局发布的“全国工农业旅游示范点”名录与山东旅游政务网发布的“山东省工农业旅游示范点”名录,共计1096个农业旅游示范点 | 0.2566 | |||
| 社会保障功能F3 | 就业机会F31 | 乡村农业就业率/% | 农林牧渔业从业人口/乡村从业人口 | 0.4234 | 张英男等[25] |
| 地均机械总动力/(kW/hm2) | 农业机械总动力/耕地面积 | 0.1685 | 张英男等[25] | ||
| 就业收入F32 | 劳均第一产业增加值/(元/人) | 一产增加值/农林牧渔业从业人口 | 0.2590 | 谭雪兰等[18] | |
| 人均耕地面积/(hm2/人) | 耕地面积/乡村总人口 | 0.1490 | 宋小青等[26] | ||
| 生态服务功能F4 | 生态基底F41 | 森林覆盖率/% | 森林面积/行政区面积 | 0.3133 | 李梦桃等[14] |
| NDVI均值 | 区域全年NDVI均值 | 0.2328 | 彭建等[27] | ||
| 农田生态系统多样性指数 | -Σpi ln(pi),pi表示各种农作物播种面积比例 | 0.2269 | 宋小青等[26] | ||
| 环境质量F42 | 化肥施用负荷/(kg/hm2) | 化肥施用量/耕地面积 | 0.0972 | 彭建等[27] | |
| 农药施用负荷/(kg/hm2) | 农药施用量/耕地面积 | 0.1298 | 彭建等[27] |
注:人均肉蛋奶产量指标为人均肉产量、人均蛋产量等单项指标极差标准化之后相加得到。 |
图2 2004—2017年山东省农业多功能时序演变特征Fig. 2 Evolution of agricultural multifunctions in Shandong province during 2004-2017 |
表2 2004年、2011年、2017年要素层与其所在功能层空间错位指数Table 2 Spatial mismatch index between element layer and its functional layer in 2004, 2011 and 2017 |
| 要素层 | 2004年 | 2011年 | 2017年 | 要素层 | 2004年 | 2011年 | 2017年 |
|---|---|---|---|---|---|---|---|
| 粮食供给能力 | 0.1556 | 0.1966 | 0.2372 | 经济比例 | 0.1255 | 0.2009 | 0.3235 |
| 非粮供给能力 | 0.1463 | 0.1994 | 0.2367 | 经济效益 | 0.2867 | 0.2294 | 0.2042 |
| 供给稳定性 | 0.2609 | 0.2685 | 0.2818 | 经济带动 | 0.5021 | 0.3570 | 0.2196 |
| 就业机会 | 0.0157 | 0.0441 | 0.0713 | 生态基底 | 0.0515 | 0.0548 | 0.0546 |
| 就业收入 | 0.2230 | 0.2505 | 0.2890 | 环境质量 | 0.0978 | 0.1023 | 0.0974 |
表3 回归分析结果汇总表Table 3 Regression analysis results |
| 影响因子 与统计检验 | F1 | F11 | F12 | F13 | F2 | F21 | F22 |
|---|---|---|---|---|---|---|---|
| lnDem | -0.1898** | -0.4135** | 0.1665** | -0.5242** | -0.1084** | -0.0617** | -0.0984** |
| lnPcy | 0.5868** | 0.3915** | 0.4672** | 0.3774** | 0.2209** | 0.1002** | 0.2580** |
| Pca | -0.0466 | 0.0442 | 0.0170 | -0.2258** | 0.0964 | 0.0175 | 0.1126 |
| lnDis | 0.1497** | 0.1092* | 0.1366** | 0.0484 | 0.0340 | 0.0446 | 0.0906* |
| lnPgdp | 0.0121 | 0.1306 | -0.1045 | 0.1323* | -0.0757 | -0.5823** | 0.4319** |
| Sip | -0.0486 | 0.0234 | -0.0935* | 0.0316 | -0.4025** | -0.3173** | -0.1871** |
| Ur | -0.1193* | -0.2283** | -0.0770 | 0.0363 | -0.2913** | -0.2448** | -0.2205** |
| lnPd | -0.3256** | -0.0435 | -0.4707** | 0.0762 | -0.3715** | -0.2111** | -0.3810** |
| Uur | 0.1766** | 0.0378 | 0.2457** | -0.0349 | 0.1643* | -0.0175 | 0.1580* |
| R2 | 0.6128 | 0.5334 | 0.4820 | 0.5616 | 0.5153 | 0.7817 | 0.6218 |
| 调整R2 | 0.6035 | 0.5222 | 0.4696 | 0.5511 | 0.5037 | 0.7765 | 0.6128 |
| F | 76.5800** | 45.4800** | 46.2100** | 77.7600** | 54.6500** | 96.0000** | 42.7400** |
| 影响因子 与统计检验 | F23 | F3 | F31 | F32 | F4 | F41 | F42 |
| lnDem | -0.0610 | 0.0318 | 0.0654 | -0.0868* | 0.6928** | 0.6985** | 0.1986** |
| lnPcy | 0.1357* | 0.1965** | 0.1196* | 0.1863** | -0.0922 | 0.0210 | -0.3417** |
| Pca | 0.0902 | — | — | — | 0.1222 | 0.0390 | 0.2678** |
| lnDis | -0.0302 | 0.0491 | -0.0189 | 0.1707** | -0.0446 | -0.0448 | -0.0131 |
| lnPgdp | 0.4295** | -0.2198** | -0.3849** | 0.4304** | -0.2514** | -0.1651* | -0.3165** |
| Sip | -0.1809** | -0.2247** | -0.1512** | -0.1761** | 0.0429 | 0.0344 | 0.0369 |
| Ur | -0.0851 | 0.2856** | 0.1285 | 0.3861** | -0.2178** | -0.2708** | 0.0789 |
| lnPd | -0.1953* | -0.7444** | -0.5164** | -0.5444** | 0.0565 | 0.0178 | 0.1246 |
| Uur | 0.2206** | -0.1476* | -0.1964** | 0.1309* | 0.1578** | 0.1015 | 0.2046** |
| R2 | 0.4290 | 0.4783 | 0.4837 | 0.5933 | 0.5660 | 0.5692 | 0.3173 |
| 调整R2 | 0.4154 | 0.4672 | 0.4727 | 0.5847 | 0.5556 | 0.5589 | 0.3010 |
| F | 22.7000** | 31.5000** | 46.3200** | 50.4700** | 52.8000** | 53.2000** | 22.1800** |
注:*、**分别表示在0.05、0.01的显著性水平下显著;为避免因变量与自变量存在重复信息,在社会保障功能及其要素的回归分析中,劳均耕地面积未被纳入方程。 |
| [1] |
黄季焜. 新时期的中国农业发展: 机遇, 挑战和战略选择. 中国科学院院刊, 2013,28(3):295-300.
[
|
| [2] |
陈锡文. 中国农业发展形势及面临的挑战. 农村经济, 2015, (1):3-7.
[
|
| [3] |
黄宗智, 彭玉生. 三大历史性变迁的交汇与中国小规模农业的前景. 中国社会科学, 2007, (4):74-88.
[
|
| [4] |
黄季焜. 四十年中国农业发展改革和未来政策选择. 农业技术经济, 2018, (3):4-15.
[
|
| [5] |
鲁莎莎, 刘彦随, 秦凡. 环渤海地区农业地域功能演进及其影响因素. 地理学报, 2019,74(10):2011-2026.
[
|
| [6] |
|
| [7] |
|
| [8] |
|
| [9] |
|
| [10] |
|
| [11] |
孙新章. 新中国60年来农业多功能性演变的研究. 中国人口·资源与环境, 2010,20(1):71-75.
[
|
| [12] |
刘玉, 冯健. 城乡结合部农业地域功能实现程度及变化趋势: 以北京为例. 地理研究, 2017,36(4):673-683.
[
|
| [13] |
鲁莎莎, 刘彦随, 关兴良. 农业地域功能的时空格局与演进特征: 以106国道沿线典型样带区为例. 中国土地科学, 2014,28(3):67-75.
[
|
| [14] |
李梦桃, 周忠学. 基于多维评价模型的都市农业多功能发展模式探究. 中国生态农业学报, 2016,24(9):1275-1284.
[
|
| [15] |
|
| [16] |
|
| [17] |
房艳刚, 刘本城, 刘建志. 农业多功能的地域类型与优化策略: 以吉林省为例. 地理科学进展, 2019,38(9):1349-1360.
[
|
| [18] |
谭雪兰, 安悦, 苏洋, 等. 长株潭地区农业功能的时空变化特征及发展策略研究. 地理科学, 2018,38(5):708-716.
[
|
| [19] |
|
| [20] |
|
| [21] |
许凤娇, 吕晓, 陈昌玲. 山东省城乡建设用地转型的时空格局. 自然资源学报, 2017,32(9):1554-1567.
[
|
| [22] |
张祖陆, 姜鲁光, 李子君. 山东地理. 北京: 北京师范大学出版社, 2014: 121-146.
[
|
| [23] |
王赛男, 李建鸿, 蒲俊兵, 等. 气候和人类活动对典型岩溶地下河系统径流年际变化的影响. 自然资源学报, 2019,34(4):759-770.
[
|
| [24] |
蔡昉. 农业劳动力转移潜力耗尽了吗?. 中国农村经济, 2018, (9):2-13.
[
|
| [25] |
张英男, 龙花楼, 戈大专, 等. 黄淮海平原耕地功能演变的时空特征及其驱动机制. 地理学报, 2018,73(3):518-534.
[
|
| [26] |
宋小青, 吴志峰, 欧阳竹. 1949年以来中国耕地功能变化. 地理学报, 2014,69(4):435-447.
[
|
| [27] |
彭建, 赵士权, 田璐, 等. 北京都市农业多功能性动态. 中国农业资源与区划, 2016,37(5):152-158.
[
|
| [28] |
胡小宁, 谢晓振, 郭满才, 等. 生态技术评价方法与模型研究: 理论模型设计. 自然资源学报, 2018,33(7):1152-1164.
[
|
| [29] |
罗成, 蔡银莺. 湖北省农产品主产区耕地资源功能的时空演变. 经济地理, 2016,36(3):153-161.
[
|
| [30] |
陈乔, 程成, 田芮凡. 东盟旅桂“客流量—景区—酒店”空间错位及演变. 经济地理, 2017,37(9):192-199.
[
|
| [31] |
唐华俊, 罗其友. 农业区域发展学导论. 北京: 科学出版社, 2008: 127-157.
[
|
| [32] |
|
| [33] |
温铁军, 董筱丹, 石嫣. 中国农业发展方向的转变和政策导向: 基于国际比较研究的视角. 农业经济问题, 2010,31(10):88-94.
[
|
| [34] |
陆益龙. 后乡土中国. 北京: 商务印书馆, 2017: 149-162.
[
|
| [35] |
彭建, 刘志聪, 刘焱序. 农业多功能性评价研究进展. 中国农业资源与区划, 2014,35(6):1-8.
[
|
/
| 〈 |
|
〉 |